Volume 2a: Permafrost-Engineering
Permafrost as a Natural Phenomenon
Map of the northern part of the globe, centered on the North Pole
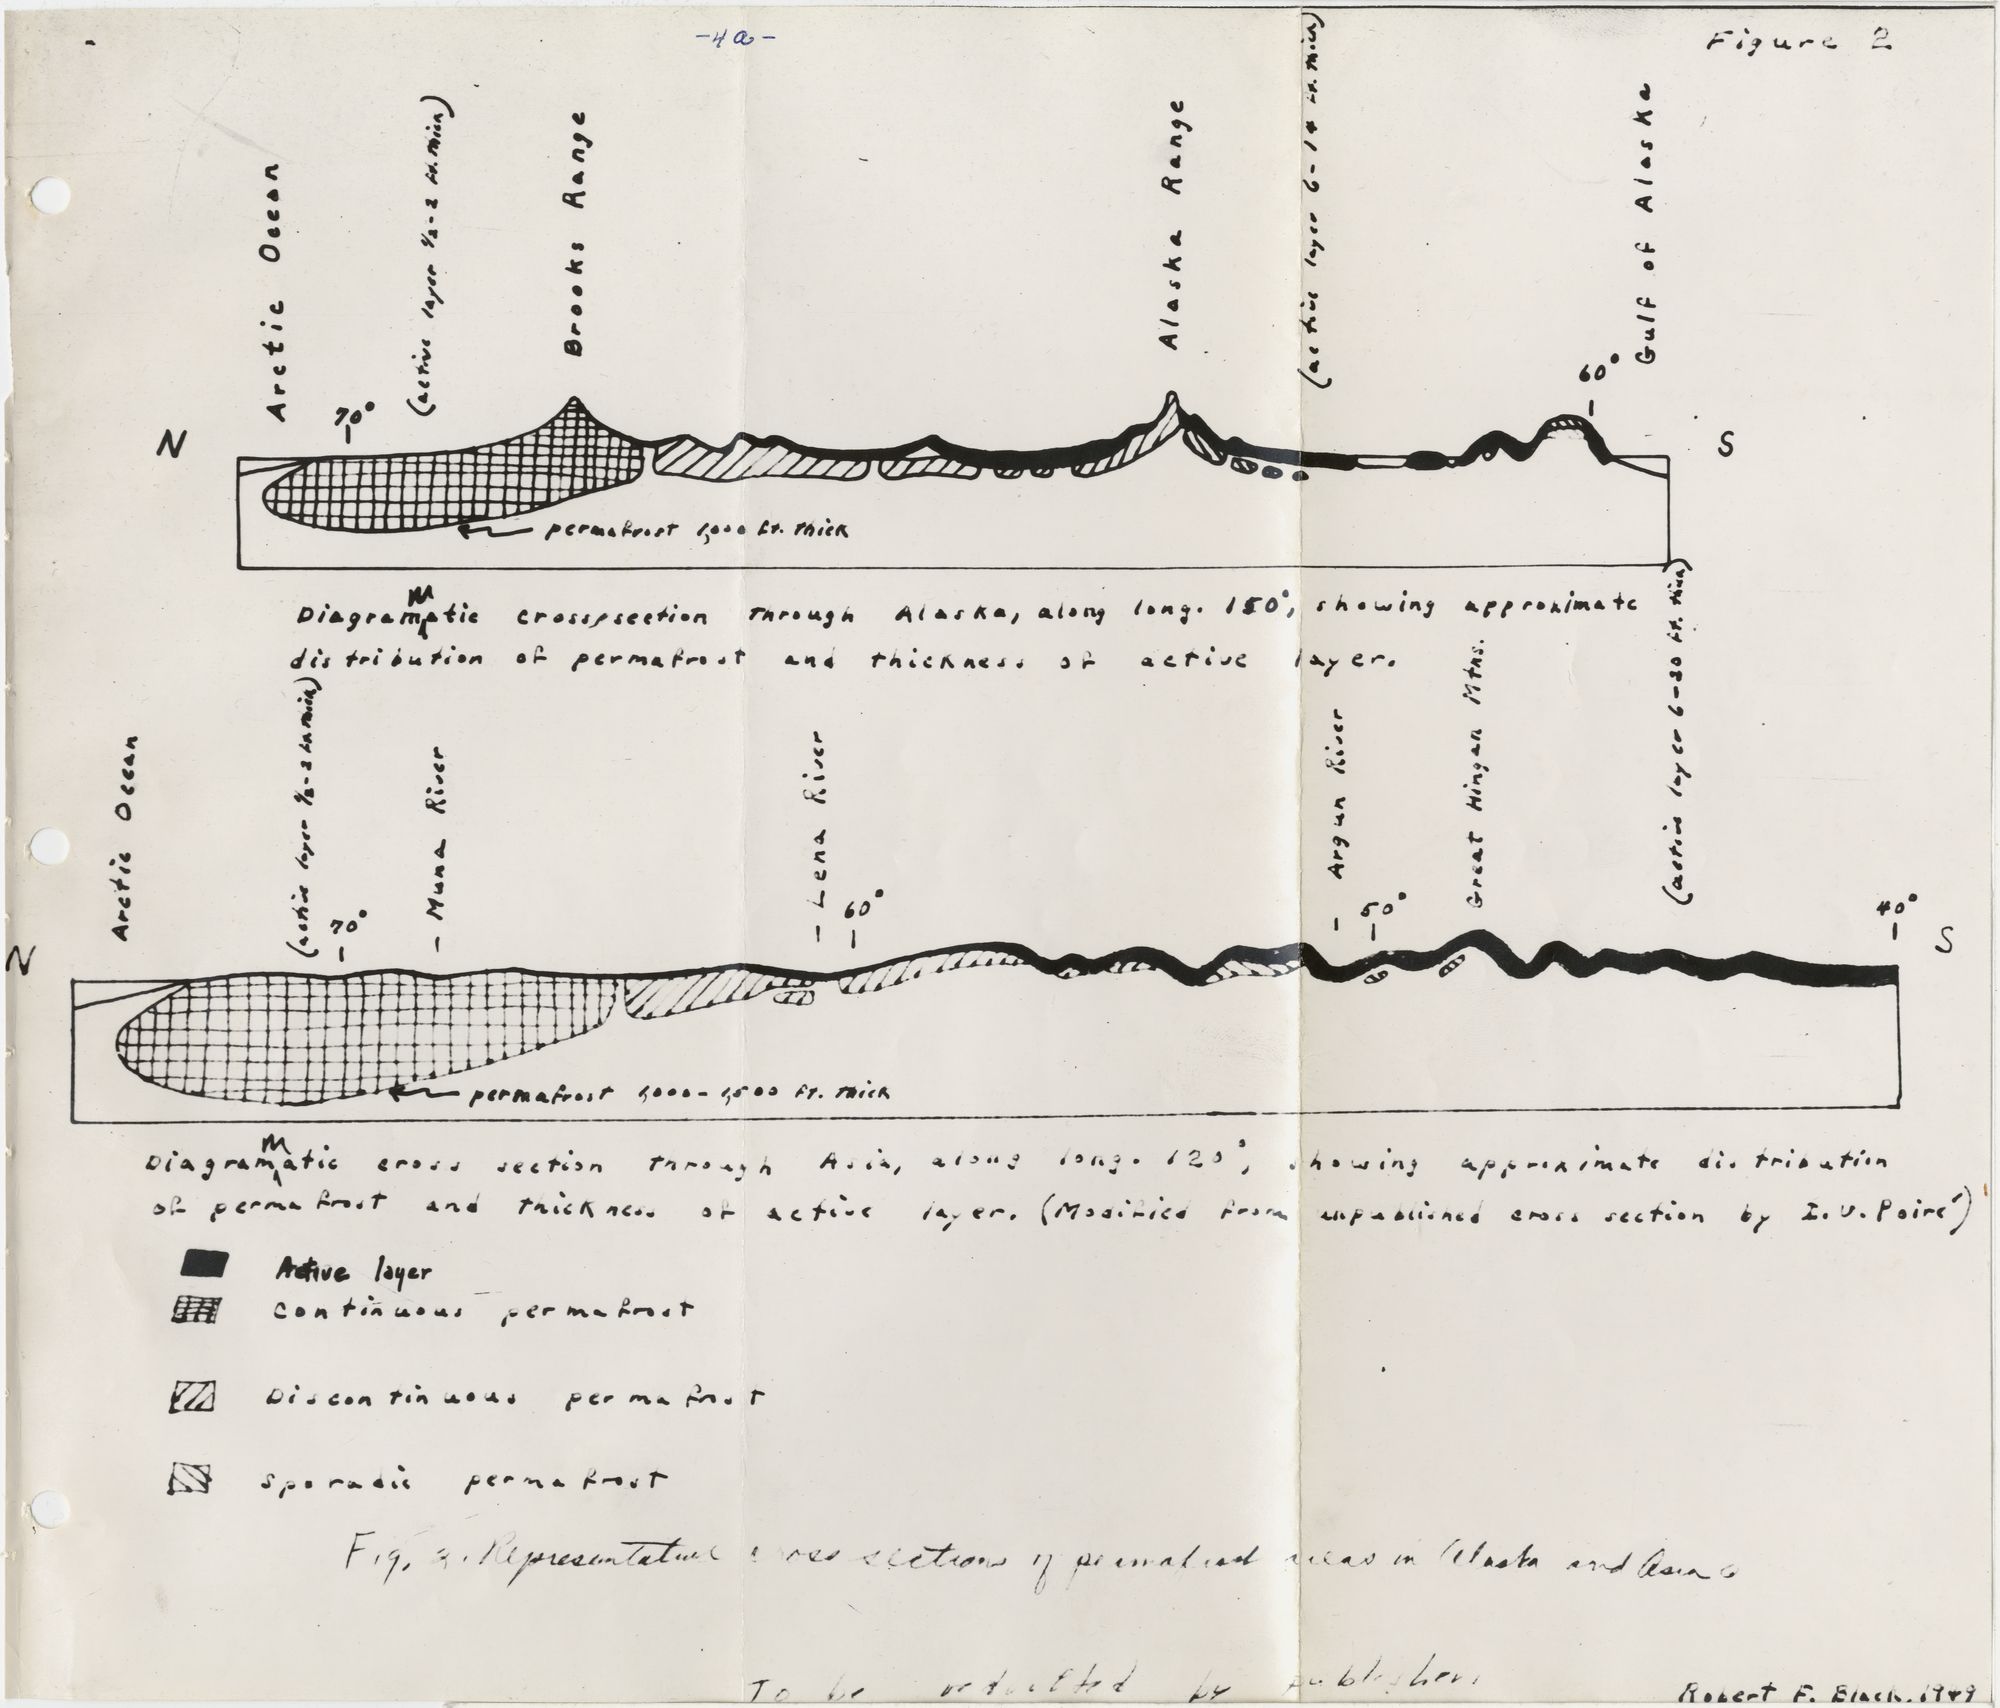
[Handwritten caption reads:] Diagrammatic cross section through Asia, along long. 120 °, showing approximate distribution of permafrost and thickness of active layer. (Modified from unpublished cross section by I. U. Poiré)
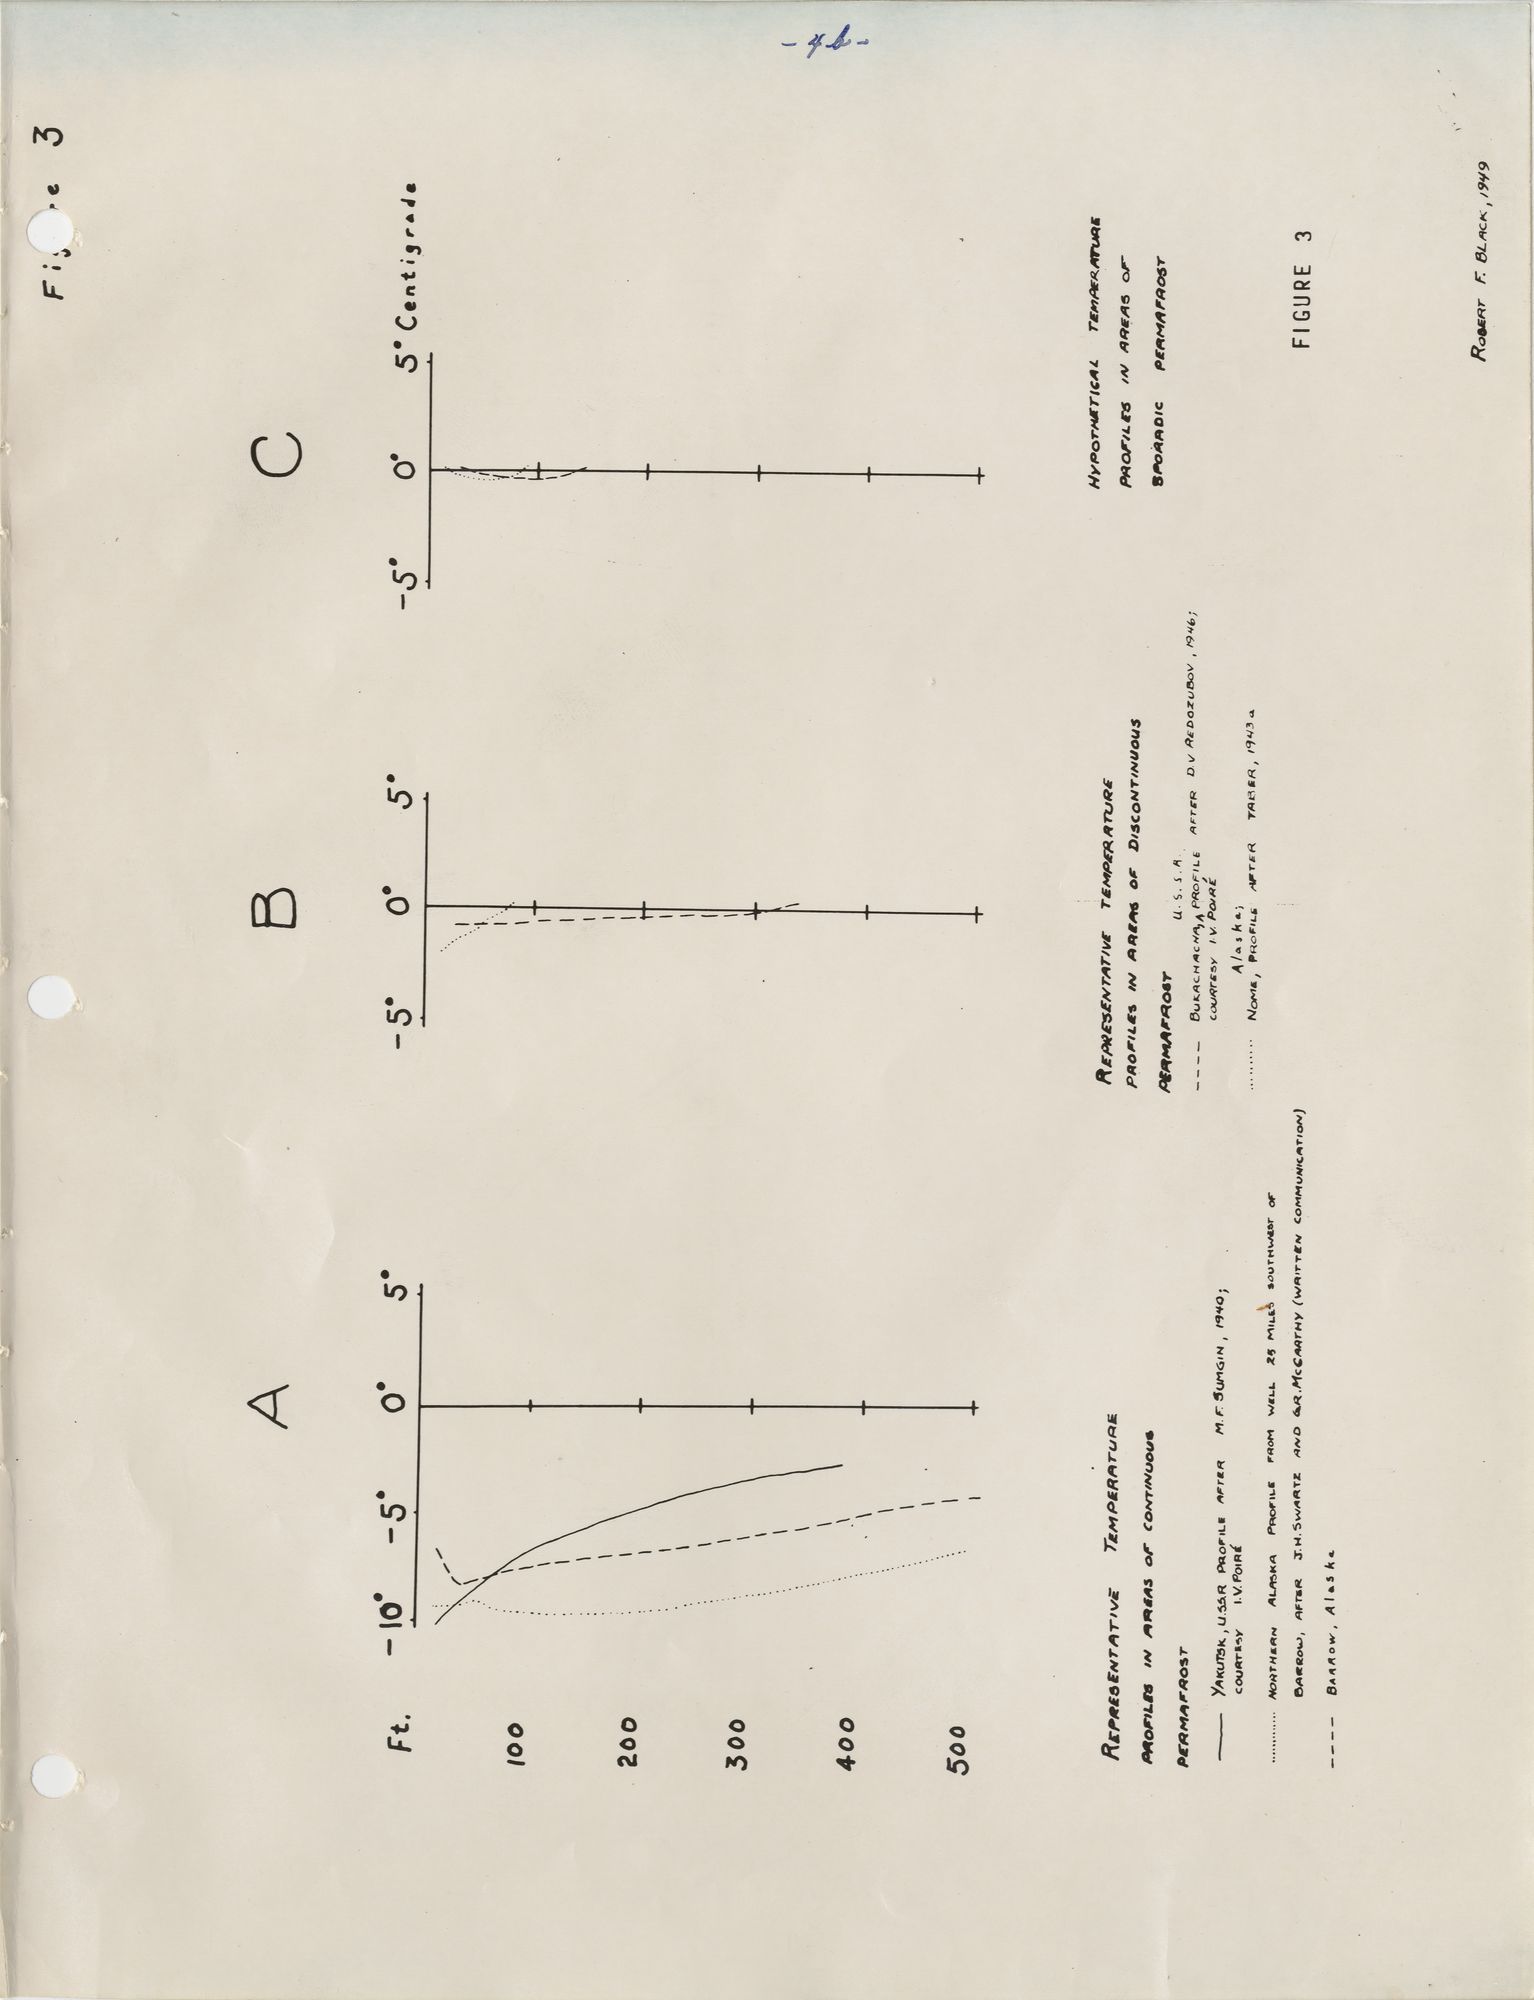
Three graphs, labeled "A Representative Temperature Profiles in Areas of Continuous Permafrost"; "B Representative Temperature Profiles in Areas of Discontinuous Permafrost"; "C Hypothetical Temperature Profiles in Areas of Sporadic Permafrost"
Engineering Problems and Construction in Permafrost Regions

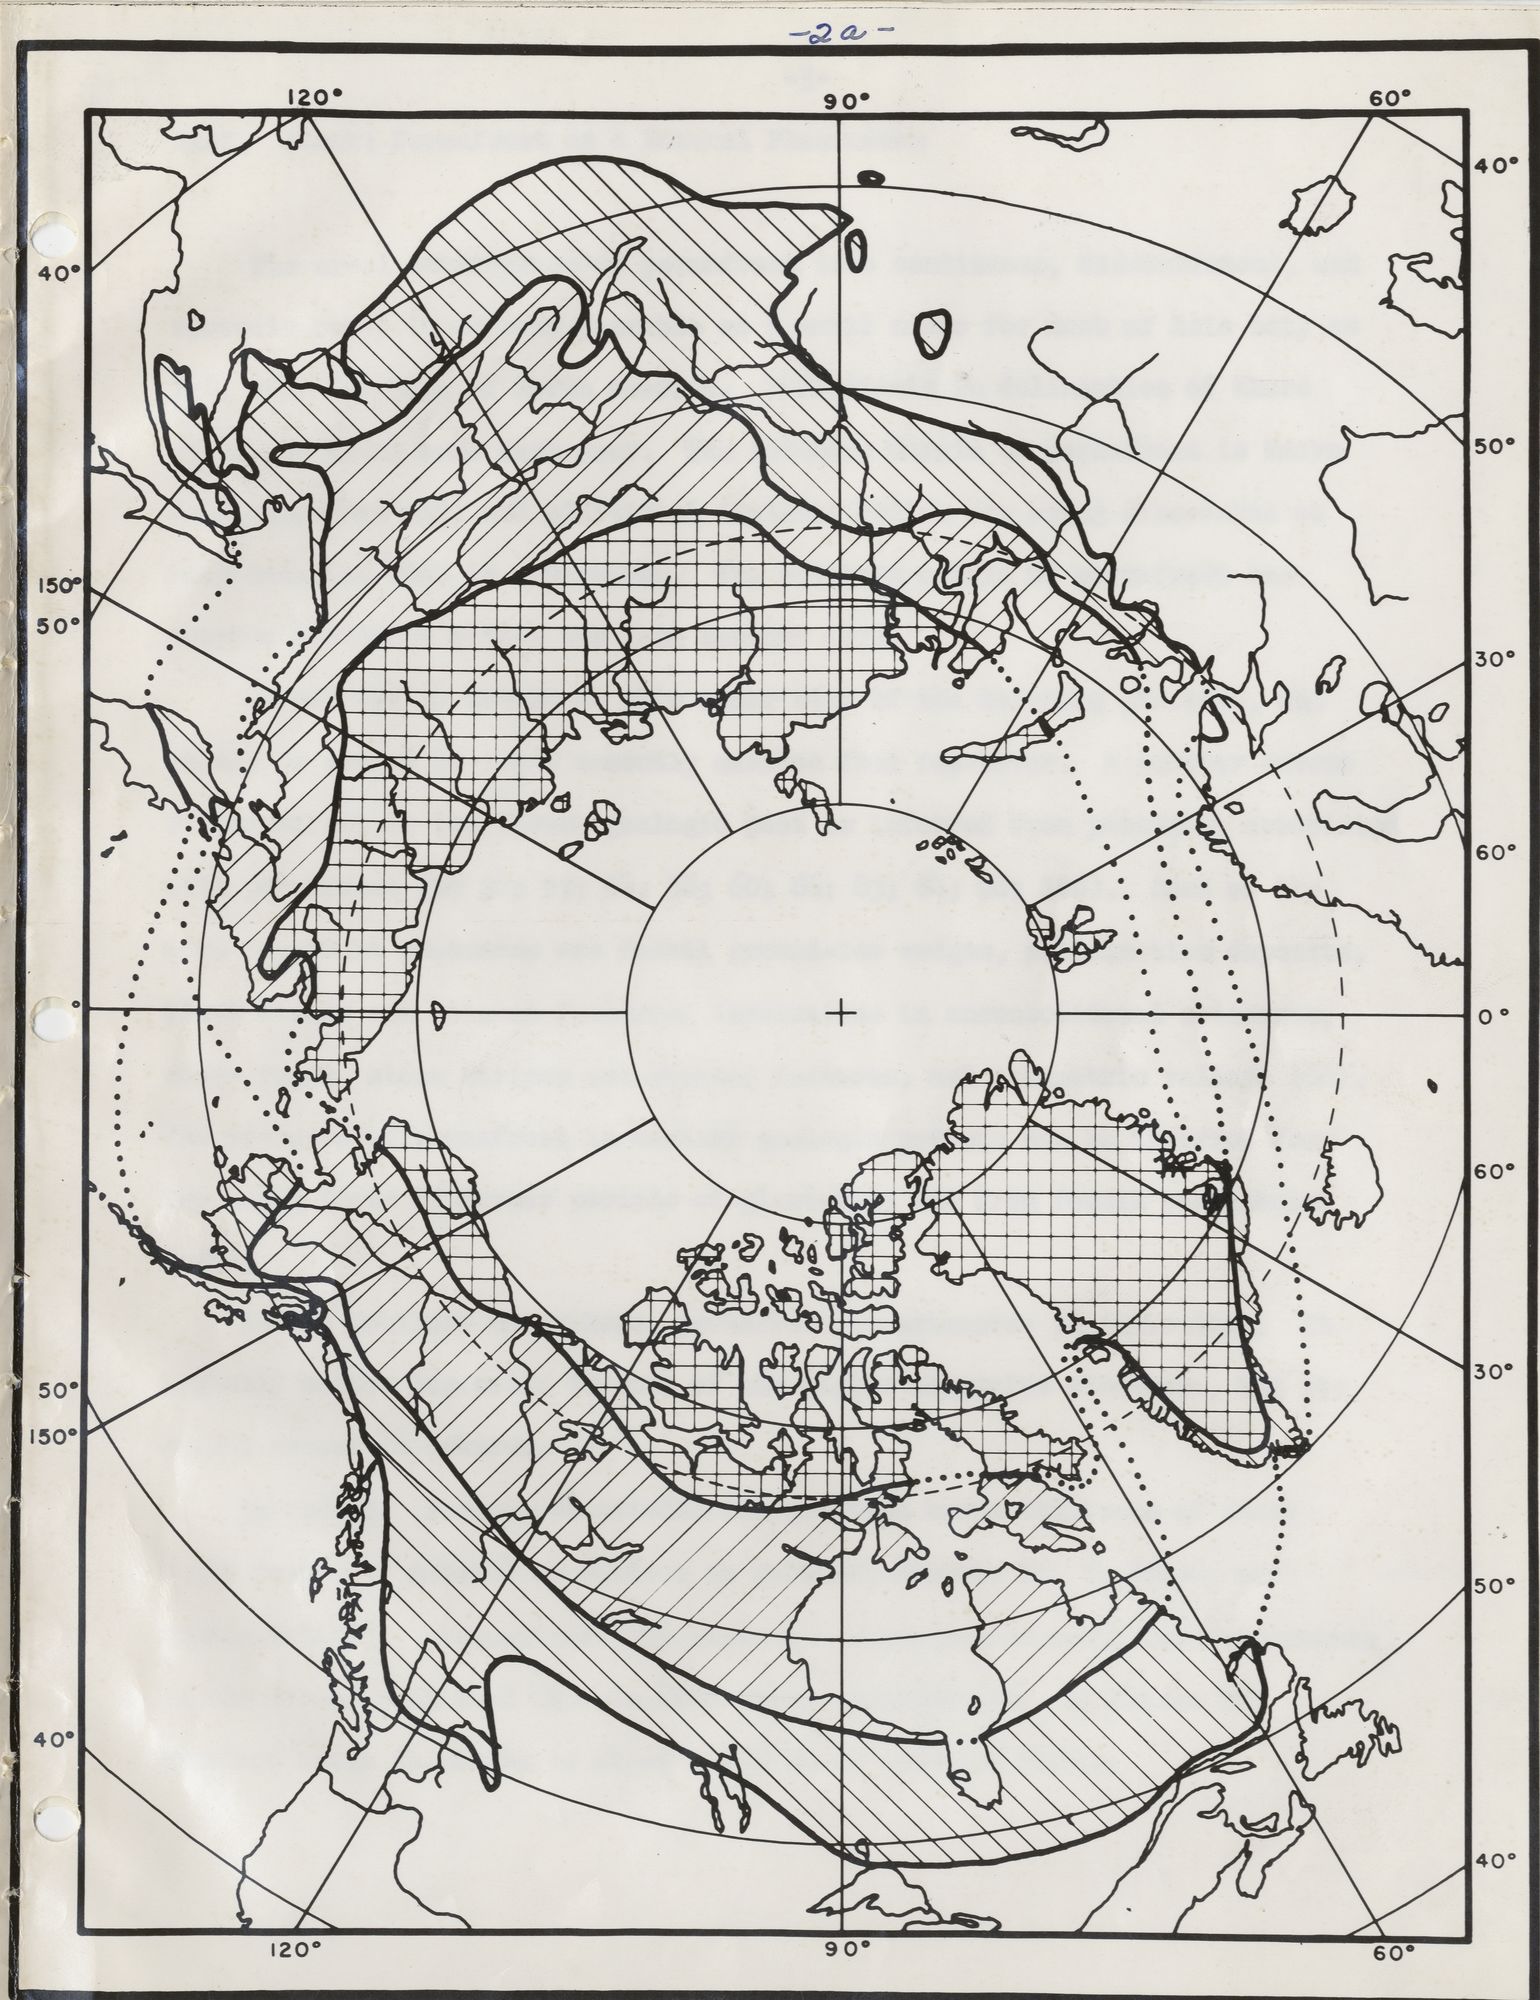
Map showing approximate limits of area mainly underlain by permafrost in Northern Hemisphere. Because of local conditions, there are areas within these limits not underlain by permanently frozen ground.
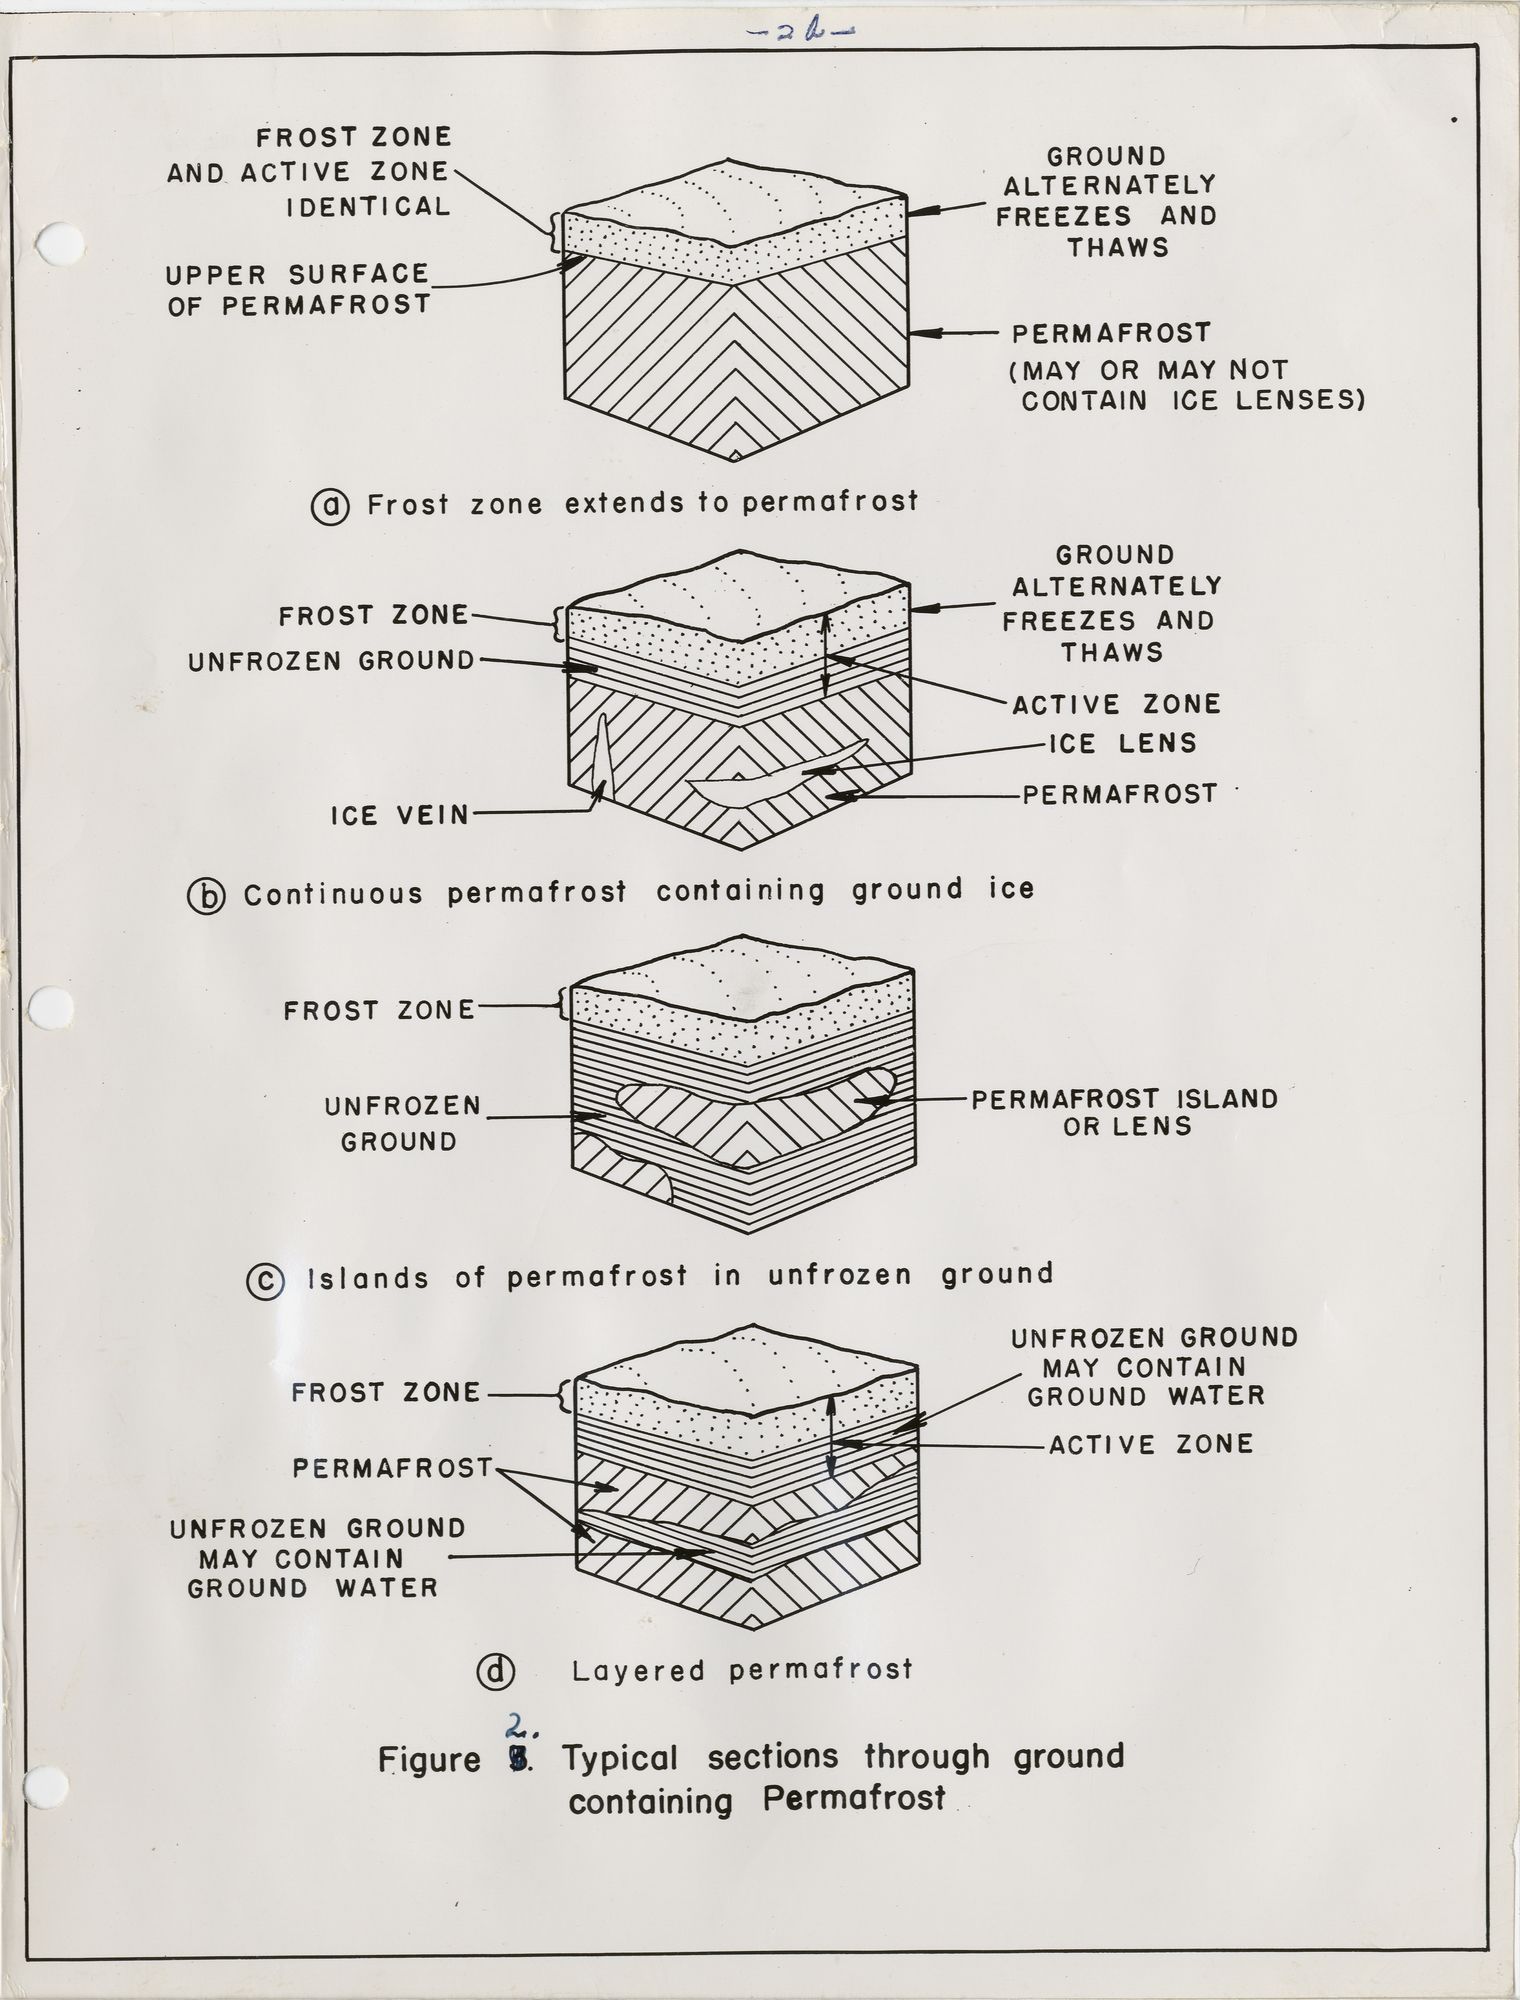
Typical sections through ground containing Permafrost
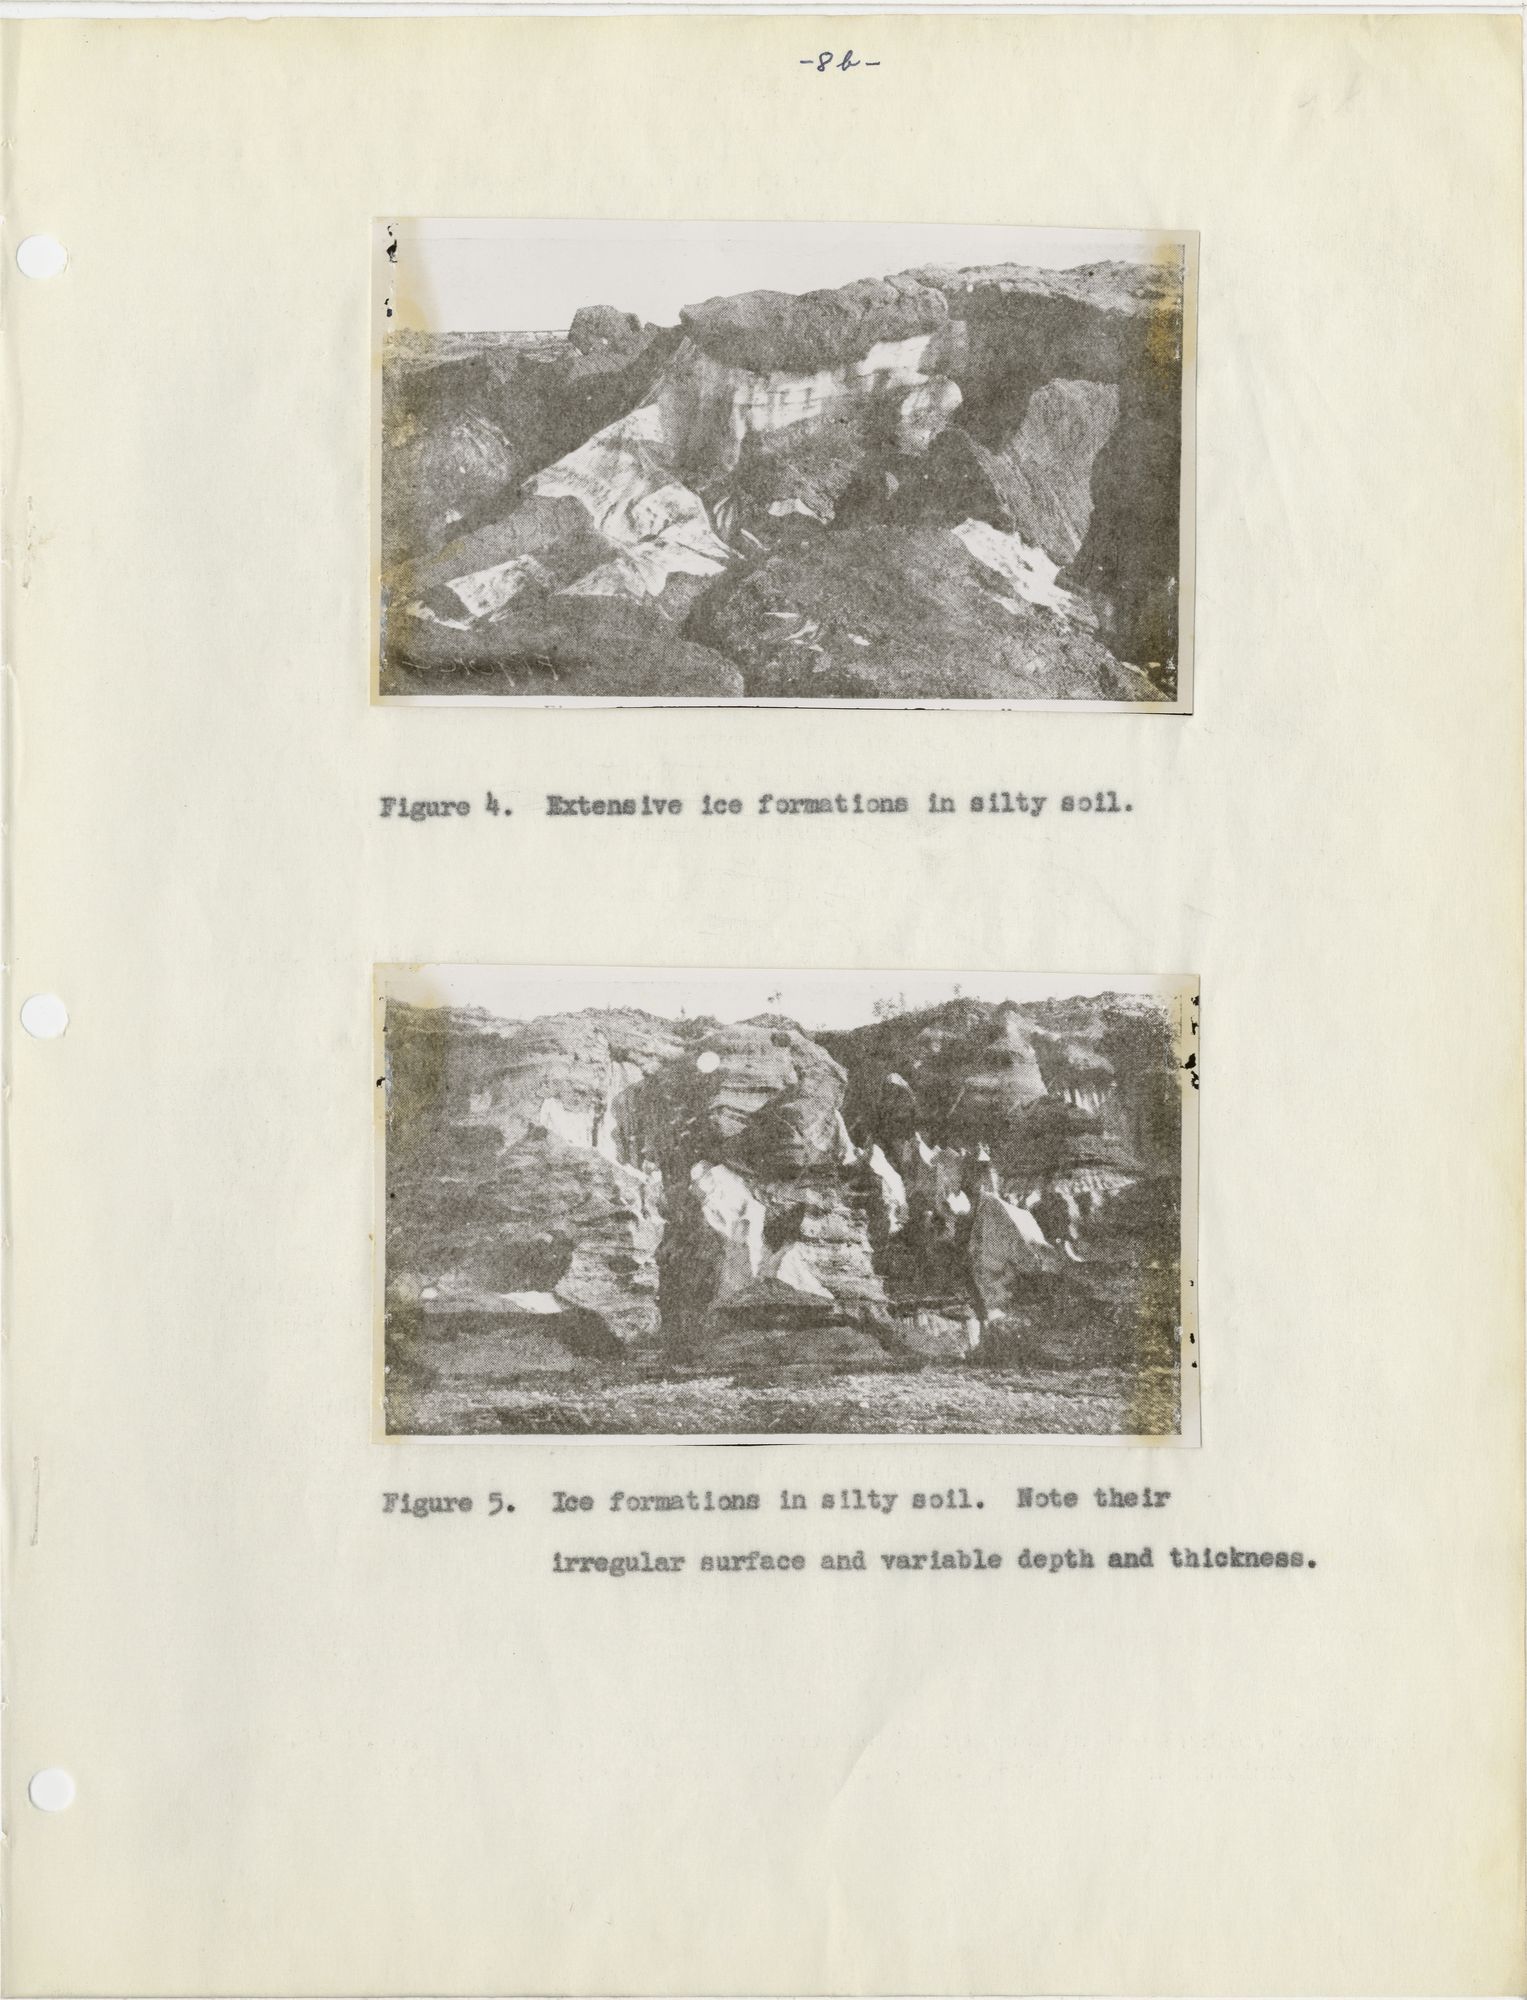
Extensive ice formations in silty soil.
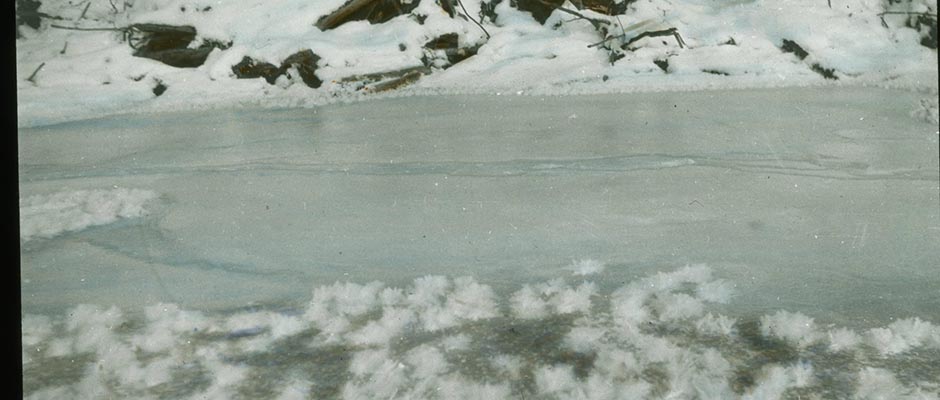
Ice formations in silty soil. Note their irregular surface and variable depth and thickness.
Soil Polygons
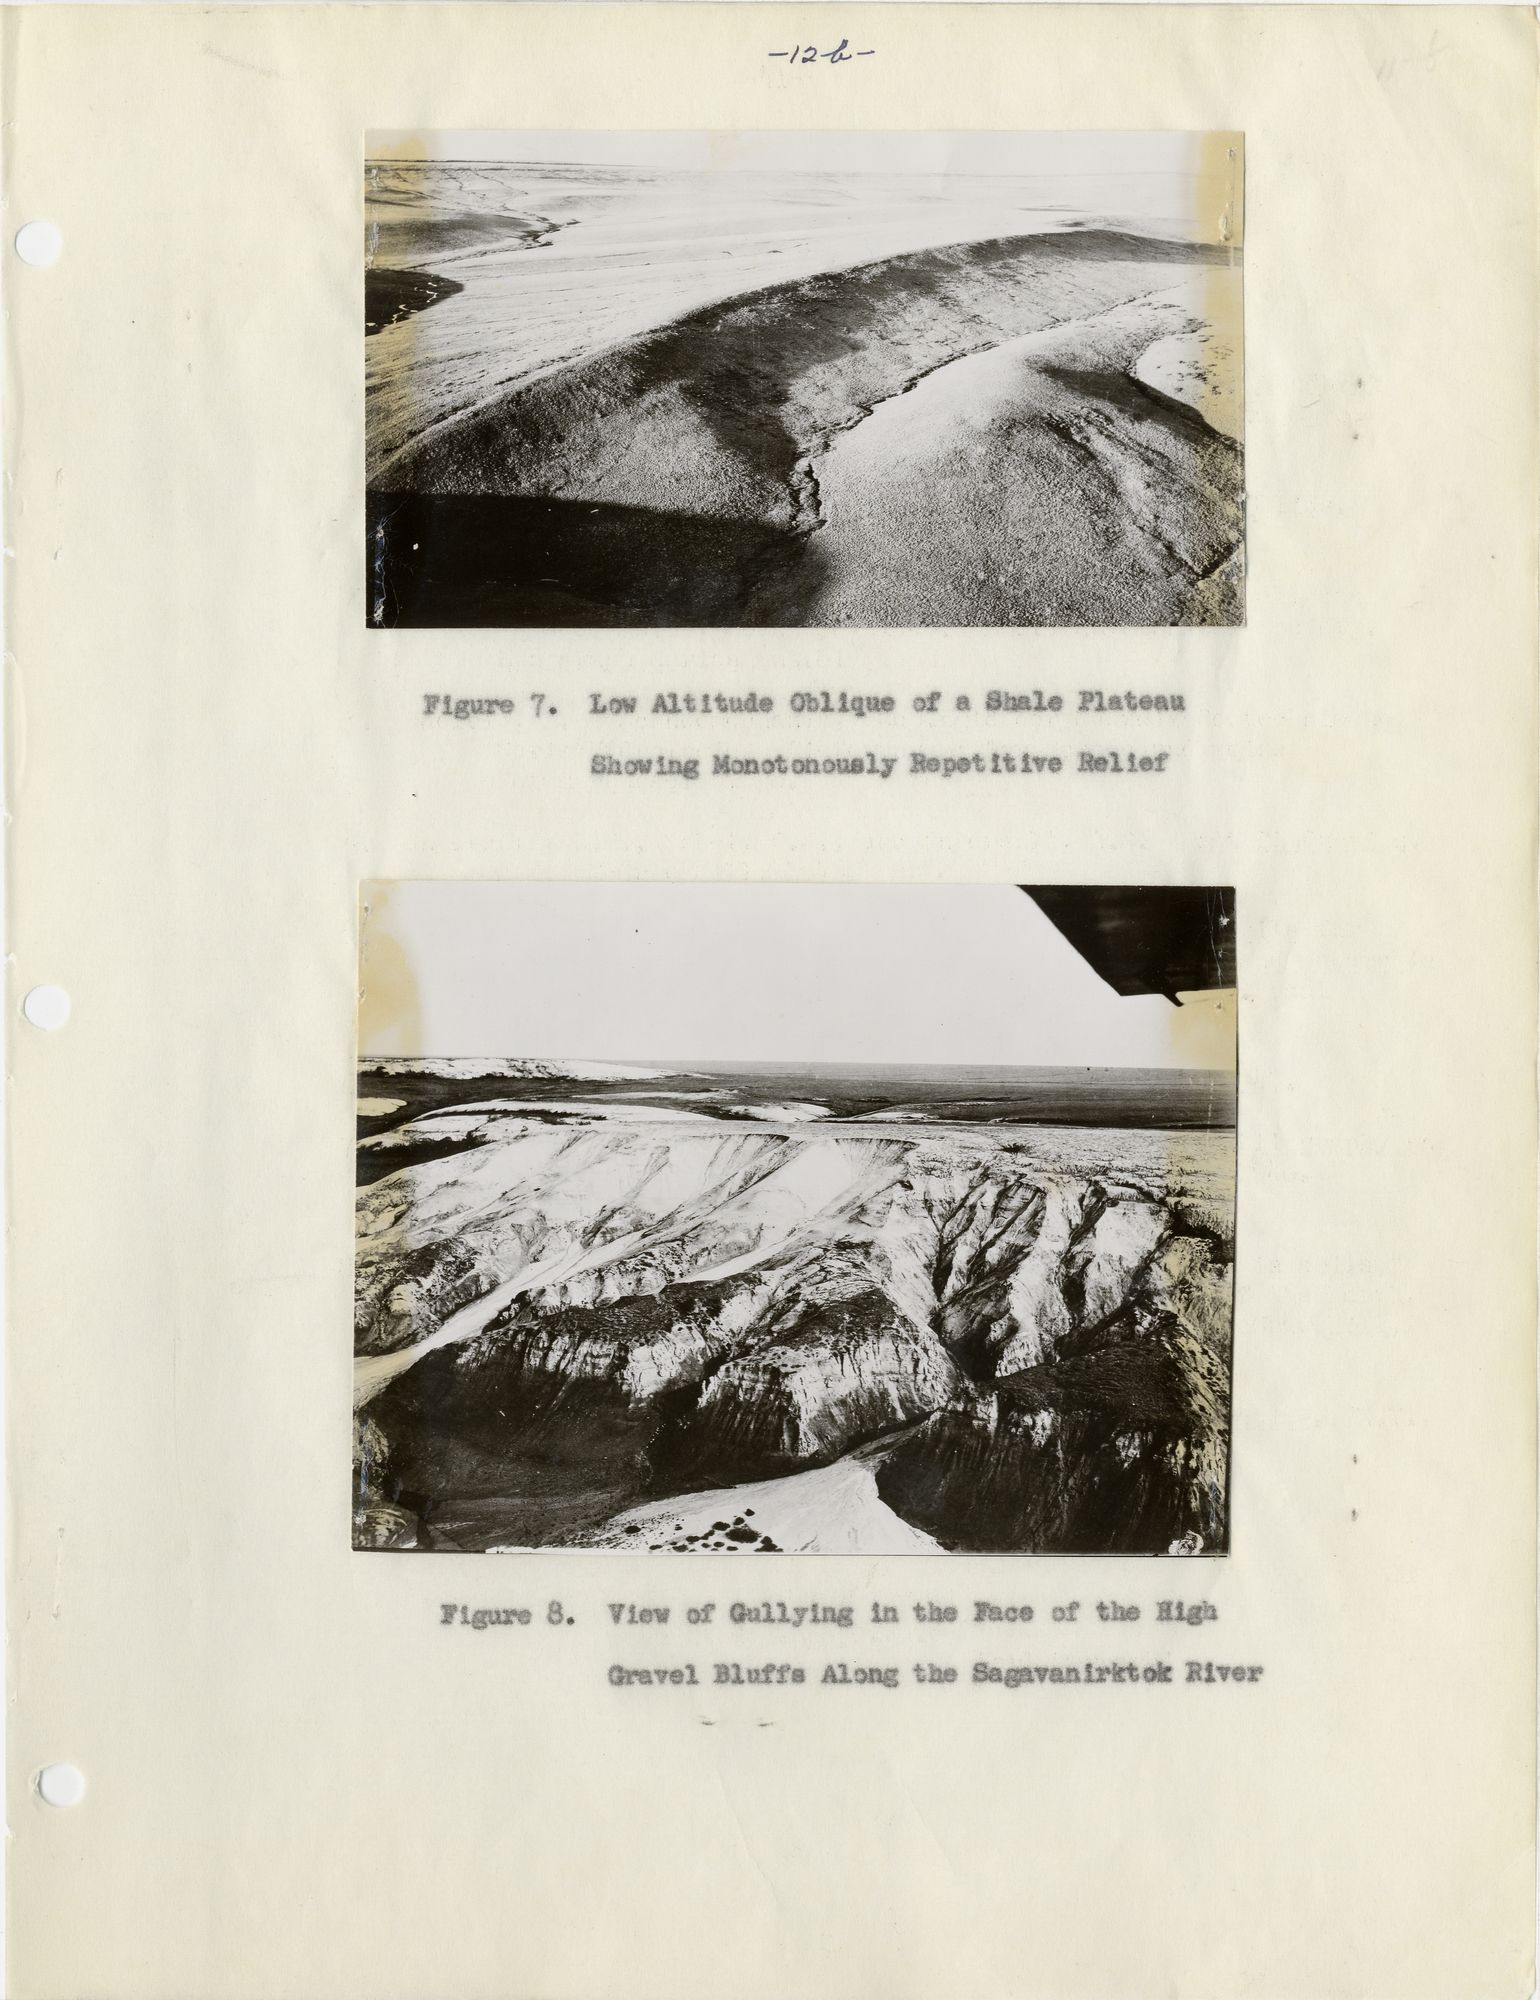
Low Altitude Oblique of a Shale Plateau Showing Monotonously Repetitive Relief
View of Gullying in the Face of the High Gravel Bluffs Along the Sagavanirktok River
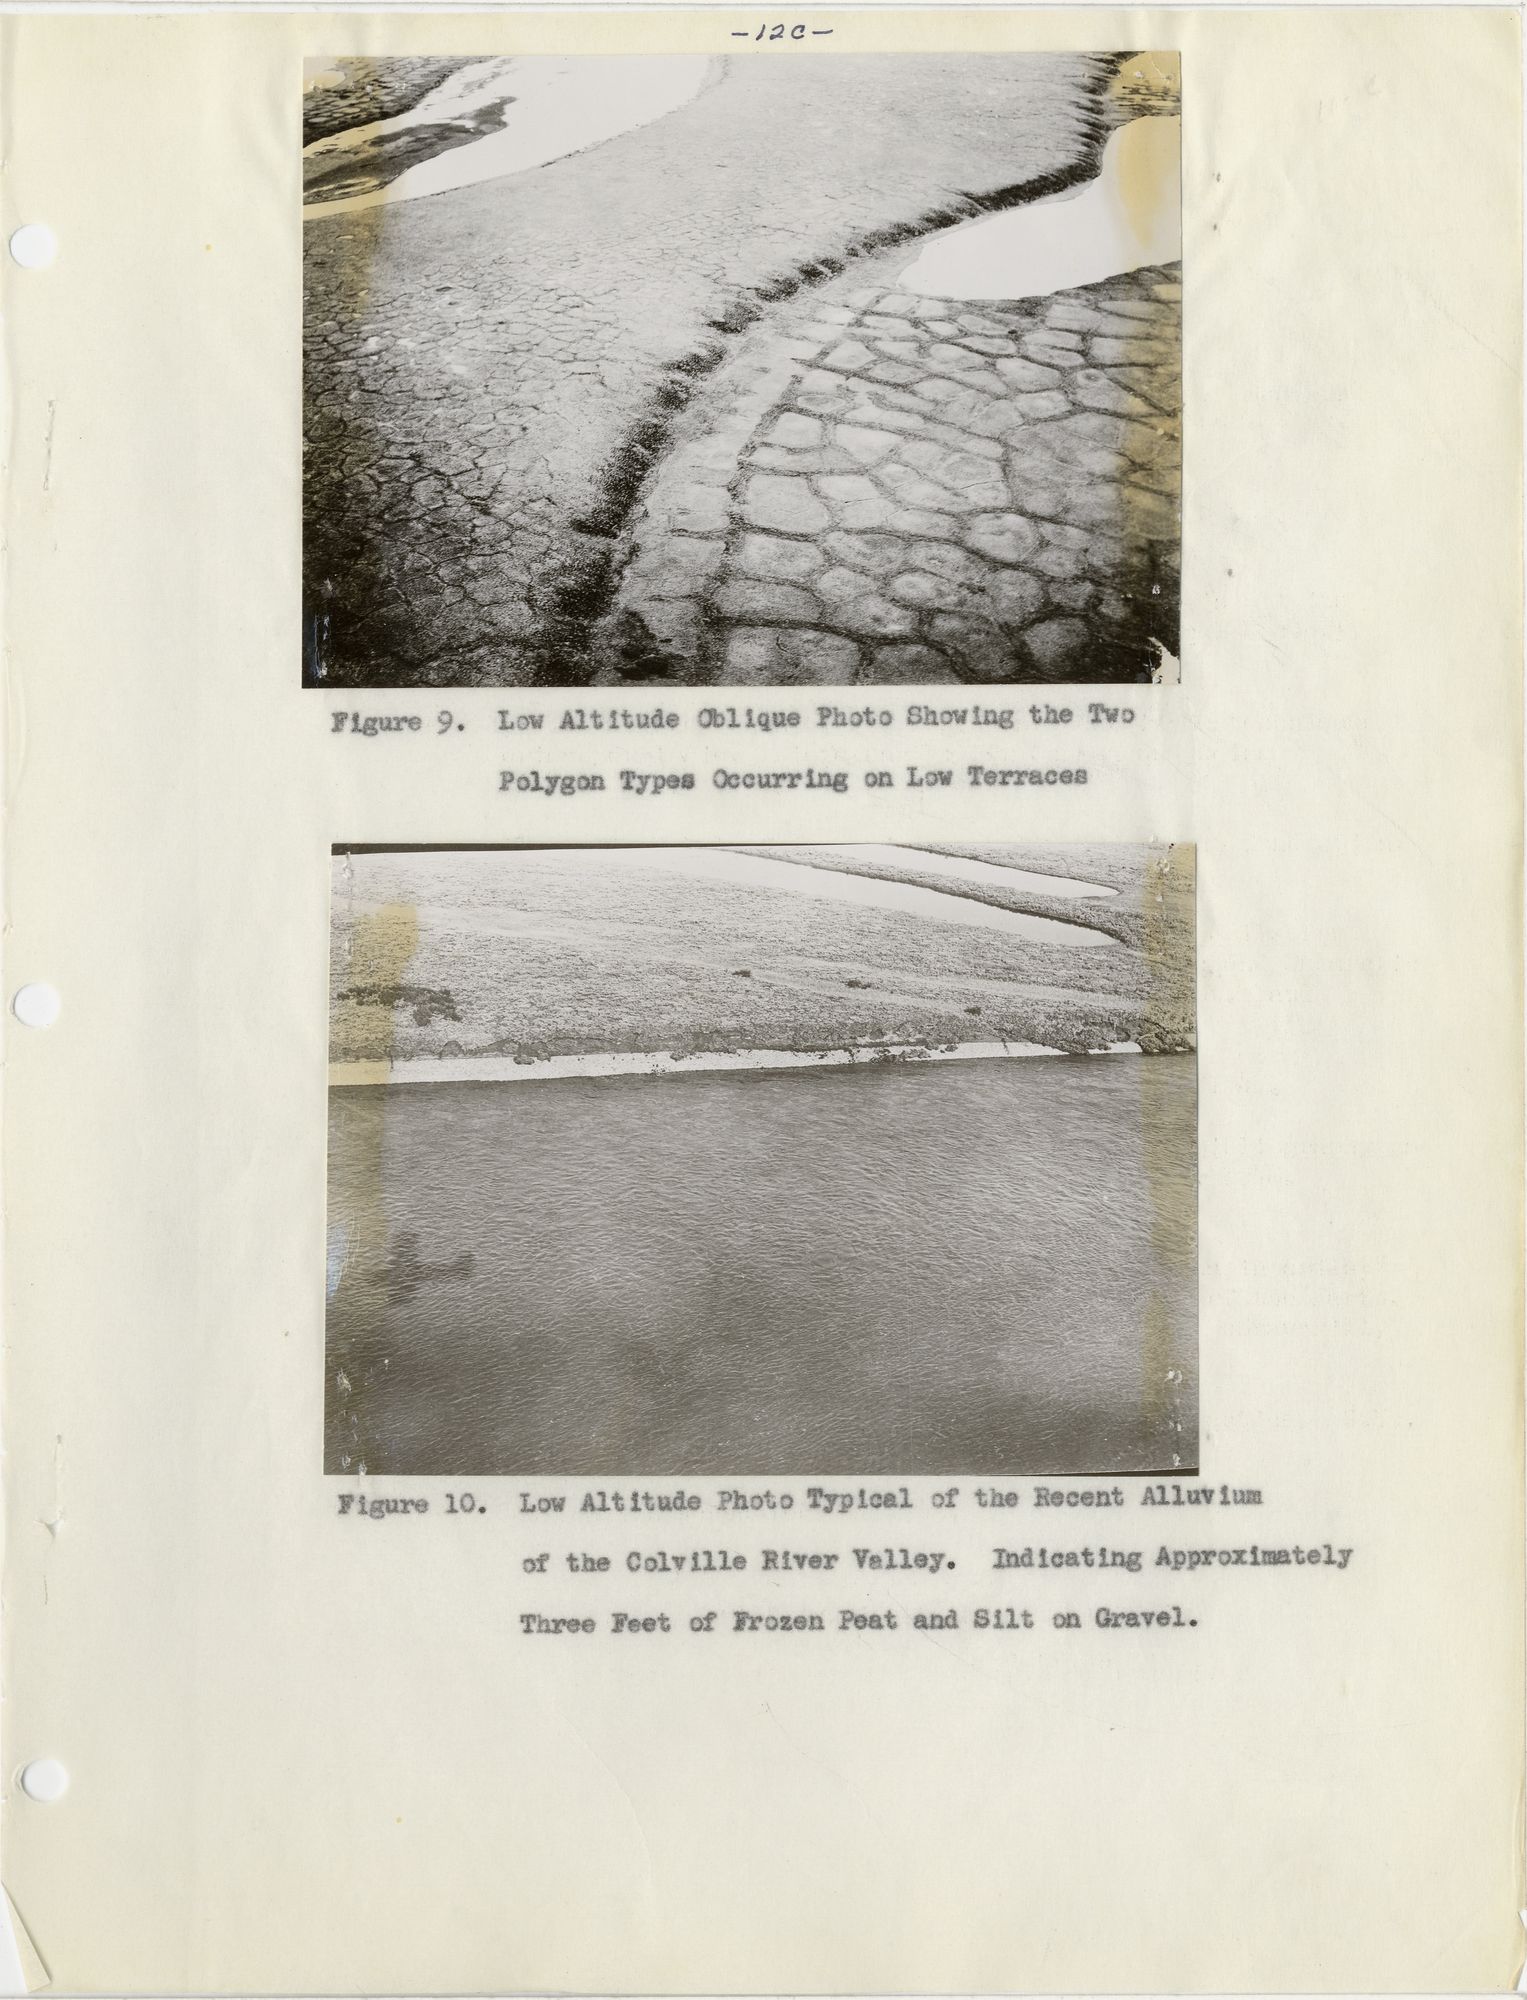
Low Altitude Oblique Photo Showing the Two Polygon Types Occurring on Low Terraces
Low Altitude Photo Typical of the Recent Alluvium of the Colville River Valley. Indicating Approximately Three Feet of Frozen Peat and Silt on Gravel.
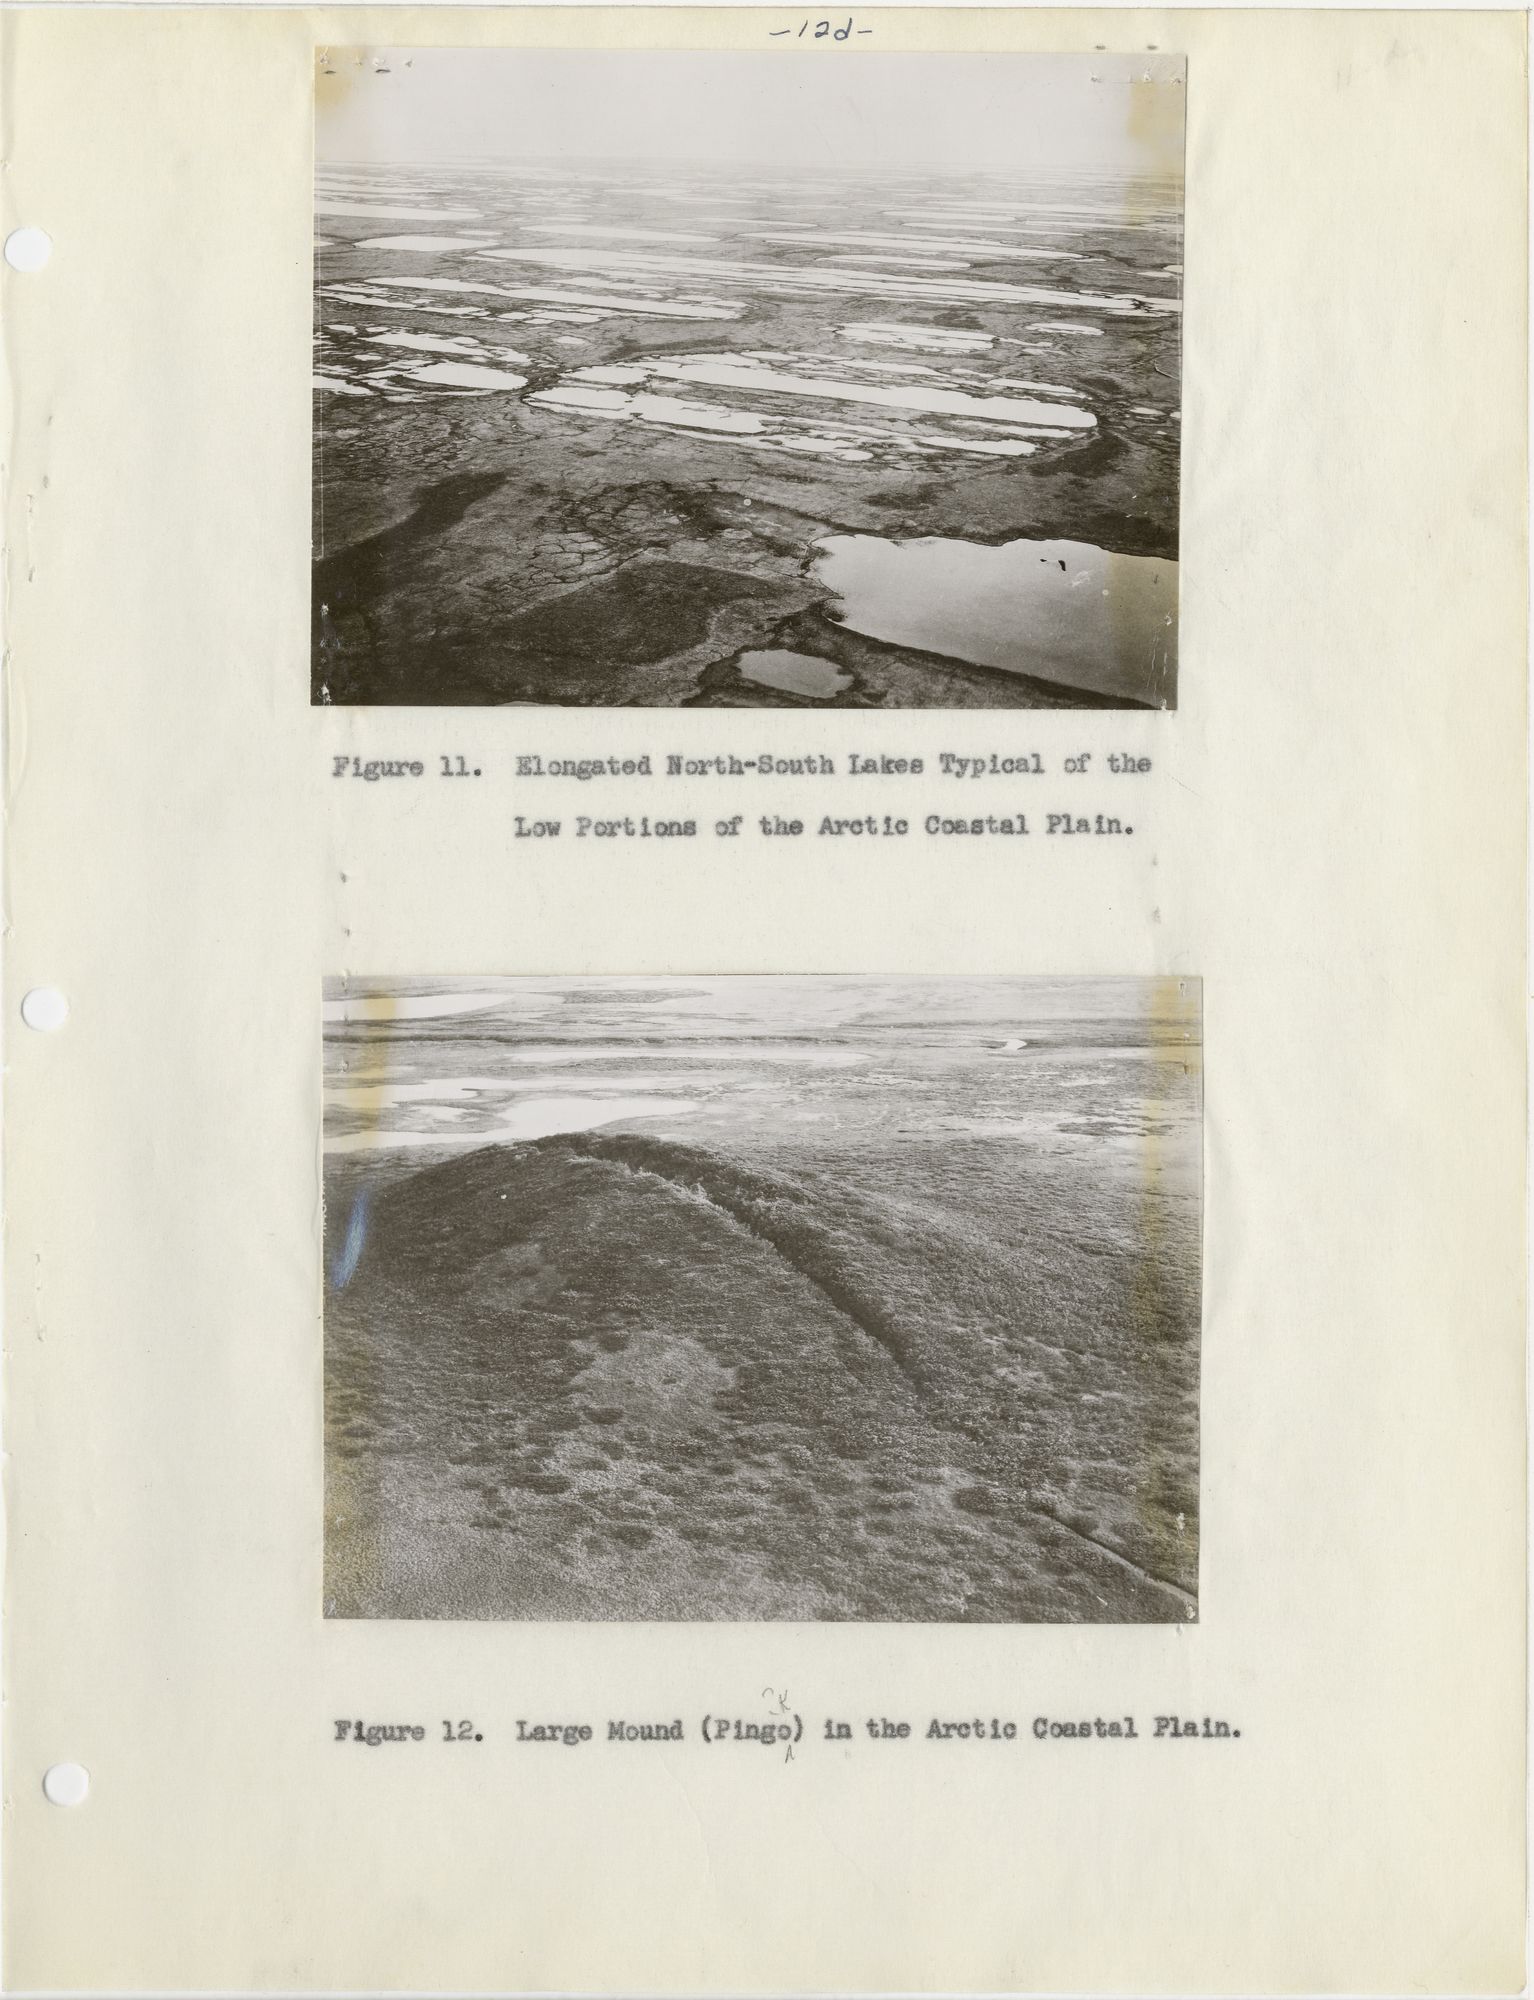
Elongated North-South Lakes Typical of the Low Portions of the Arctic Coastal Plain.
Large Mound (Pingok) in the Arctic Coastal Plain.
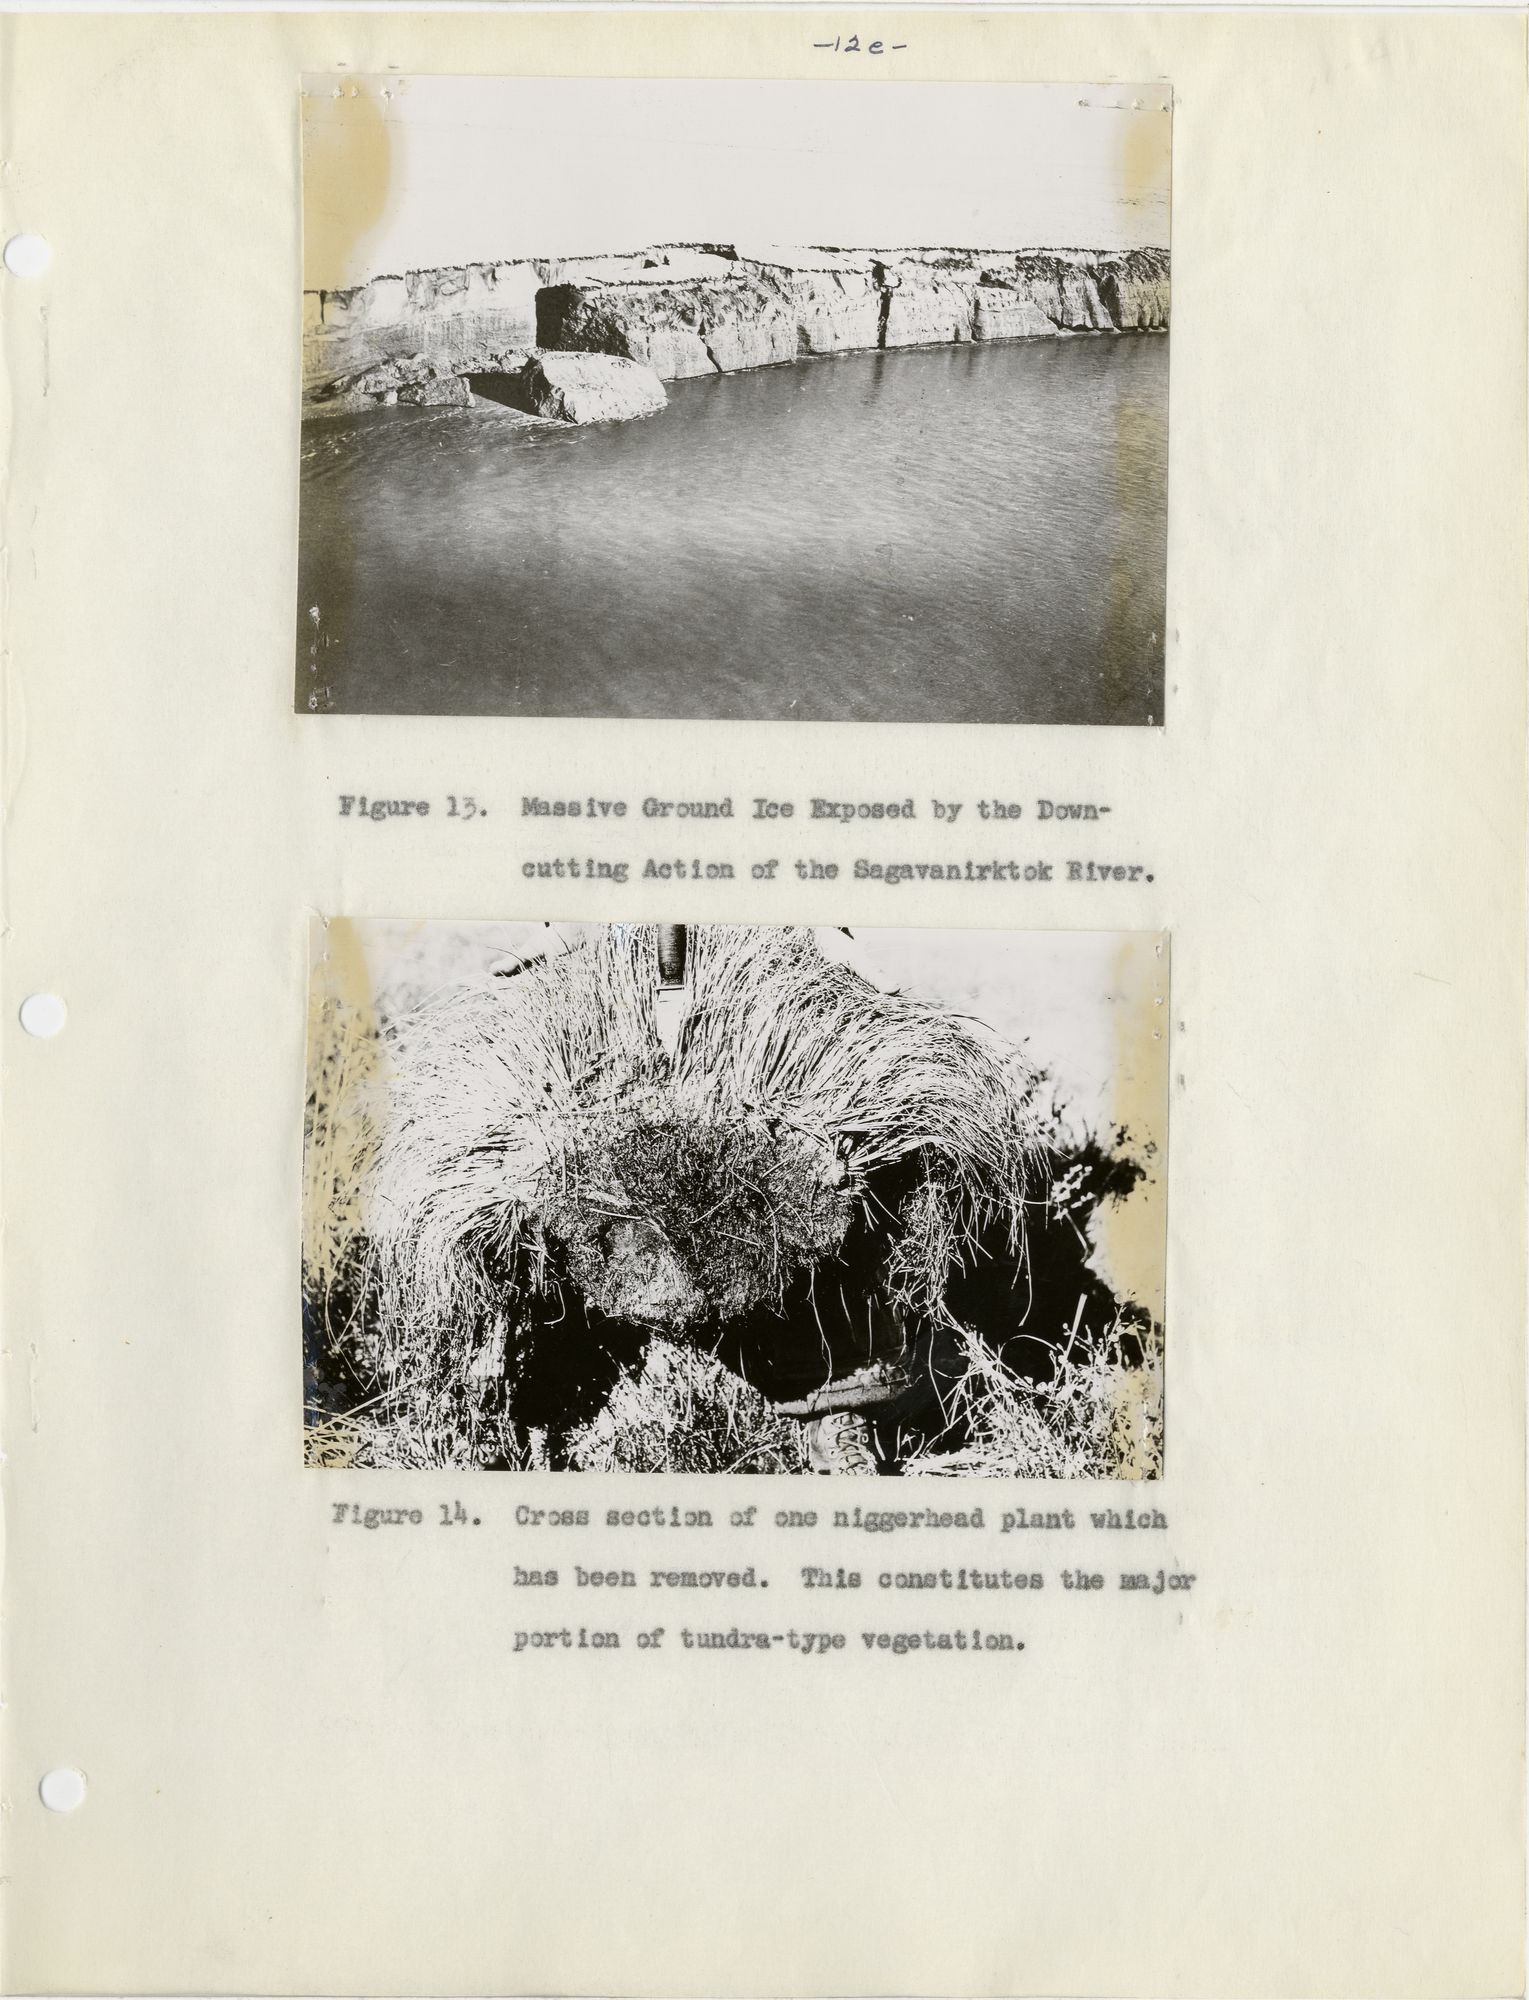
Massive Ground Ice Exposed by the Down Cutting Action of the Sagavanirktok River.
Cross section of one niggerhead plant which has been removed. This constitutes the major portion of tundra-type vegetation.
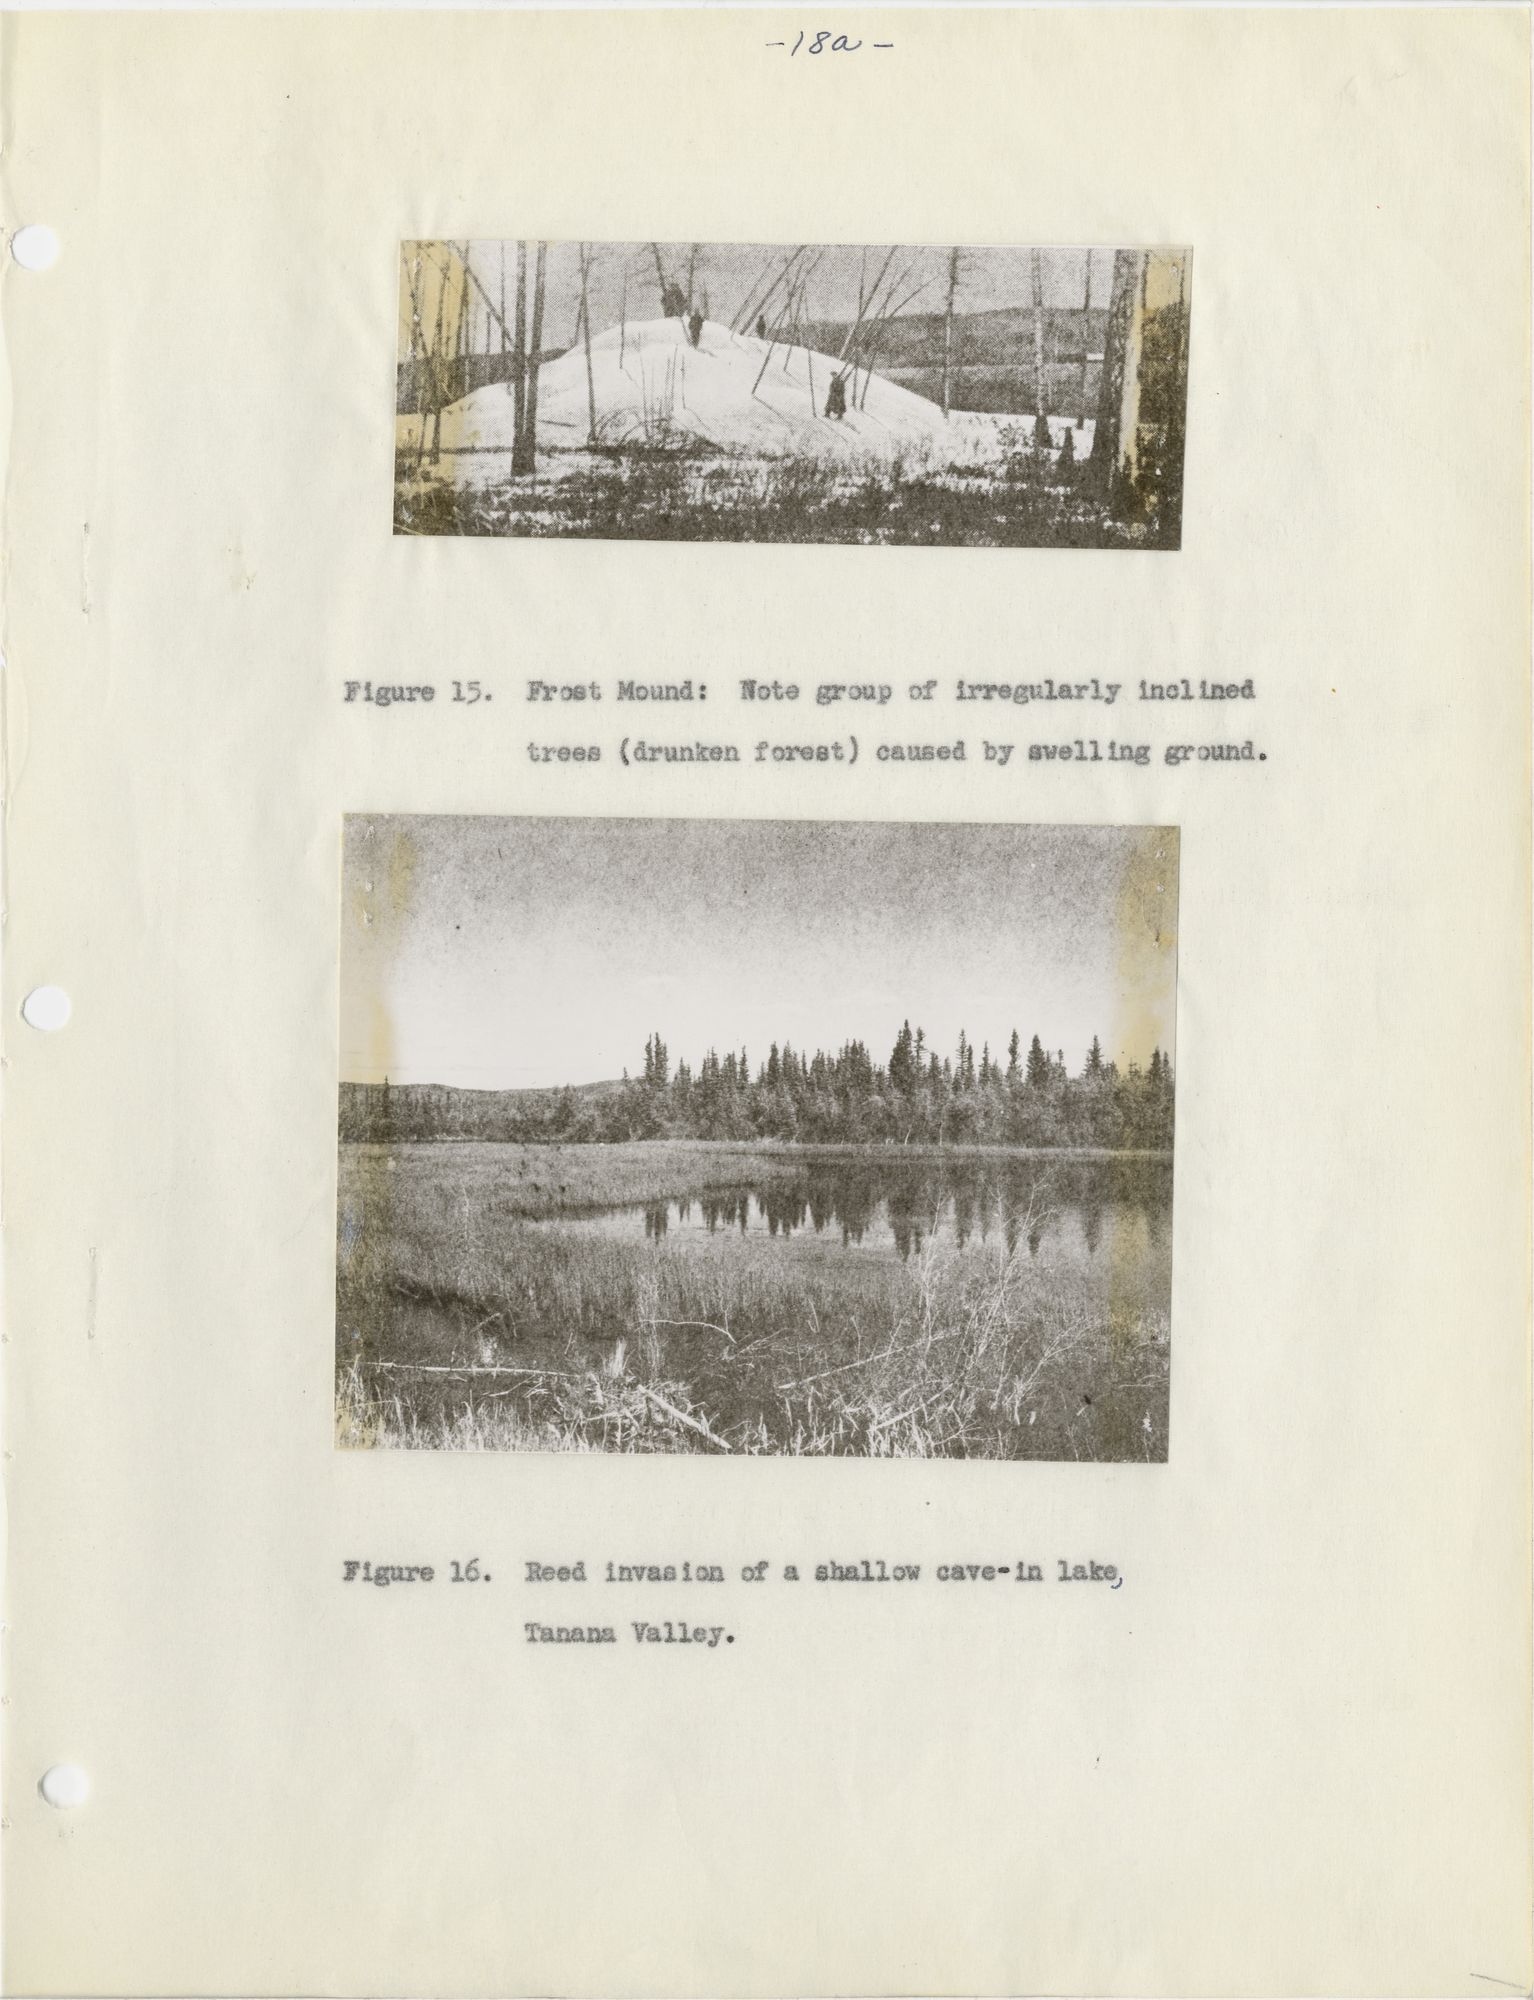
Frost Mound: Note group of irregularly inclined trees (drunken forest) caused by swelling ground.
Reed invasion of a shallow cave-in lake, Tanana Valley.
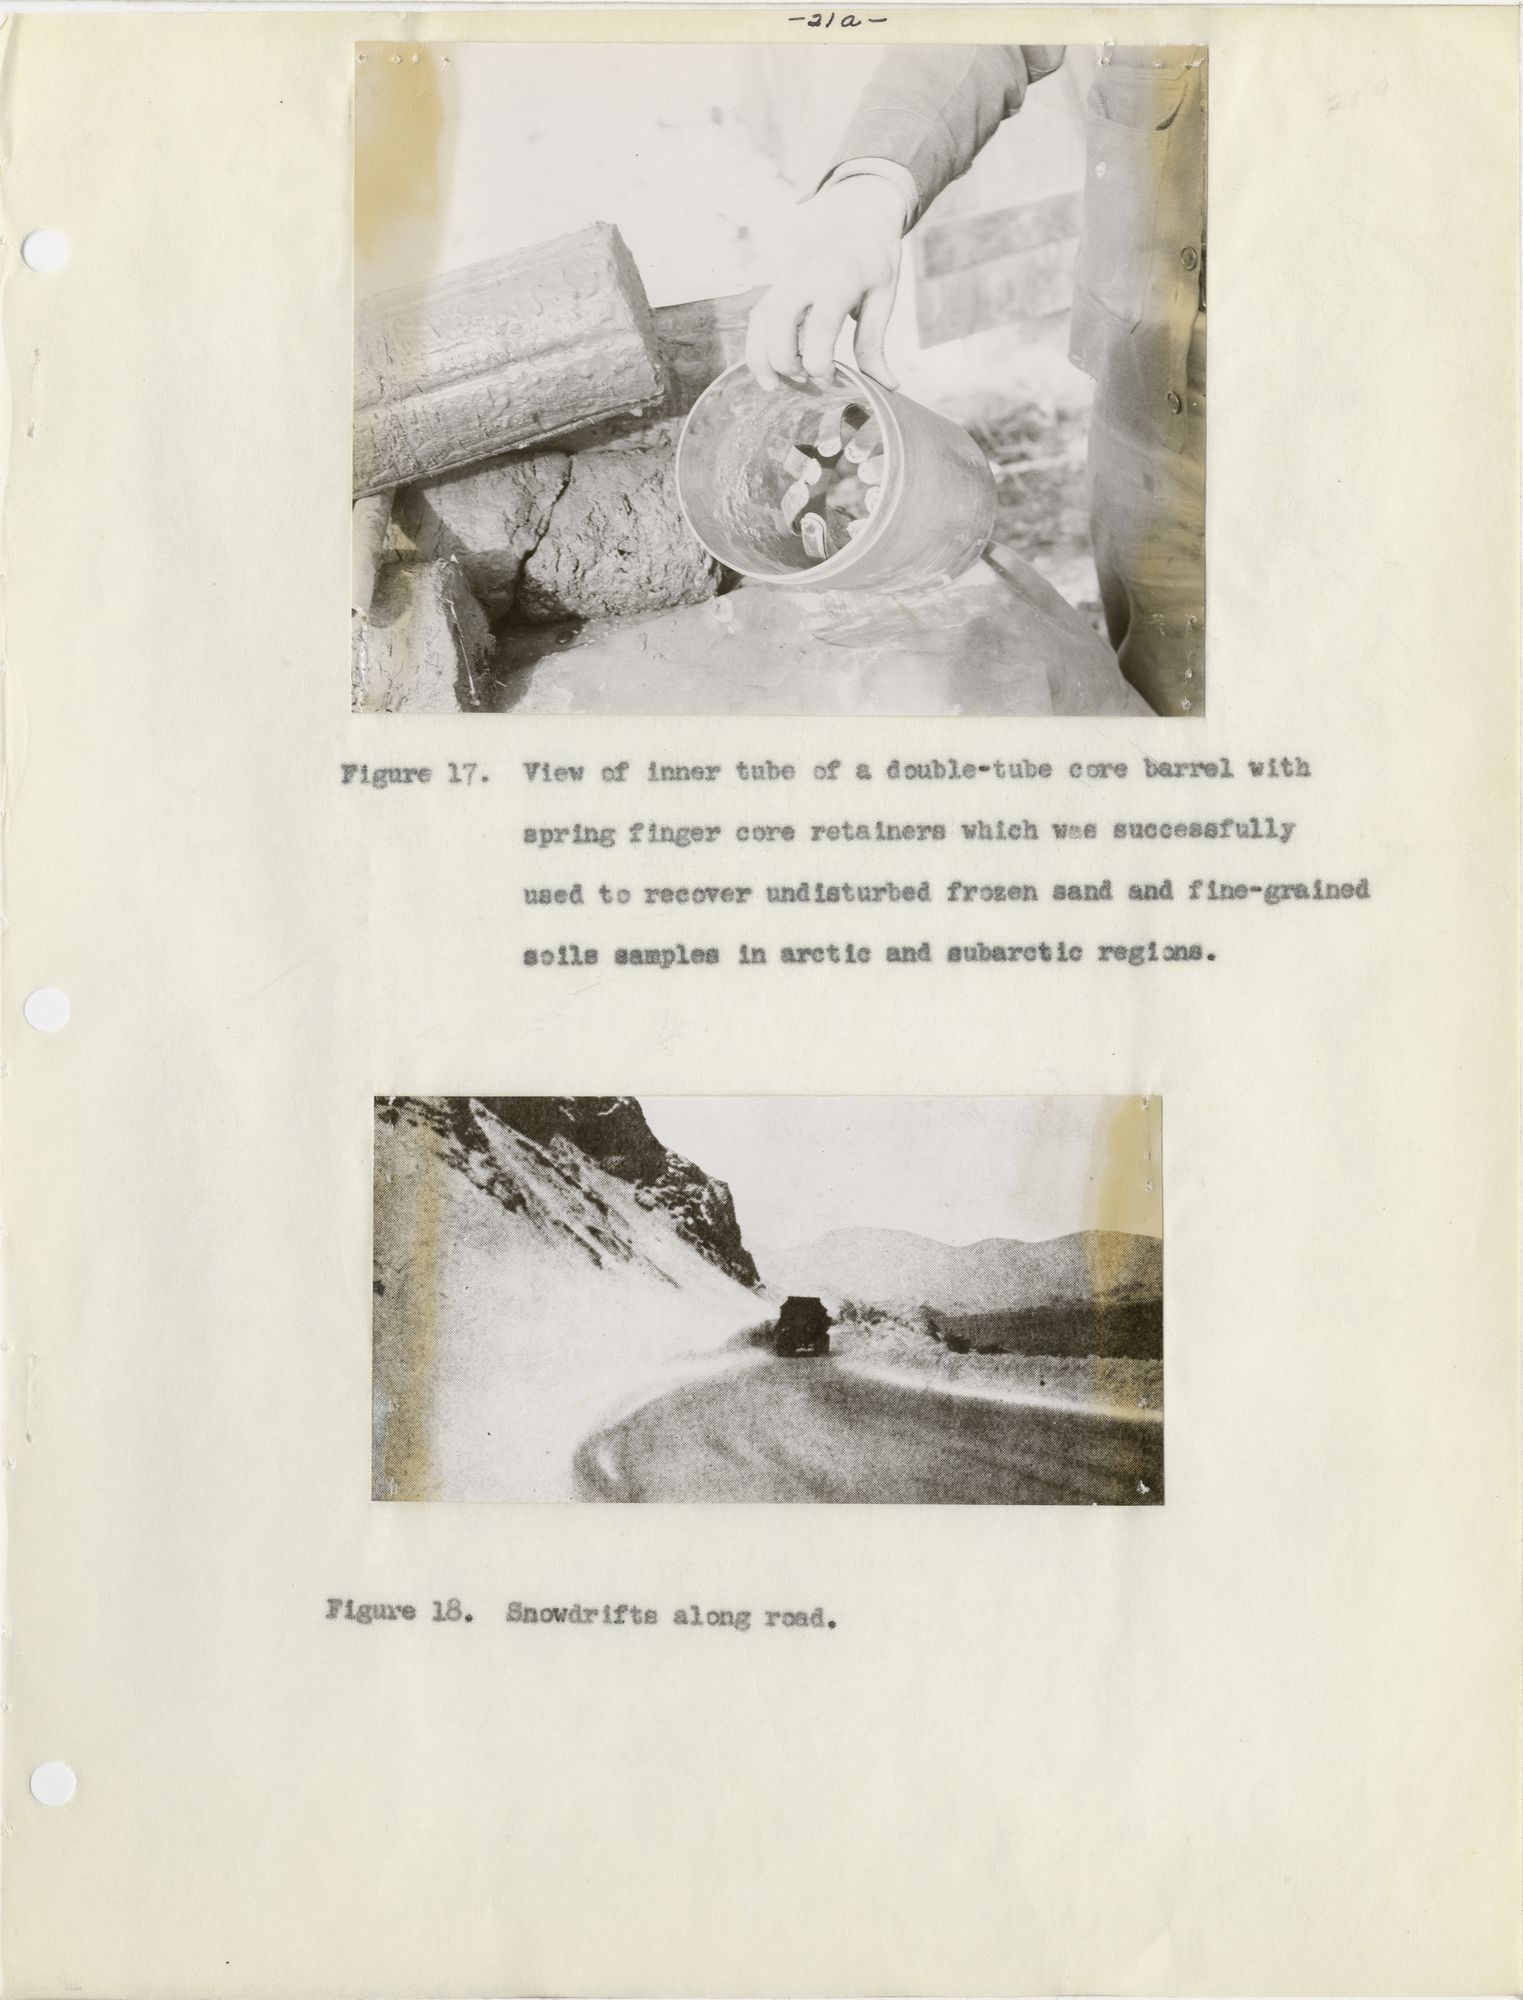
View of inner tube of a double-tube core barrel with spring finger core retainers which was successfully used to recover undisturbed frozen sand and fine-grained soils samples in arctic and subarctic regions.
Snowdrifts along road.
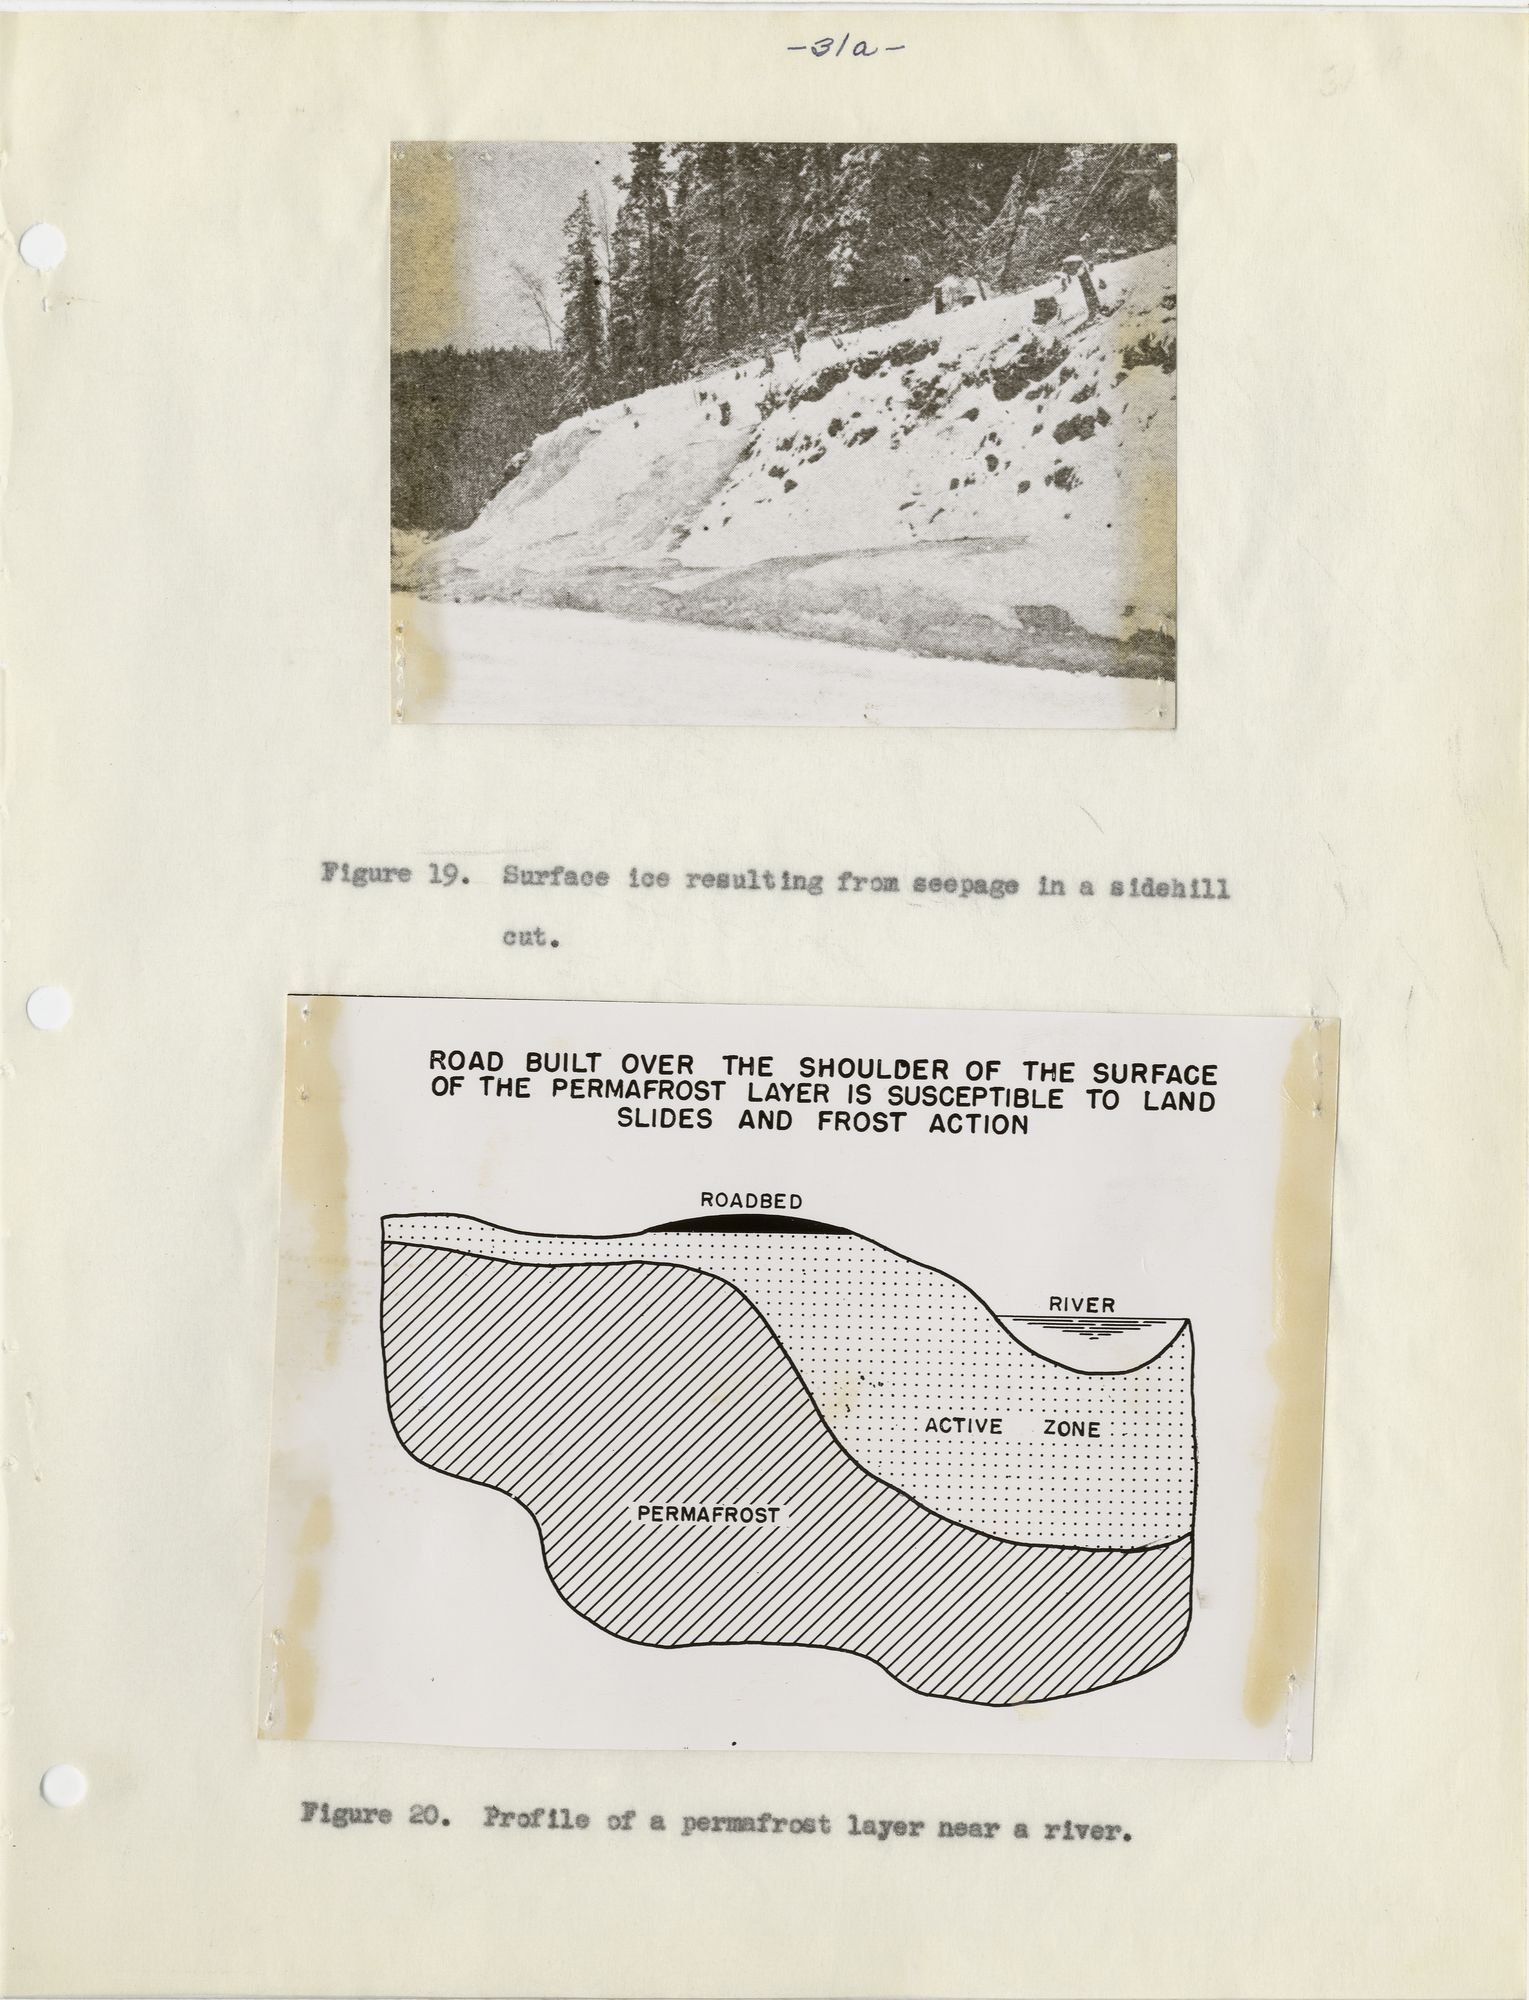
Surface ice resulting from seepage in a sidehill cut.
Profile of a permafrost layer near a river.
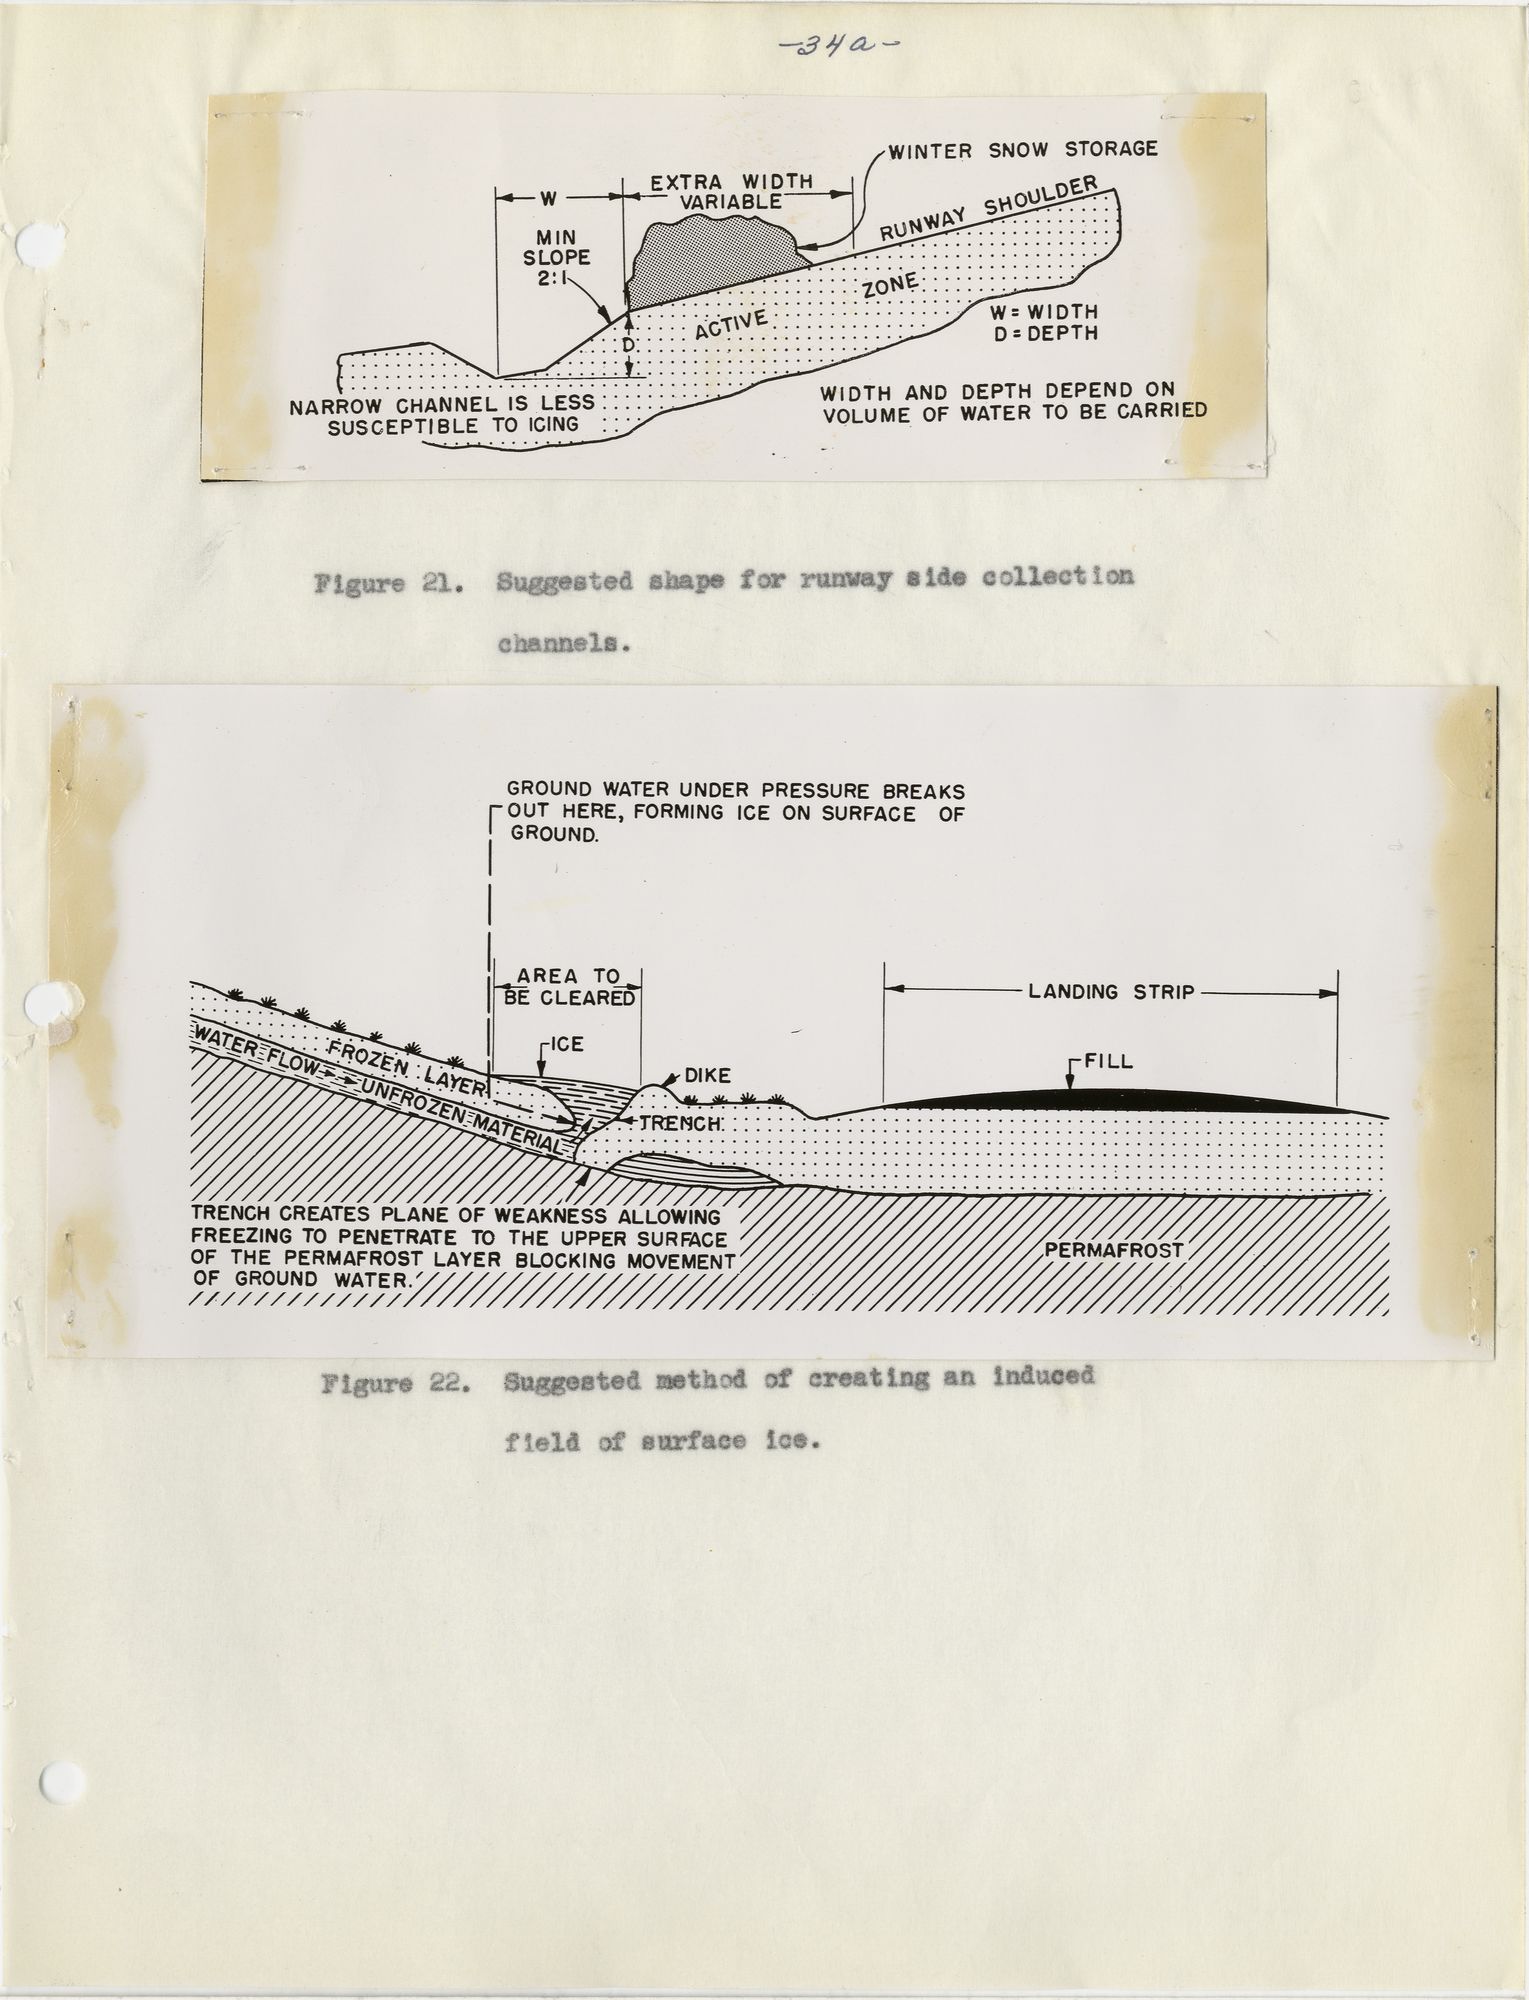
Suggested shape for runway side collection channels.
Suggested method of creating an induced field of surface ice.
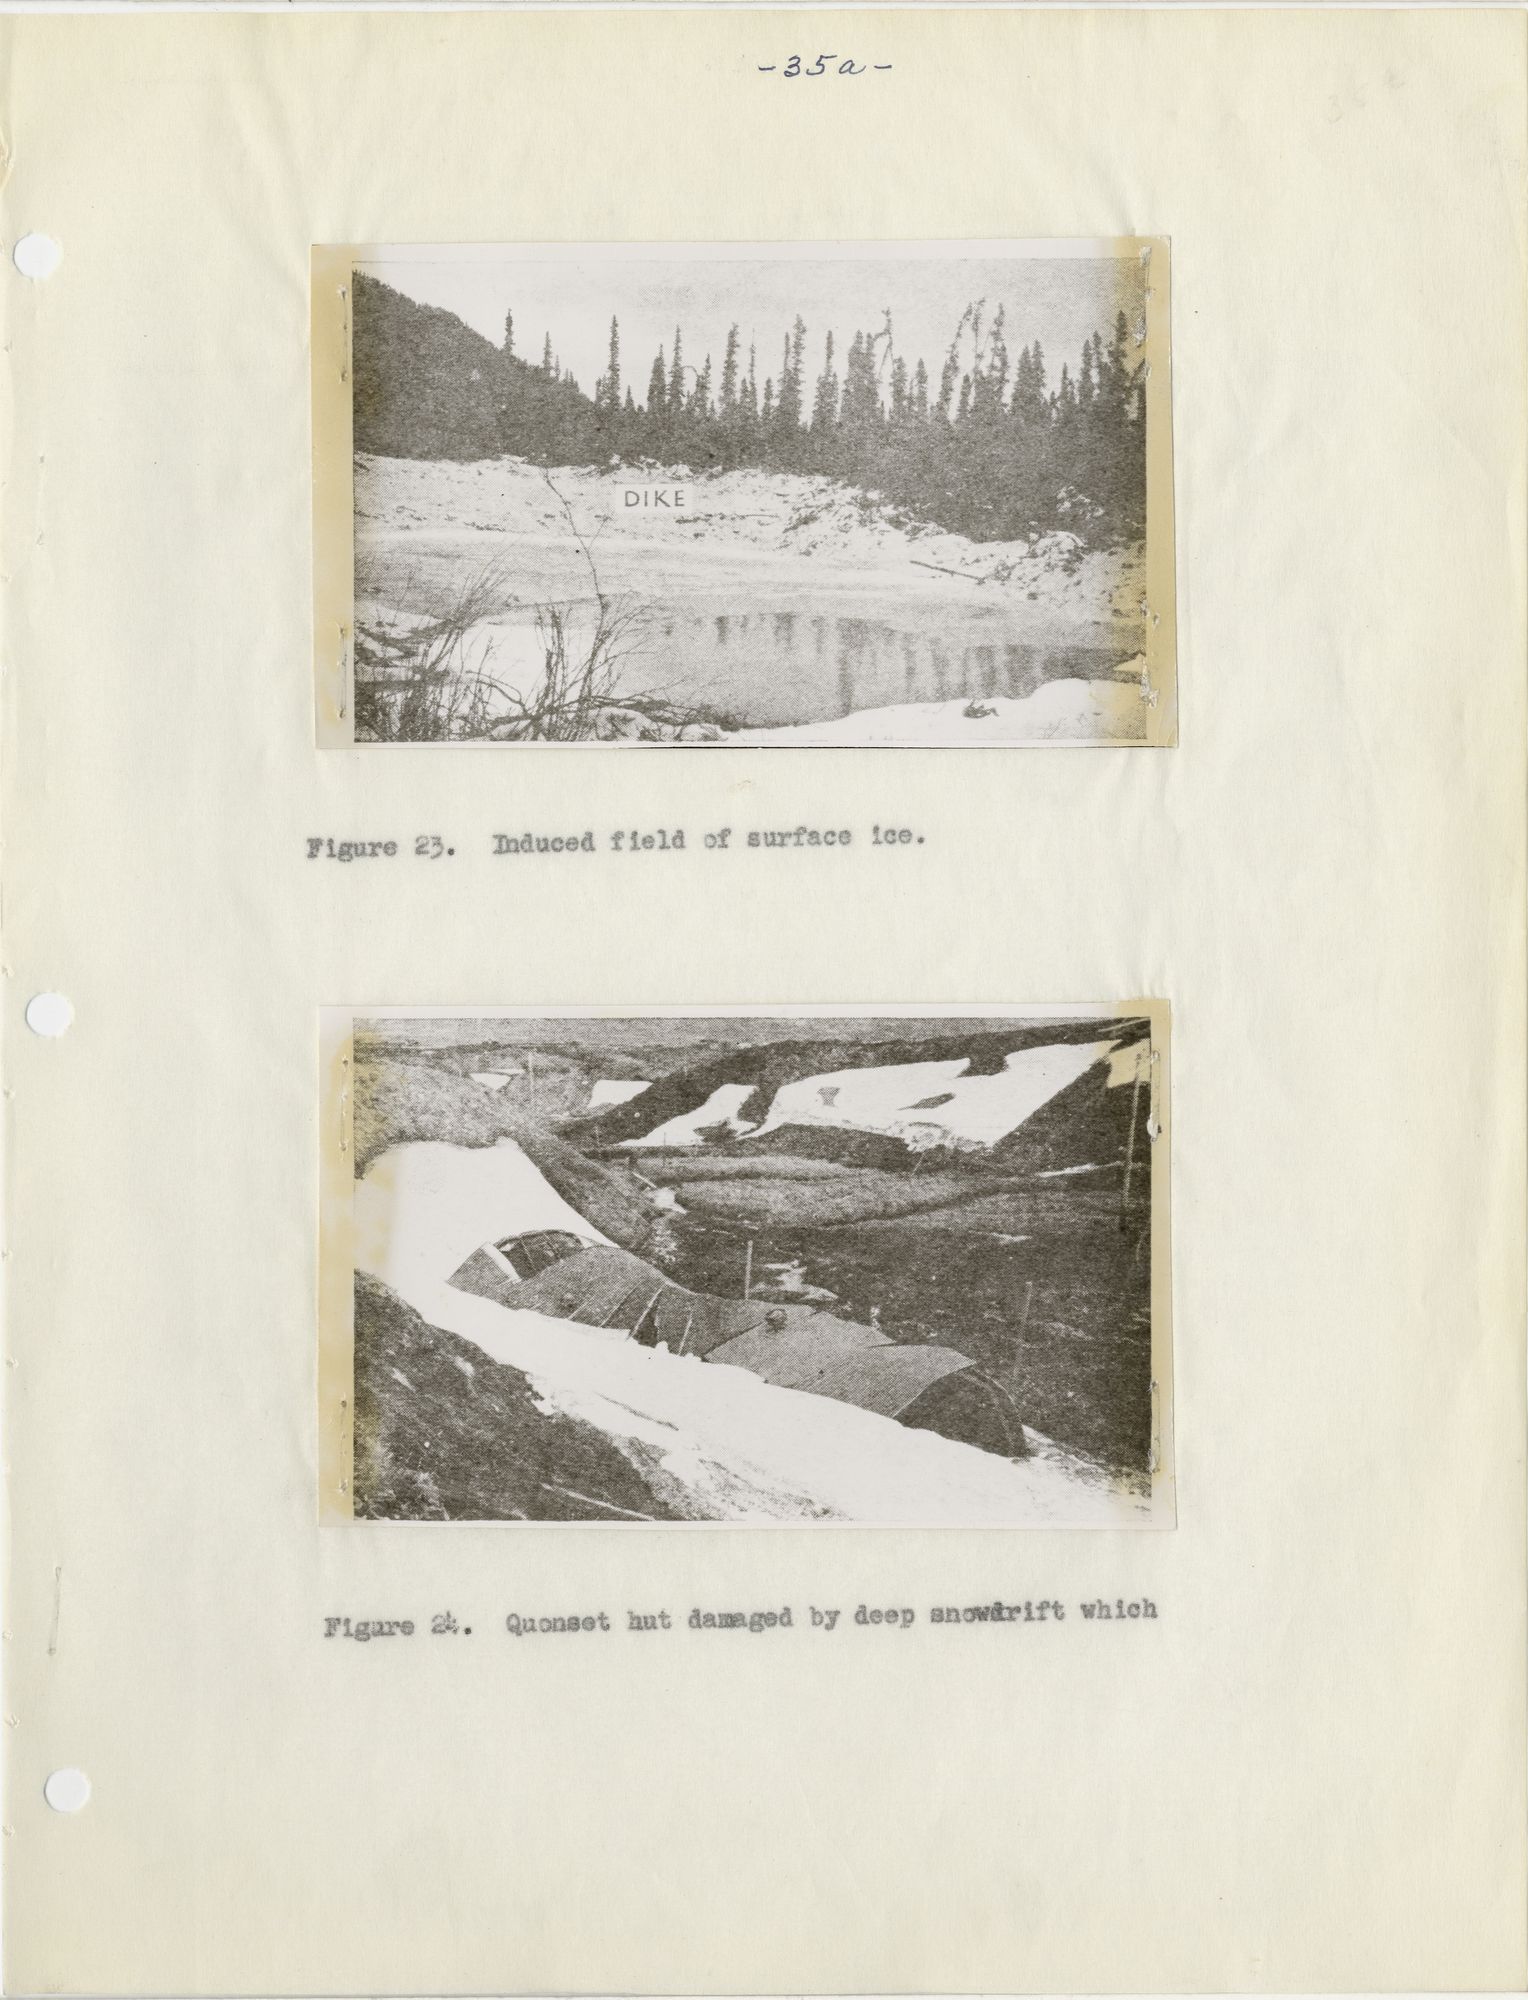
Induced field of surface ice.
Quonset hut damaged by deep snowdrift which
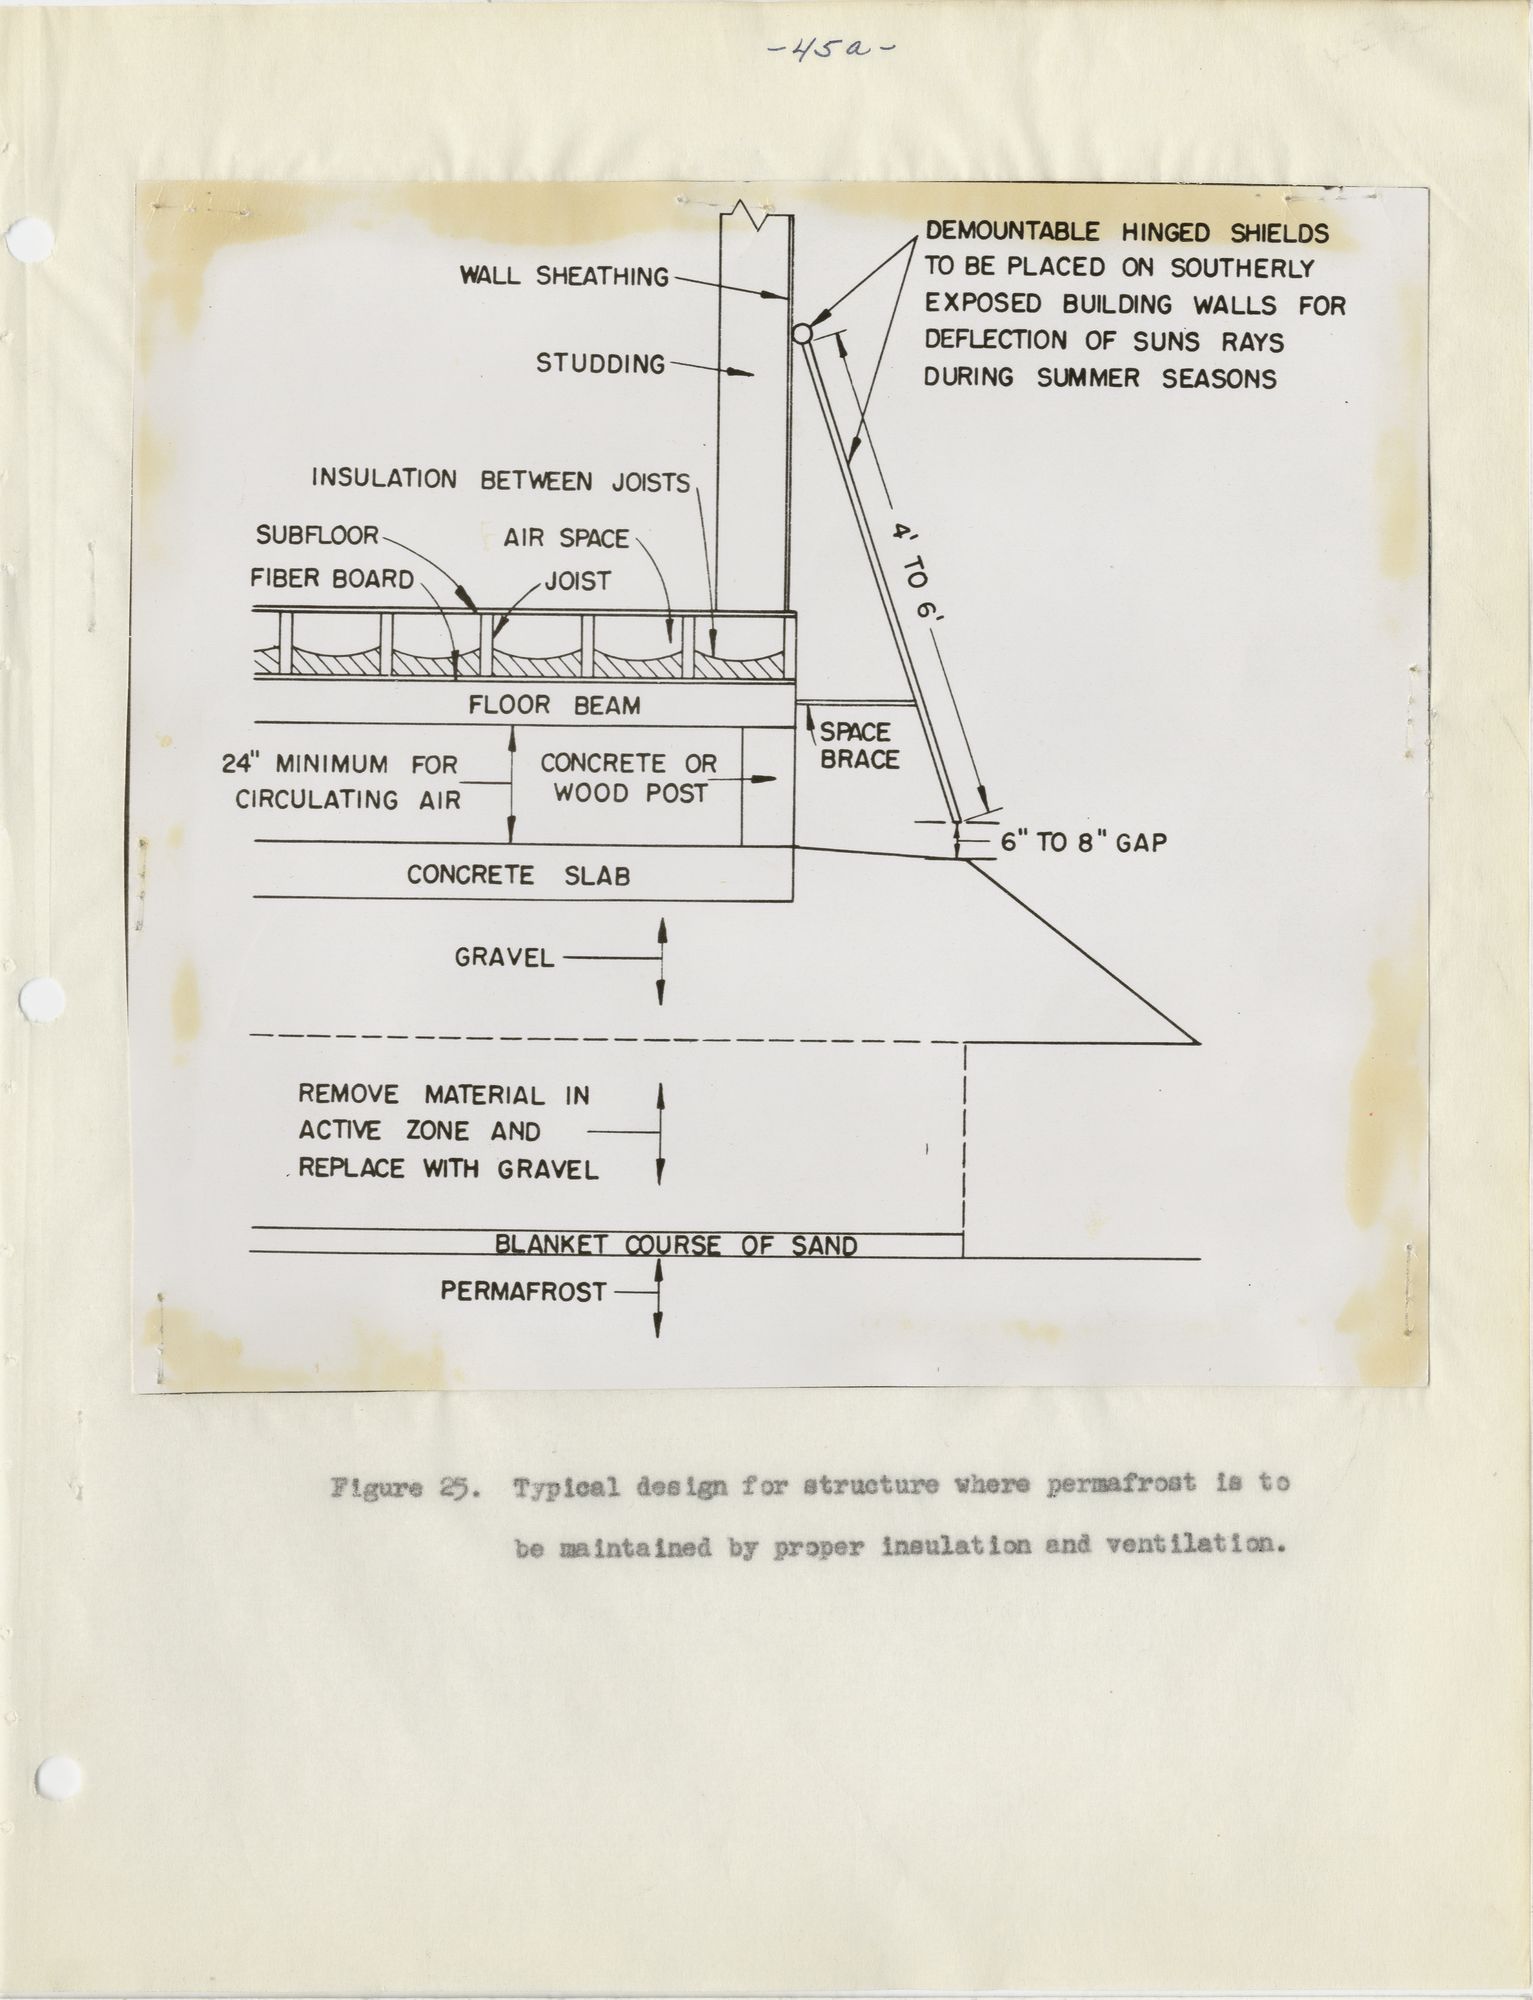
Typical design for structure where permafrost is to be maintained by proper insulation and ventilation.
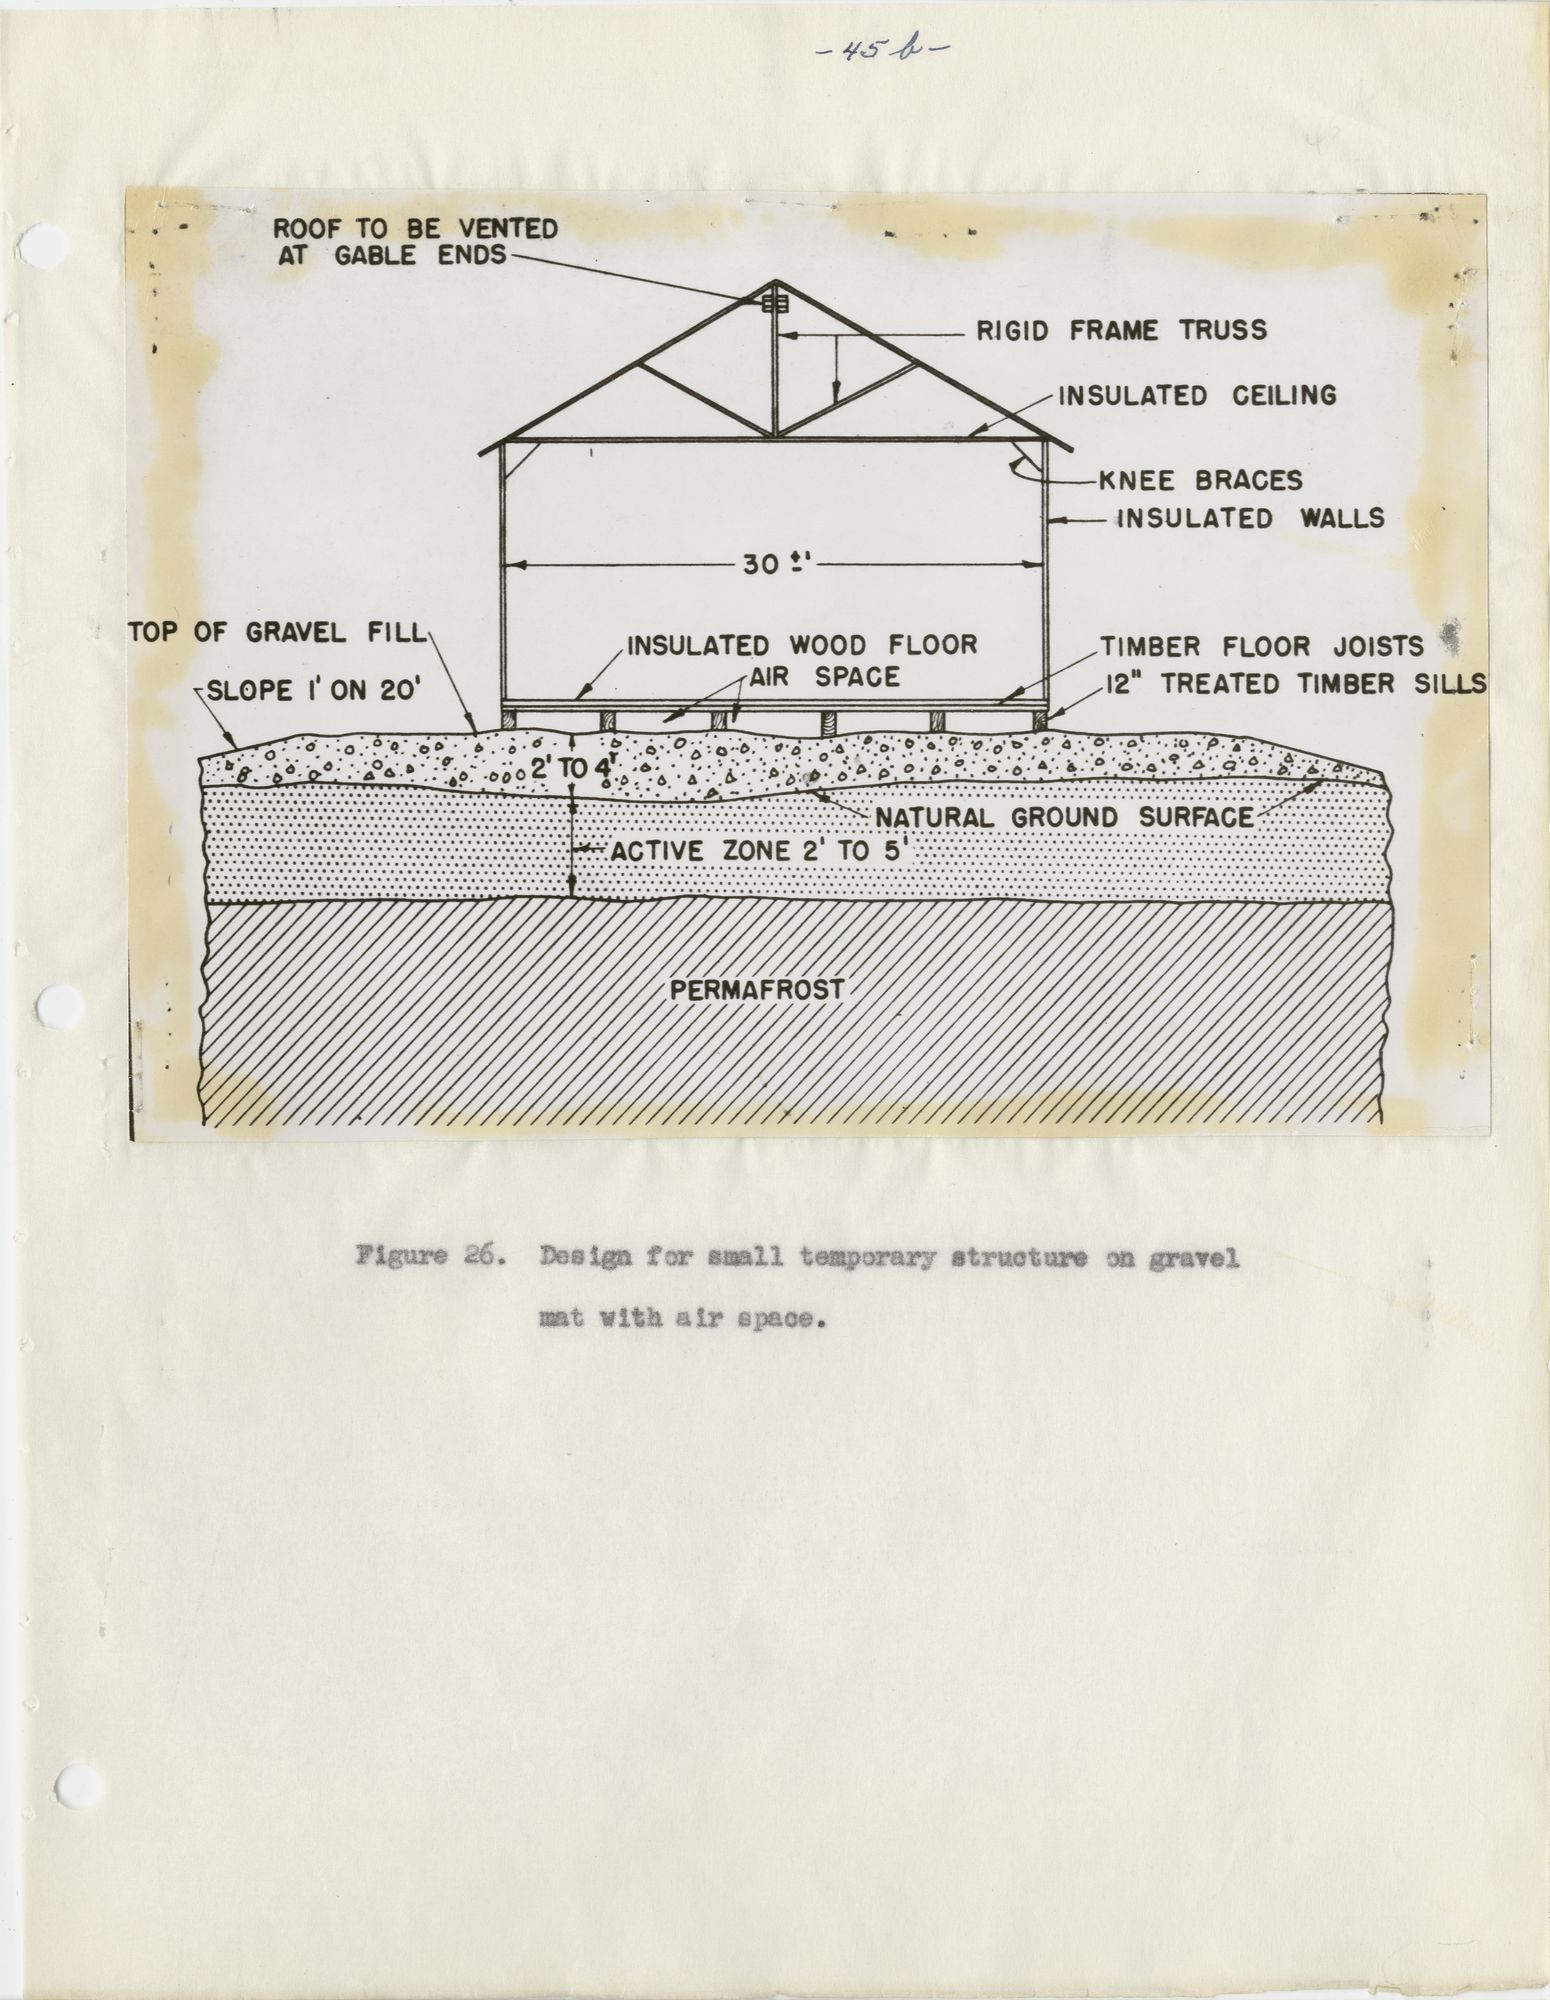
Design for small temporary structure on gravel mat with air space.
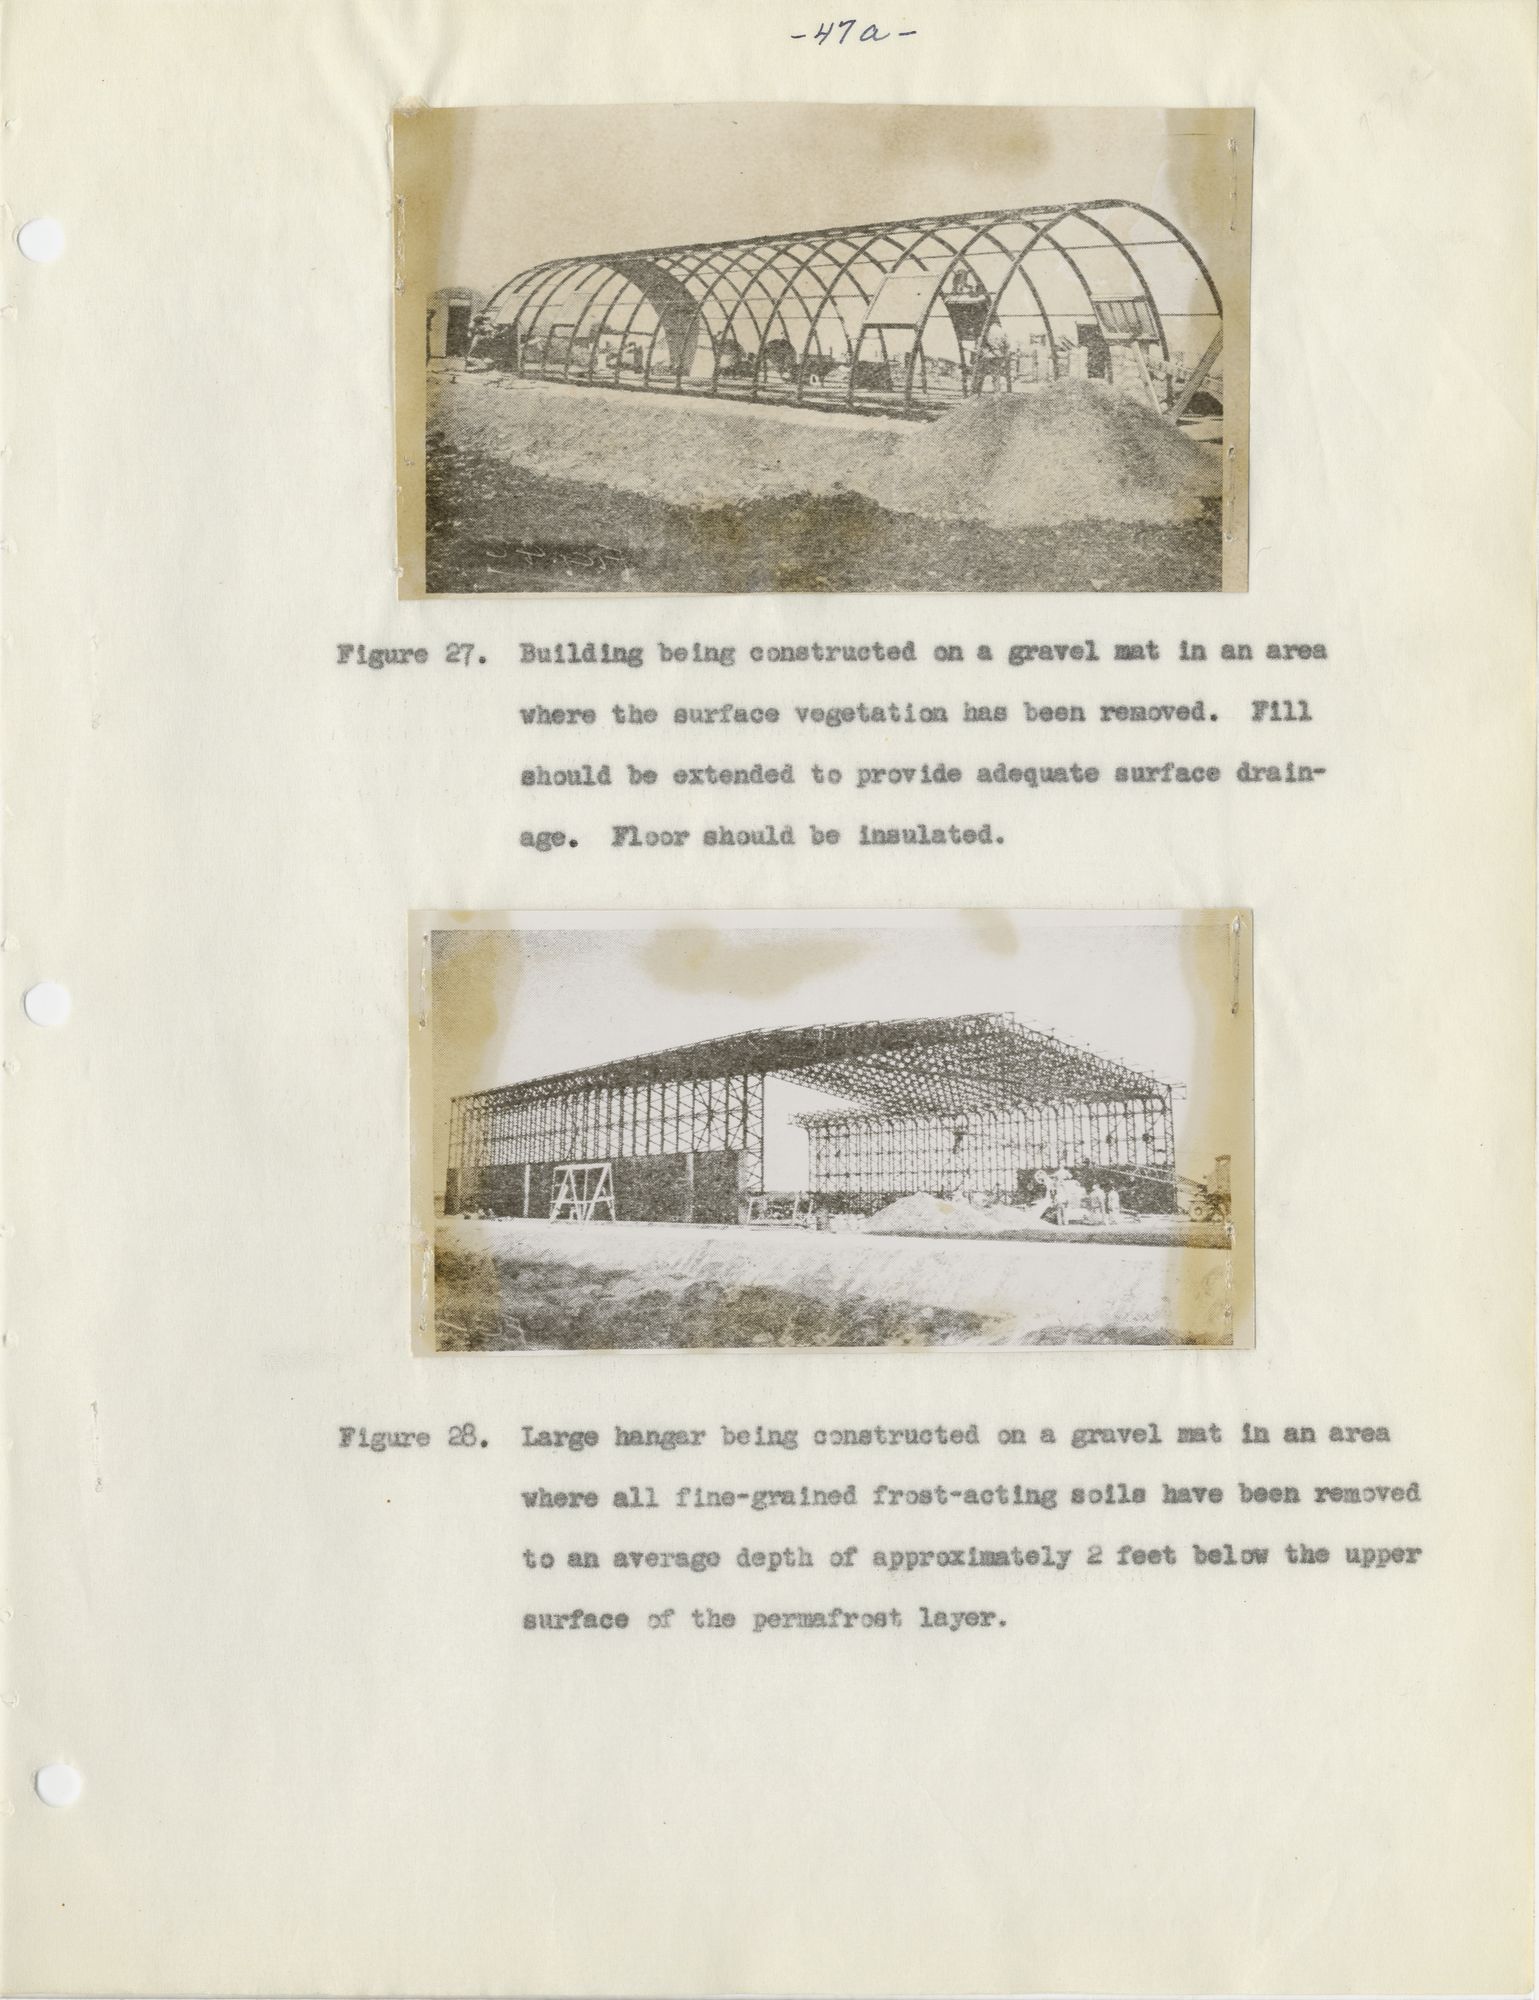
Building being constructed on a gravel mat in an area where the surface vegetation has been removed. Fill should be extended to provide adequate surface drainage. Floor should be insulated.
Large hangar being constructed on a gravel mat in an area where all fine-grained frost-acting soils have been removed to an average depth of approximately 2 feet below the upper surface of the permafrost layer.
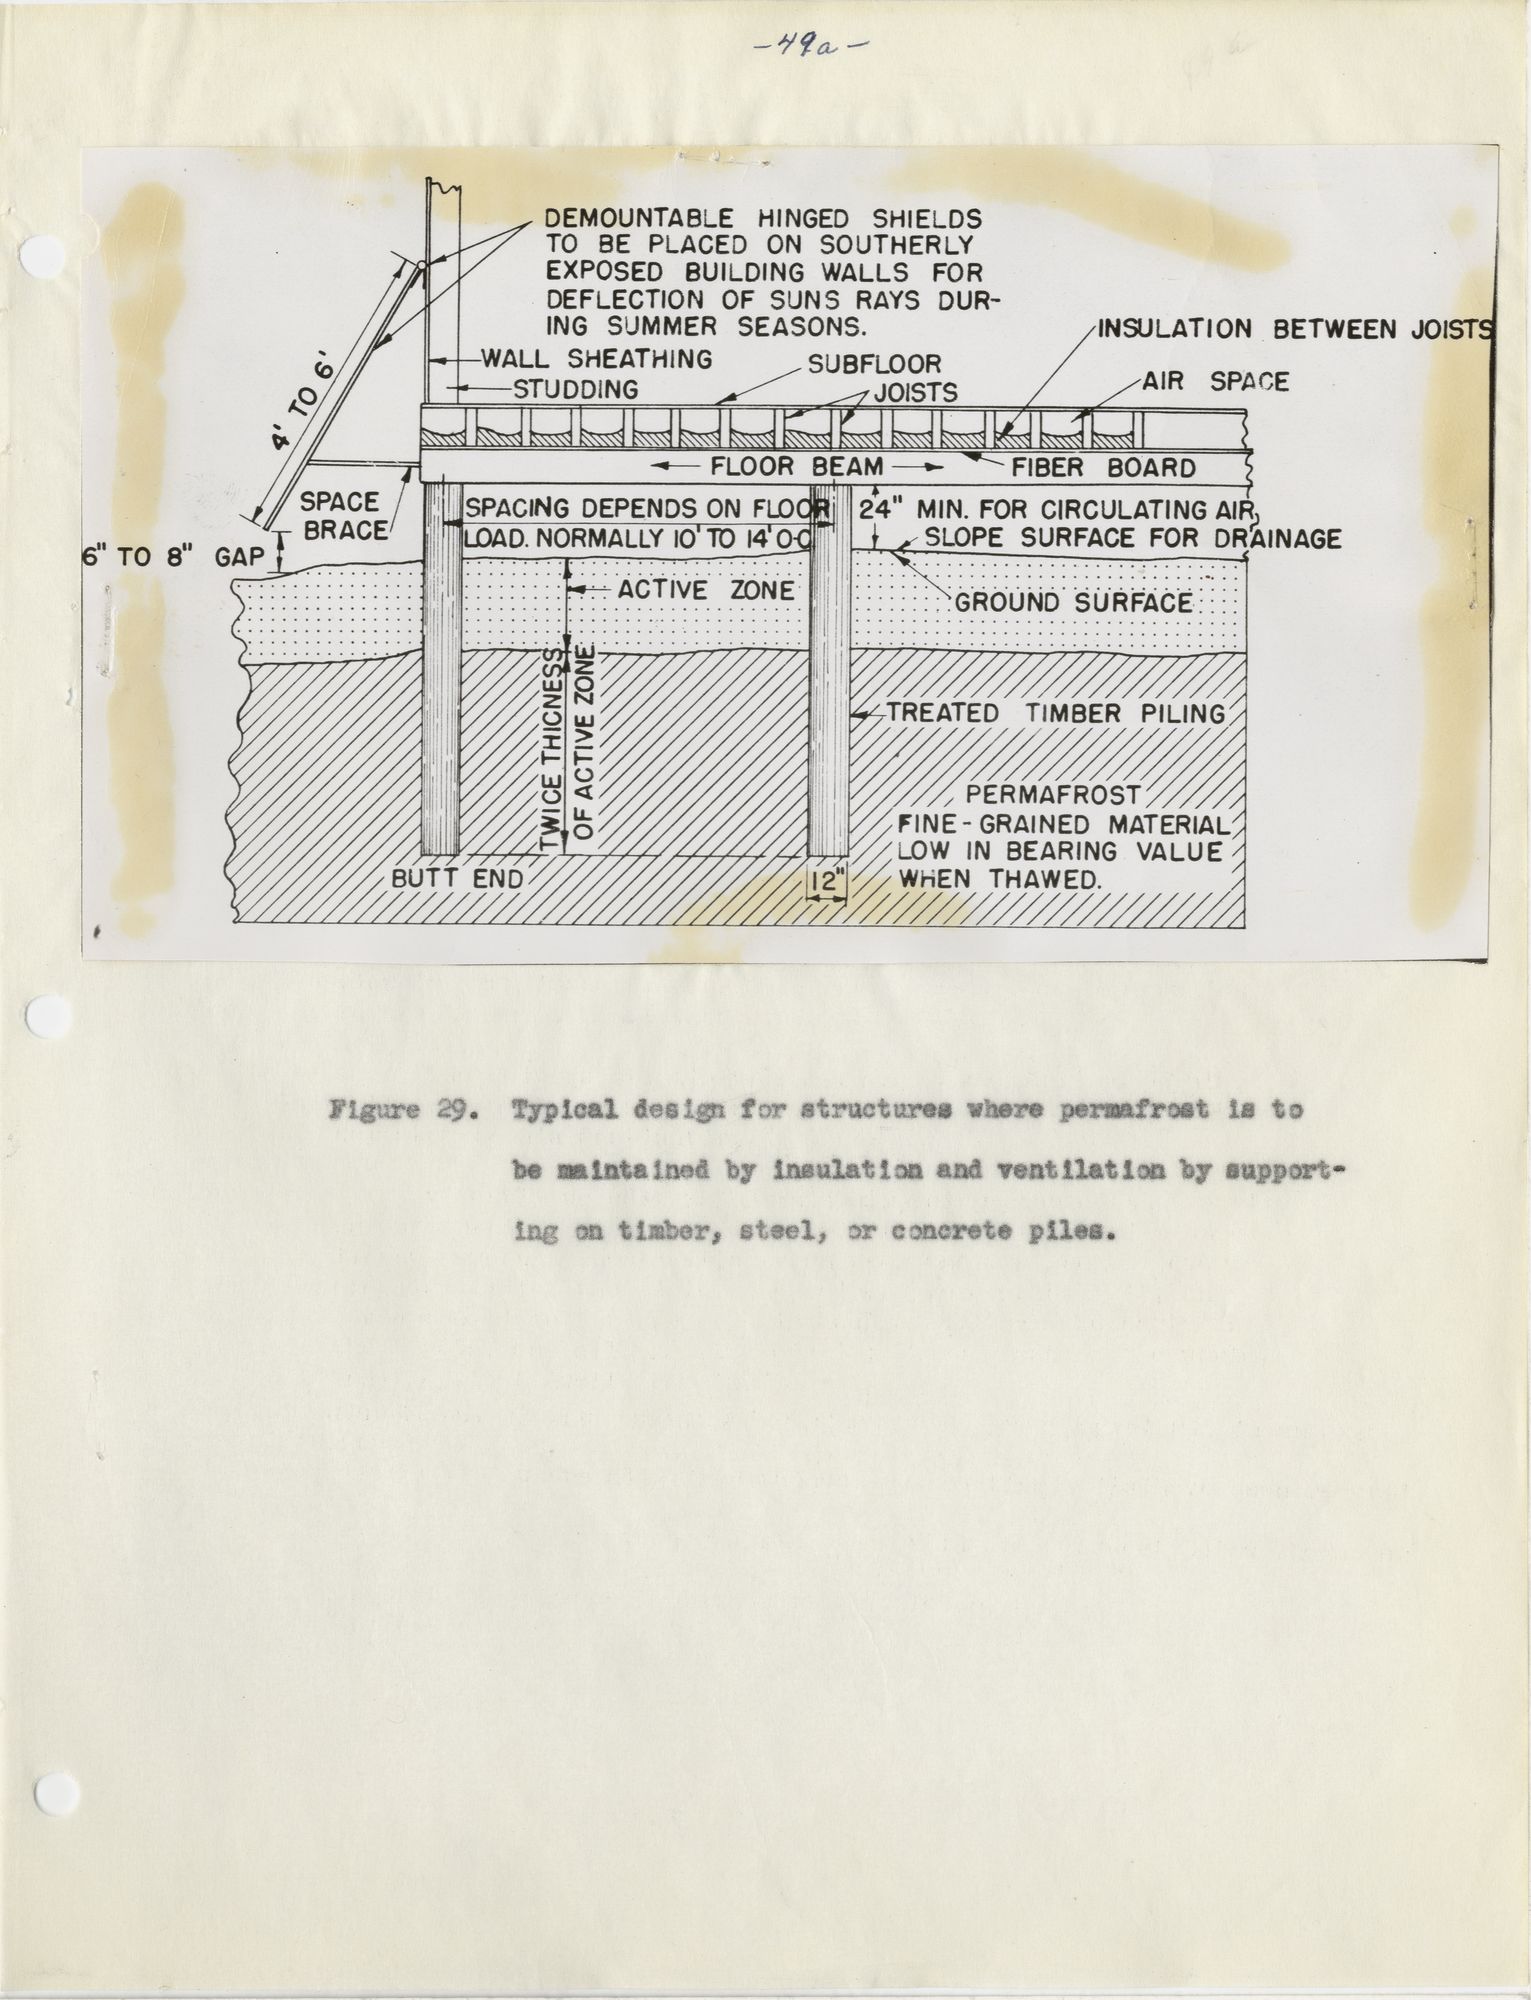
Typical design for structures where permafrost is to be maintained by insulation and ventilation by supporting on timber, steel, or concrete piles.
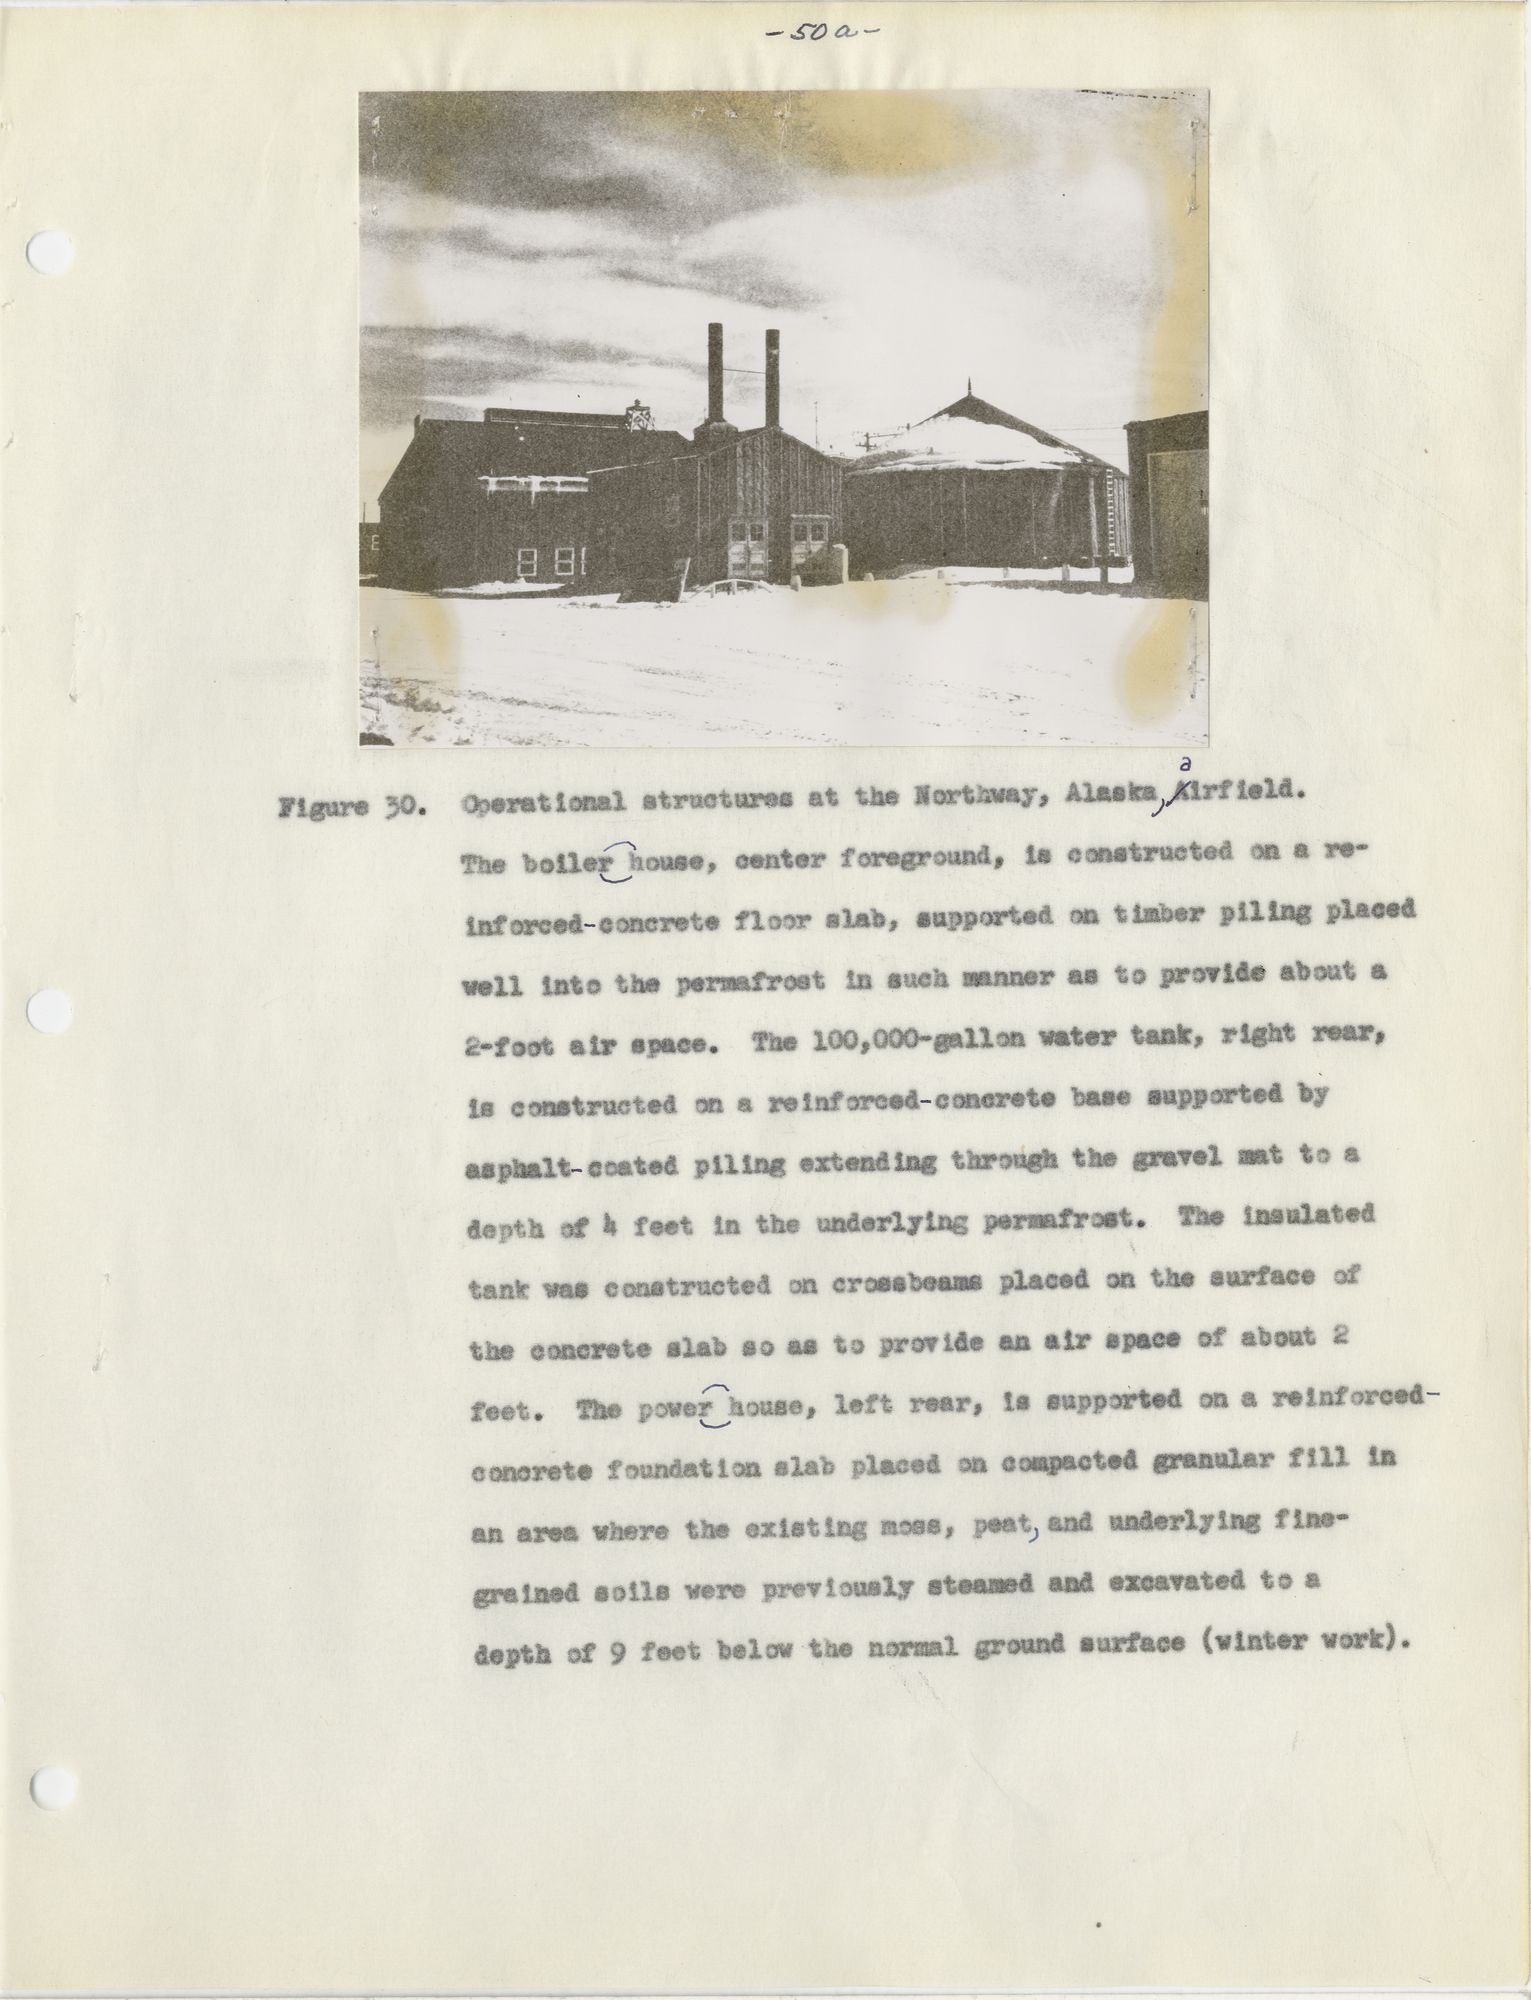
Operational structures at the Northway, Alaska, airfield.
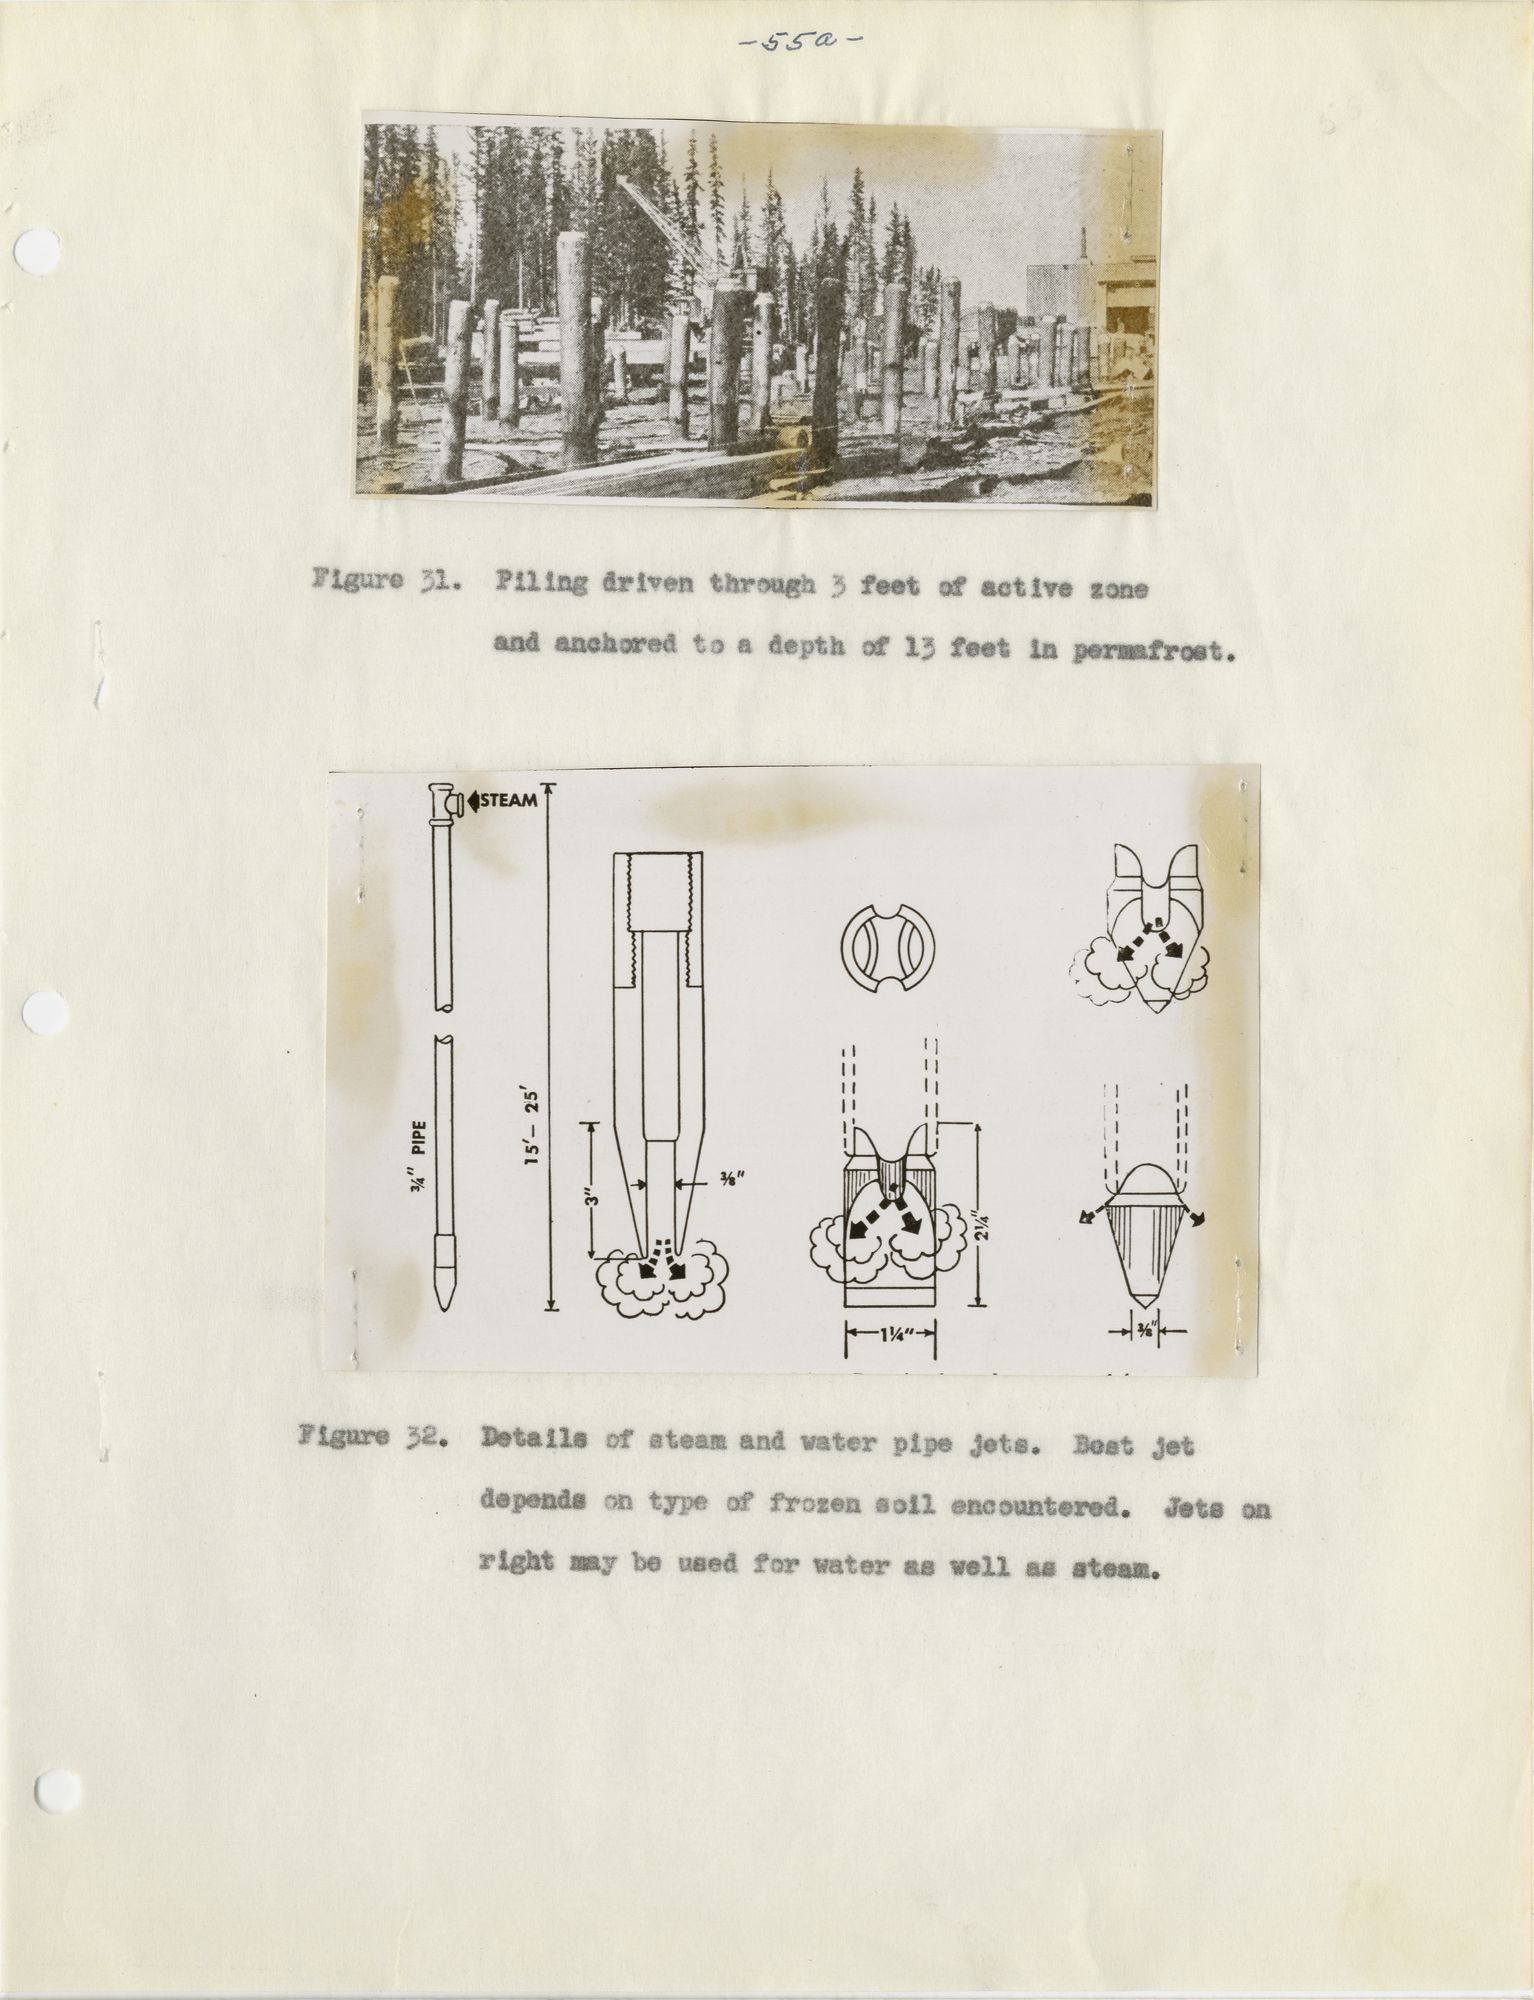
Piling driven through 3 feet of active zone and anchored to a depth of 13 feet in permafrost.
Details of steam and water pipe jest. Best jet depends on type of frozen soil encountered. Jets on right may be used for water as well as steam.
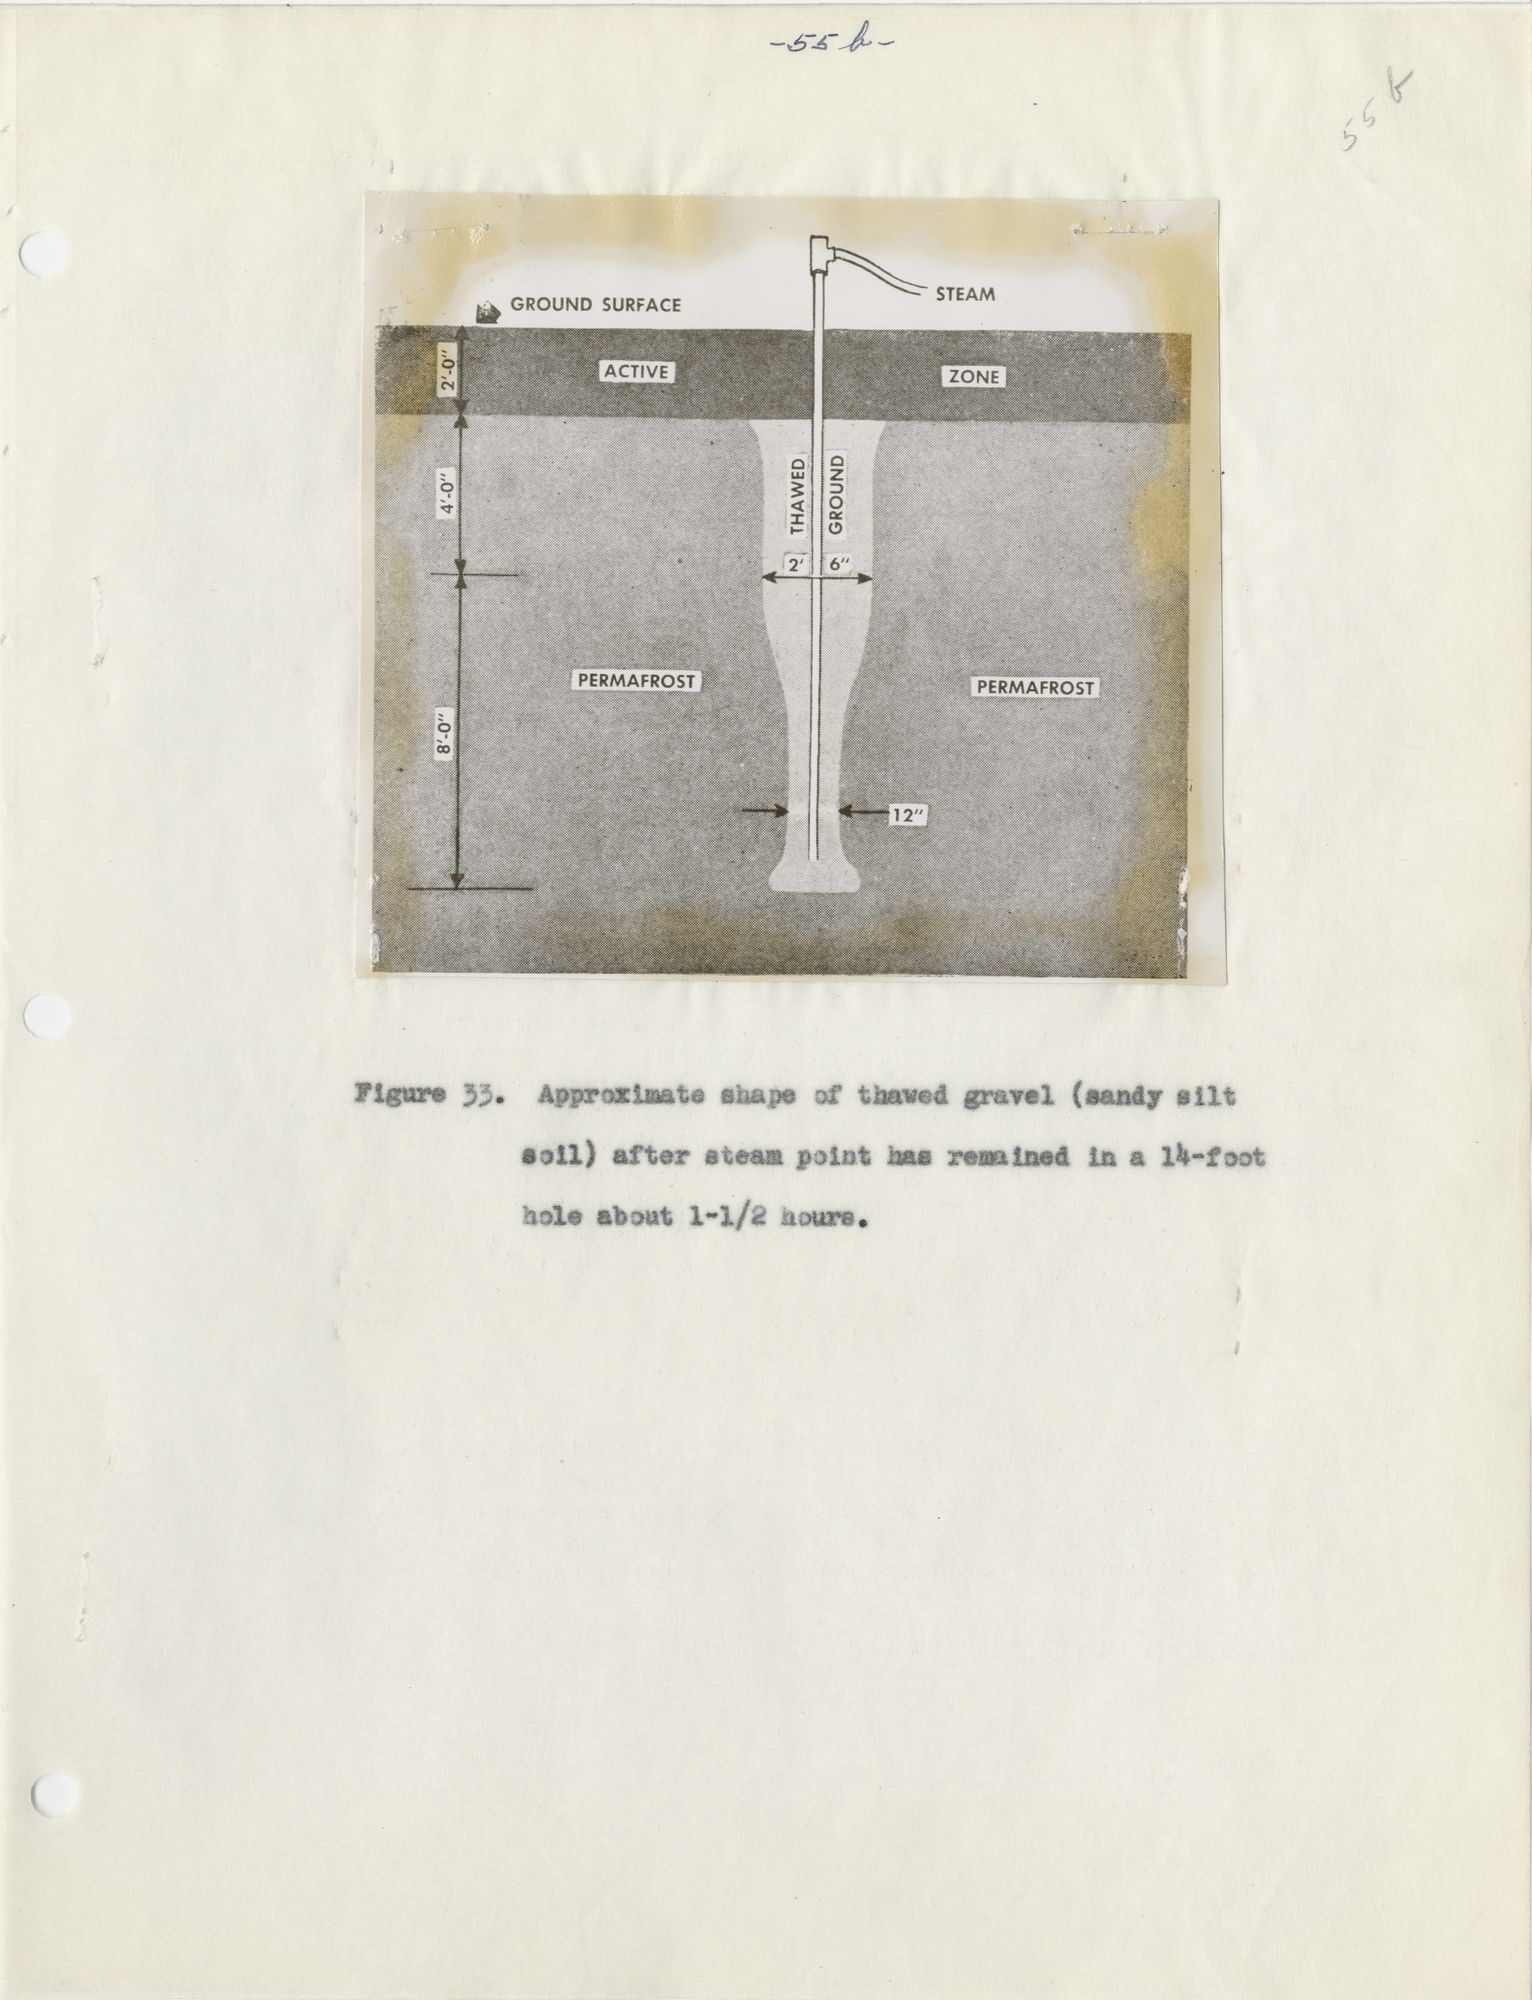
Approximate shape of thawed gravel (sandy silt soil) after steam point has remained in a 14-foot hole about 1-1/2 hours.
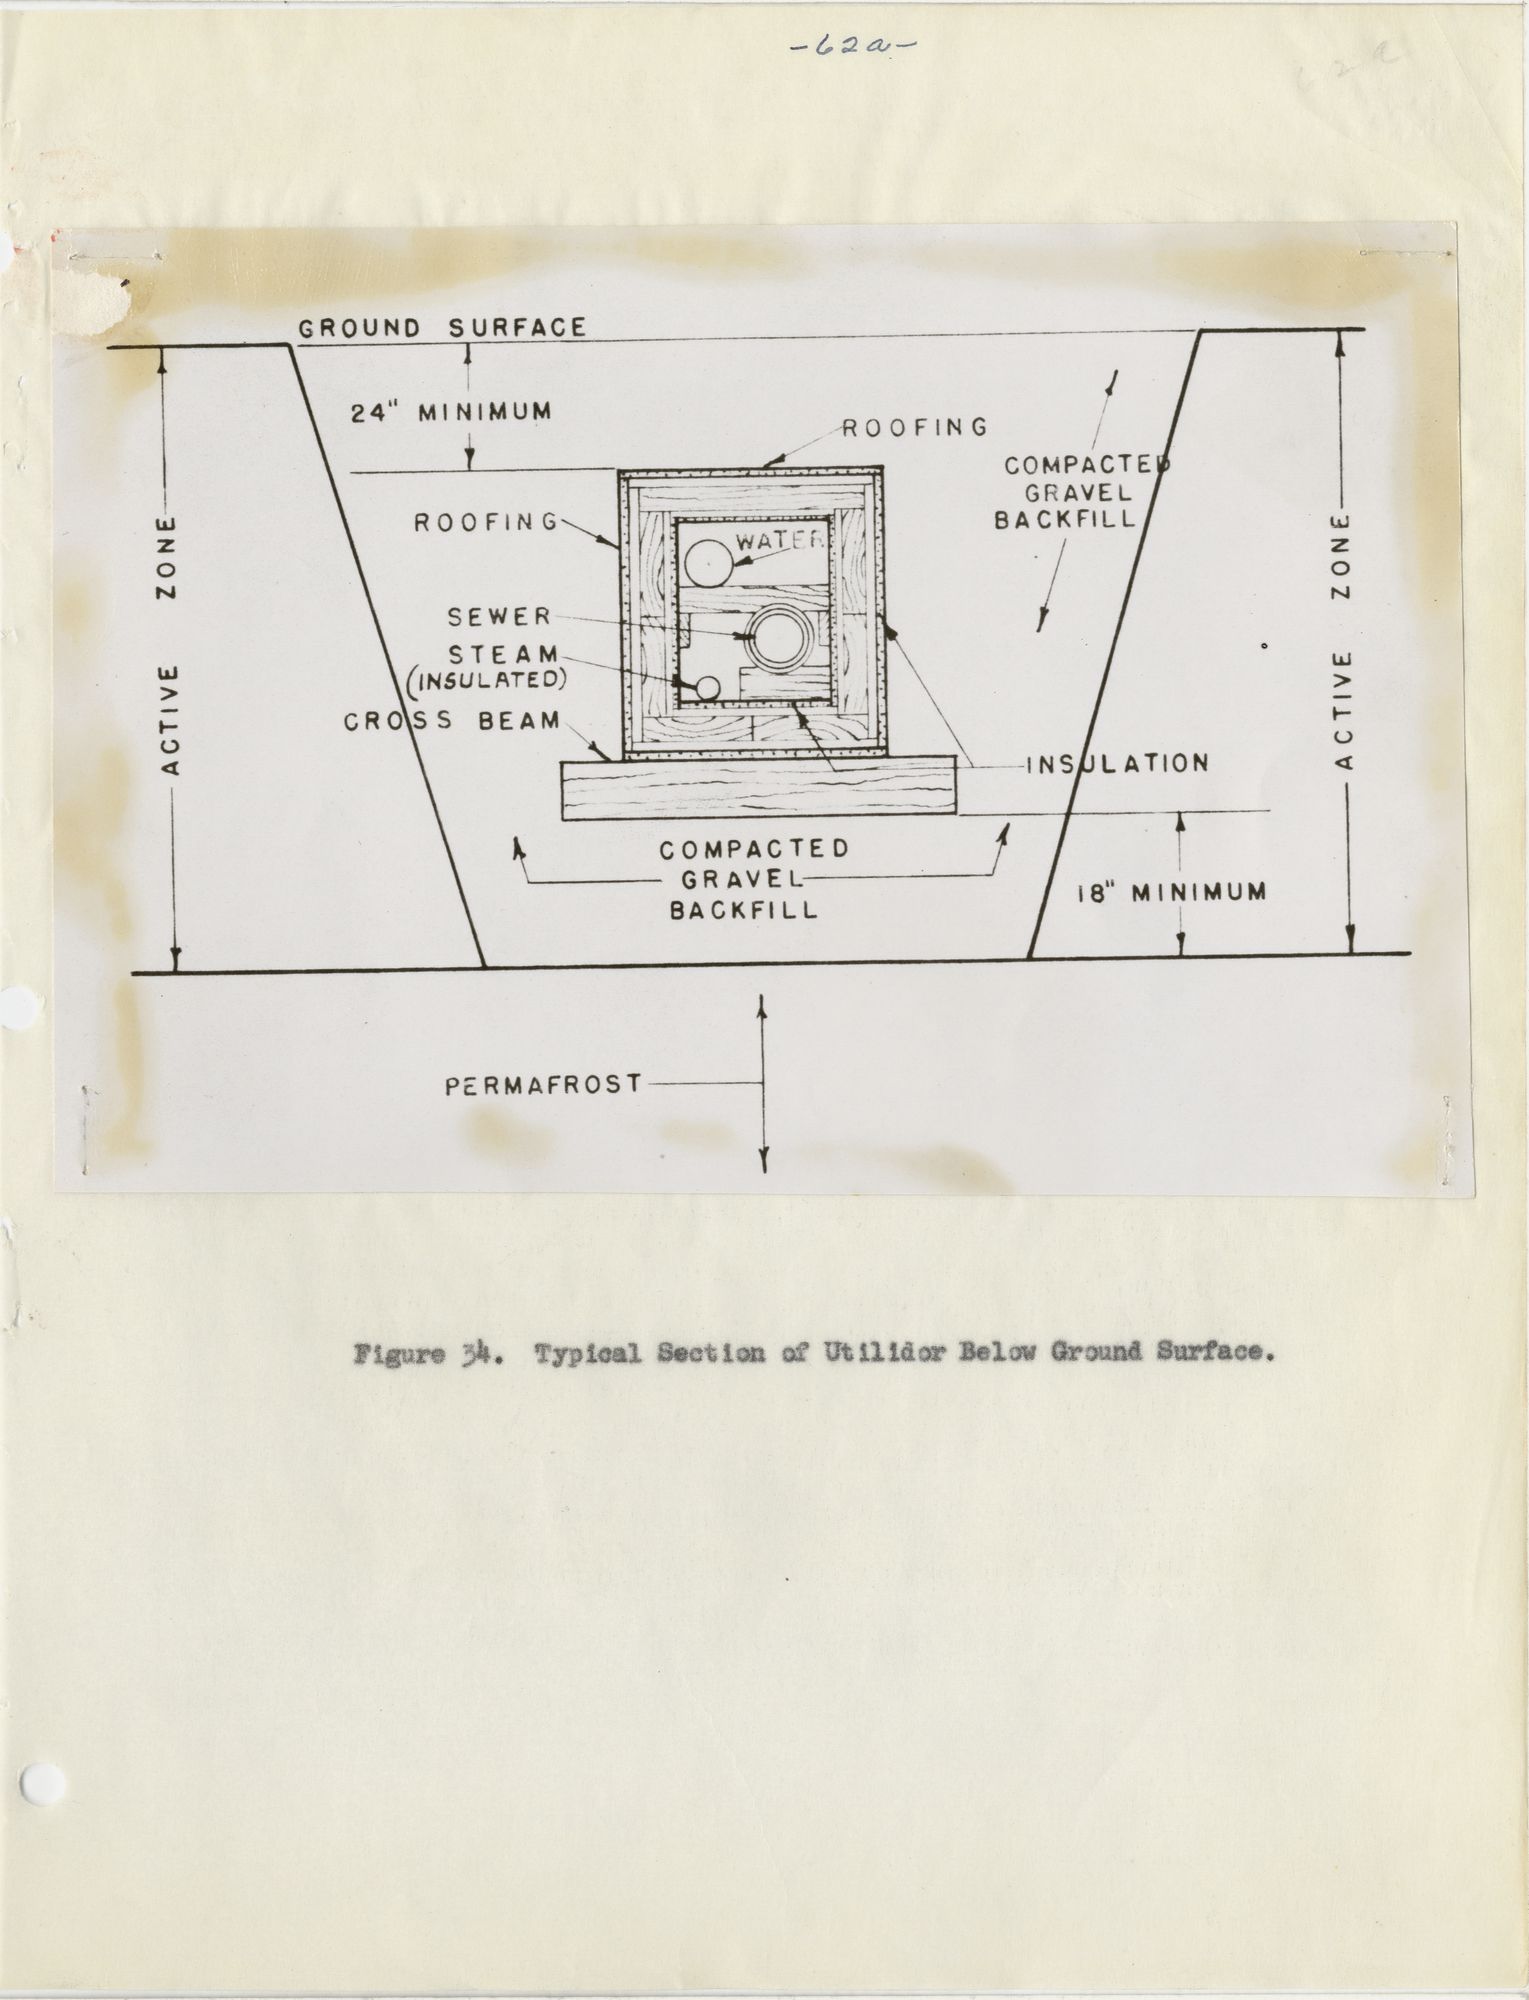
Typical Section of Utilidor Below Ground Surface.
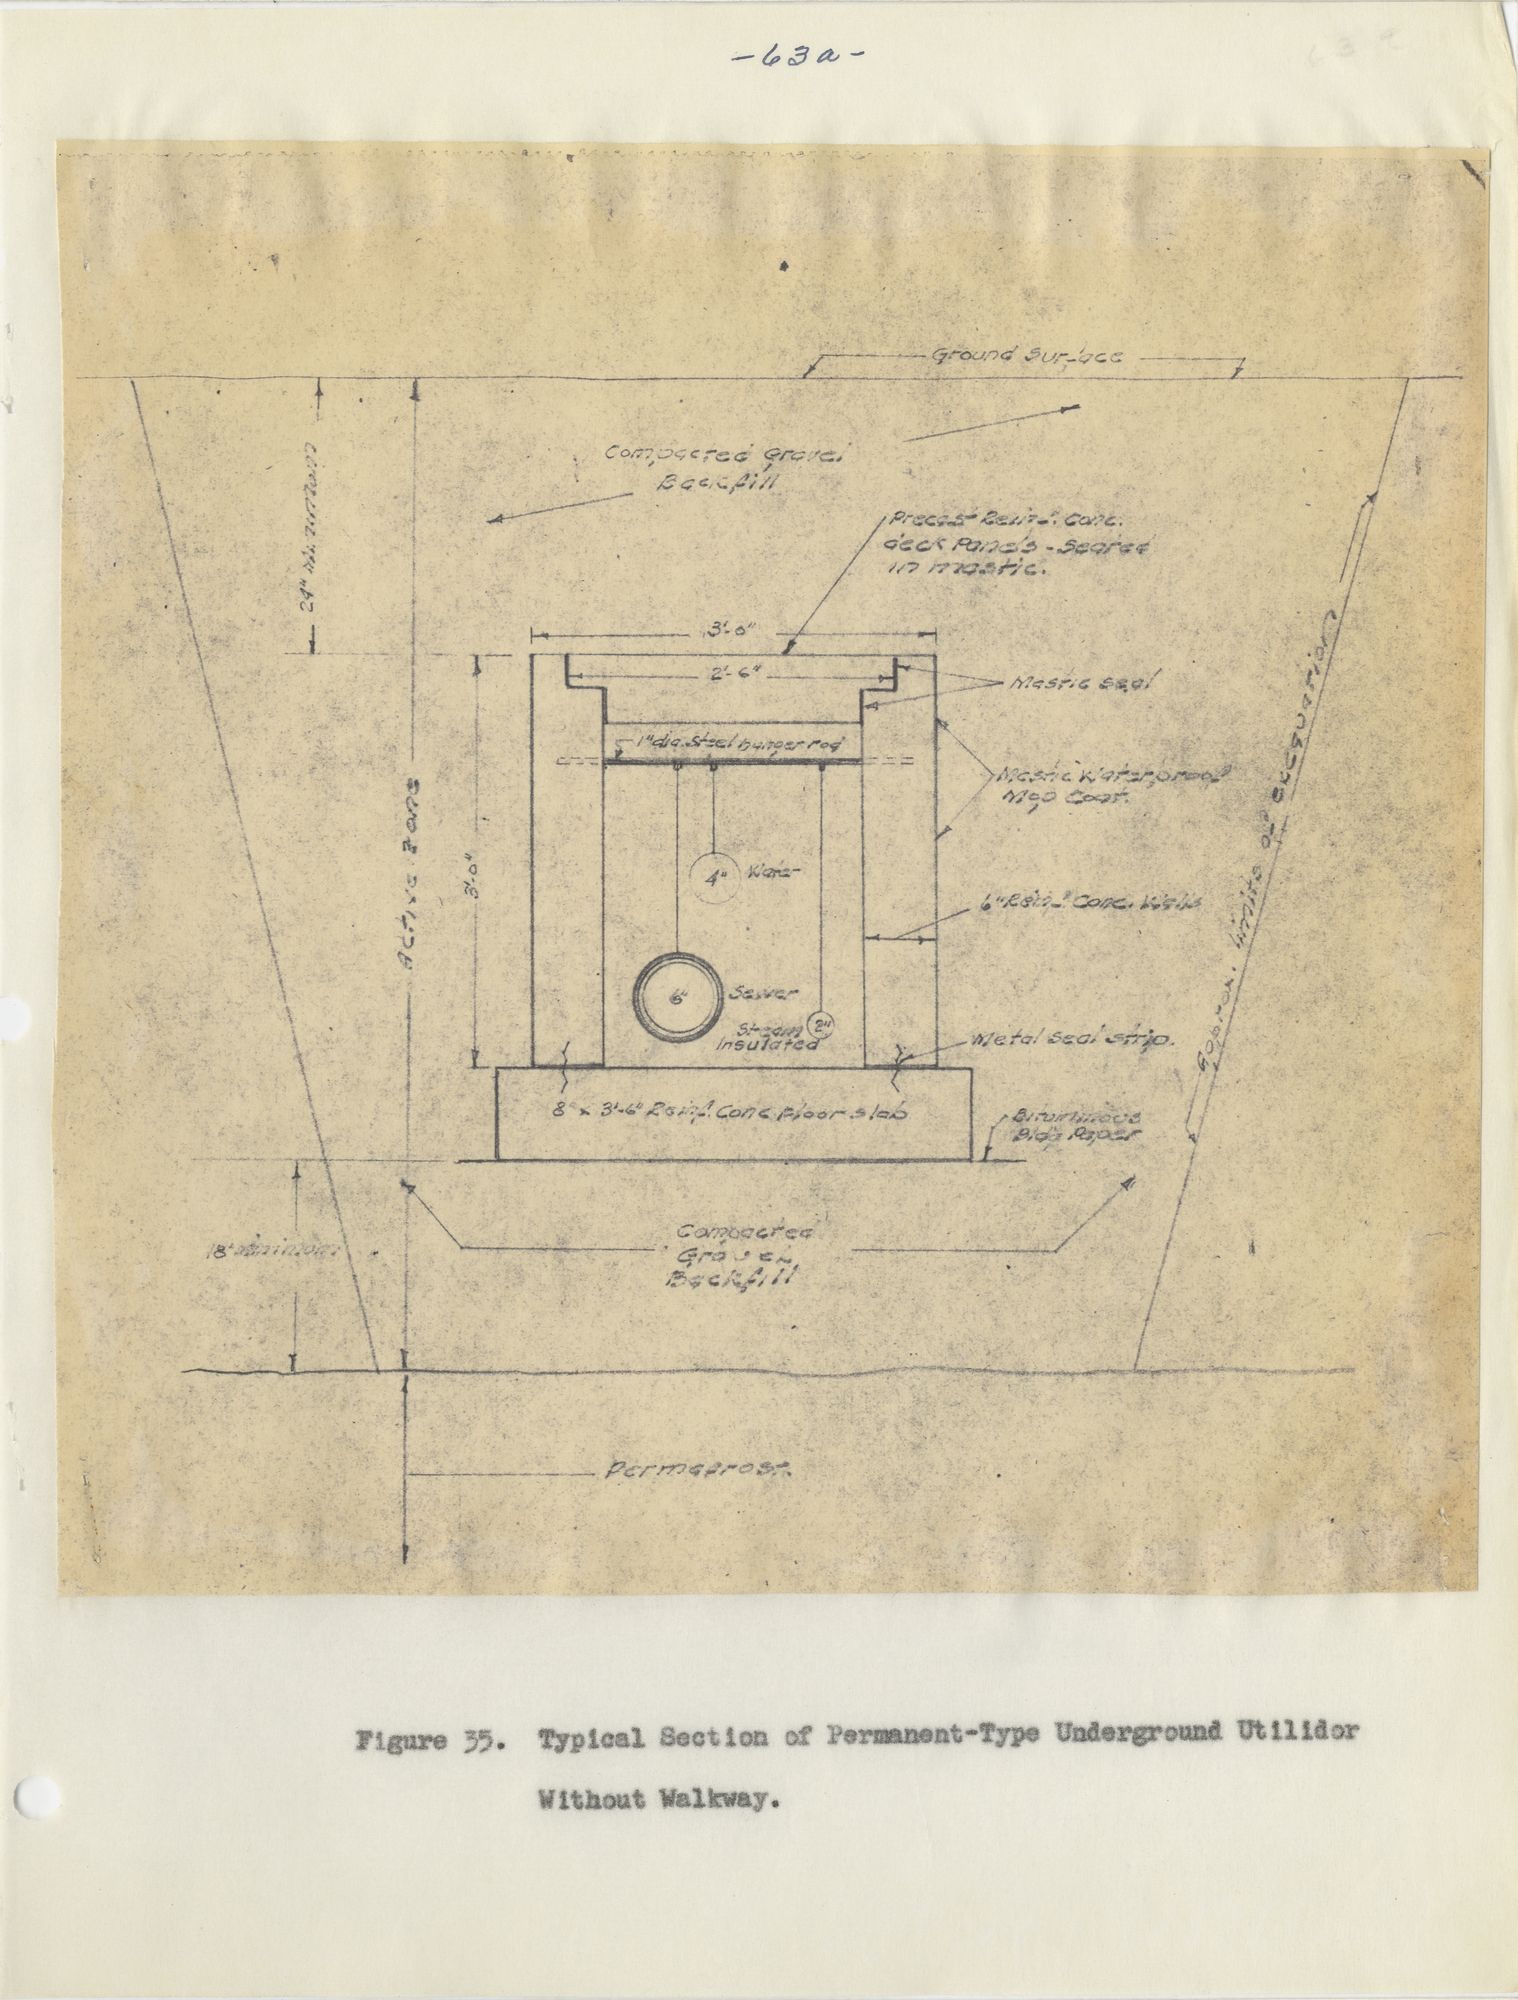
Typical Section of Permanent-Type Underground Utilidor Without Walkway.
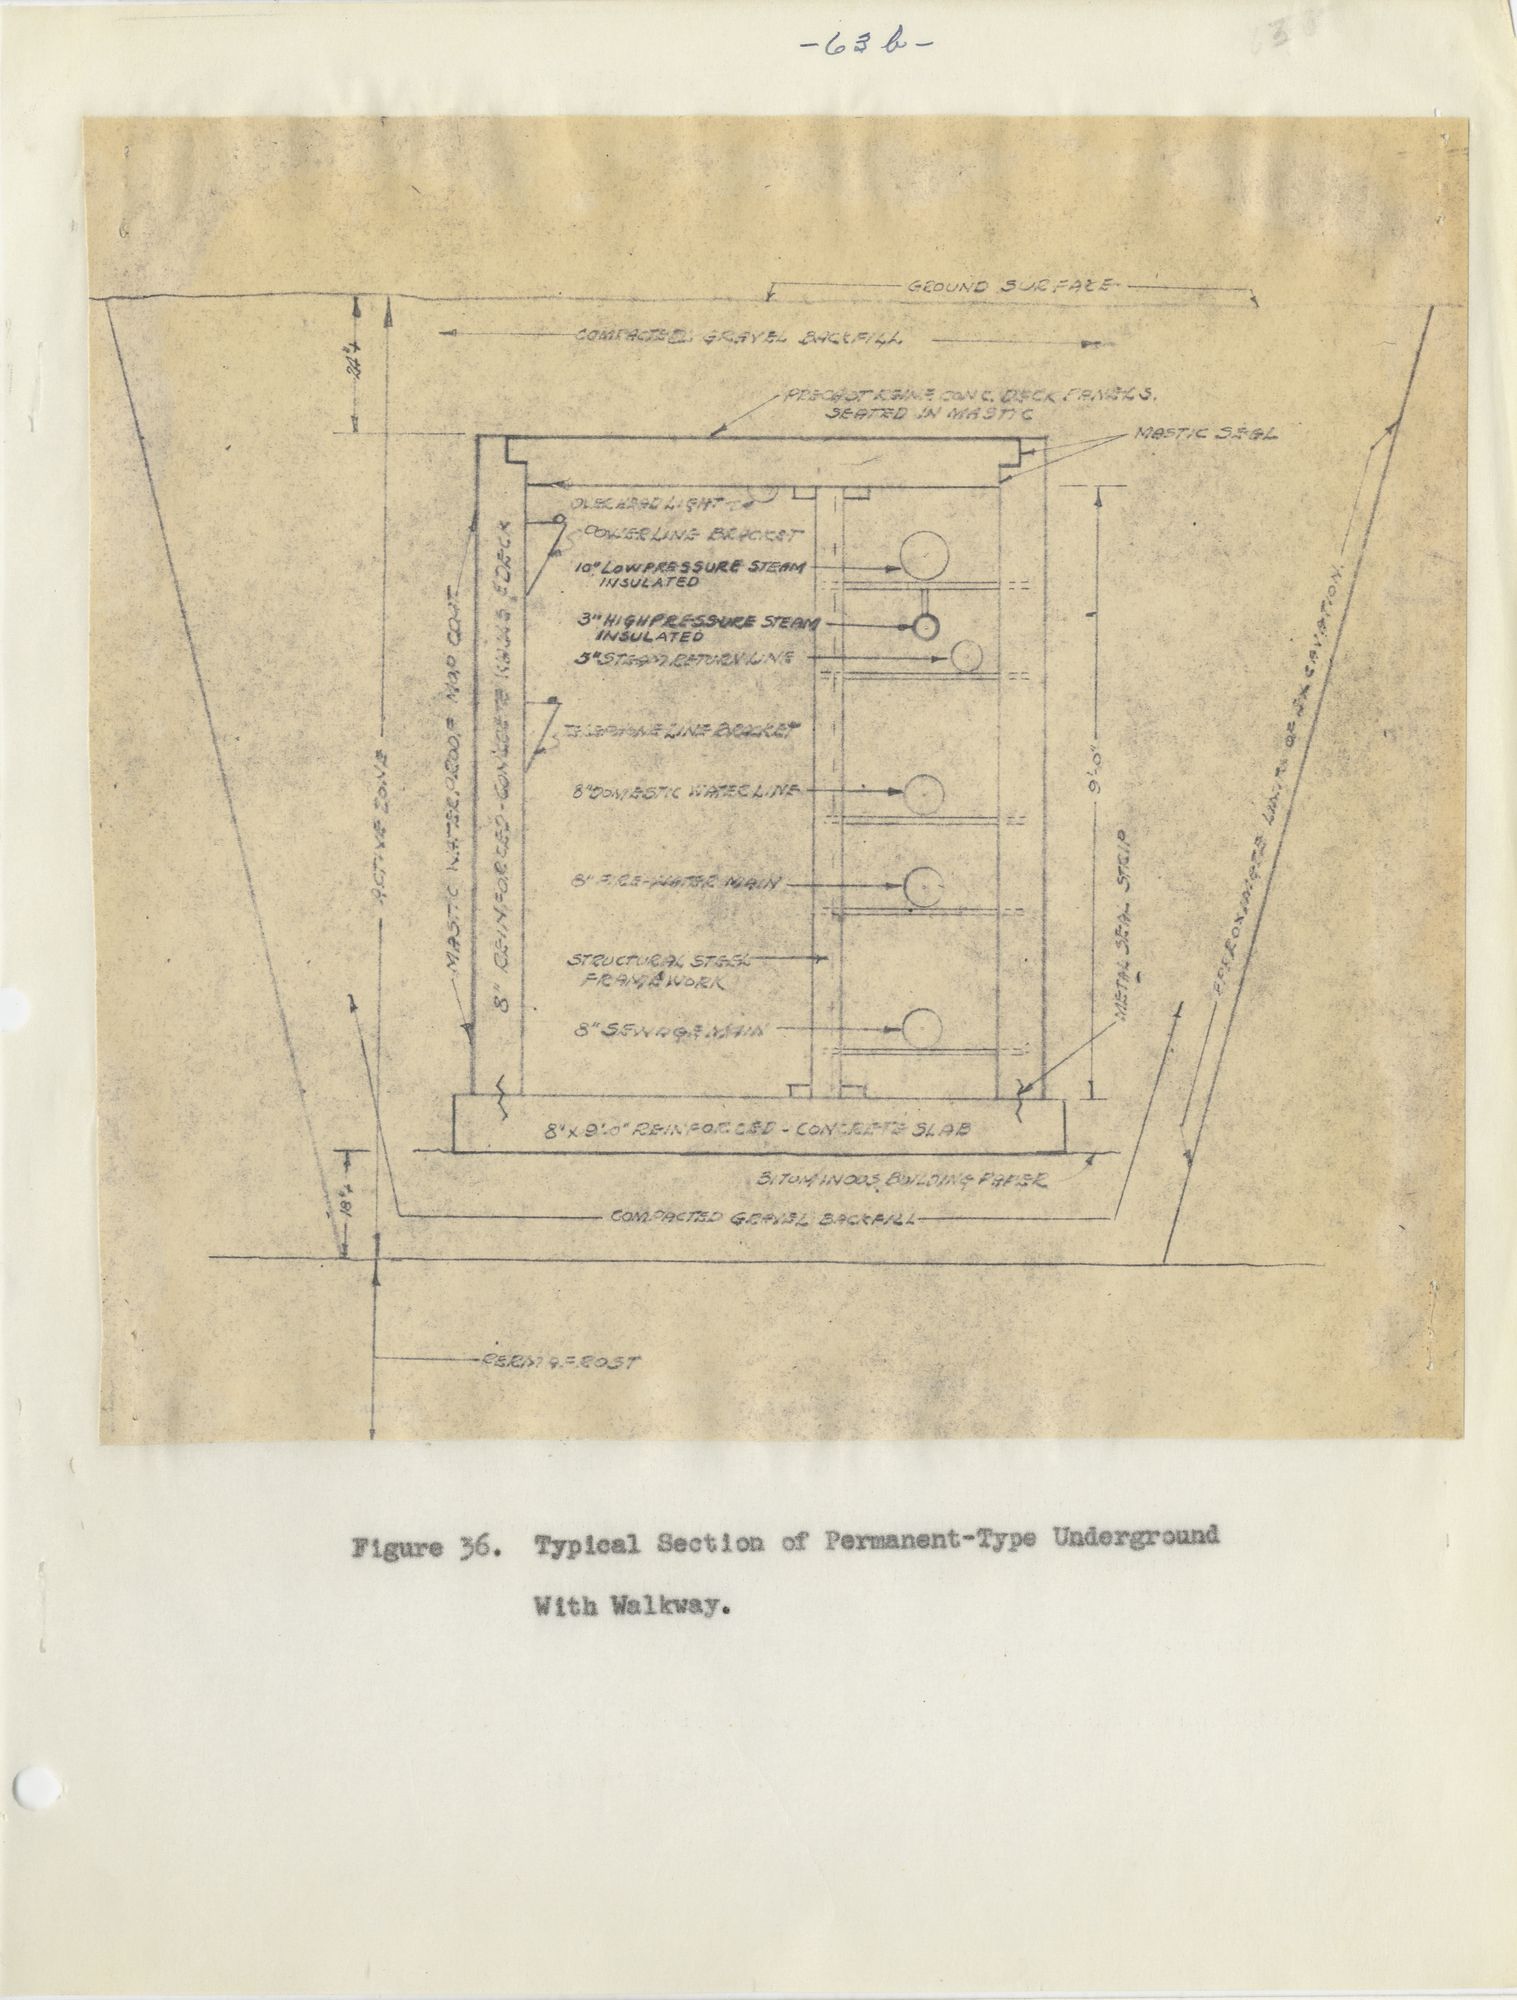
Typical Section of Permanent-Type Underground With Walkway.
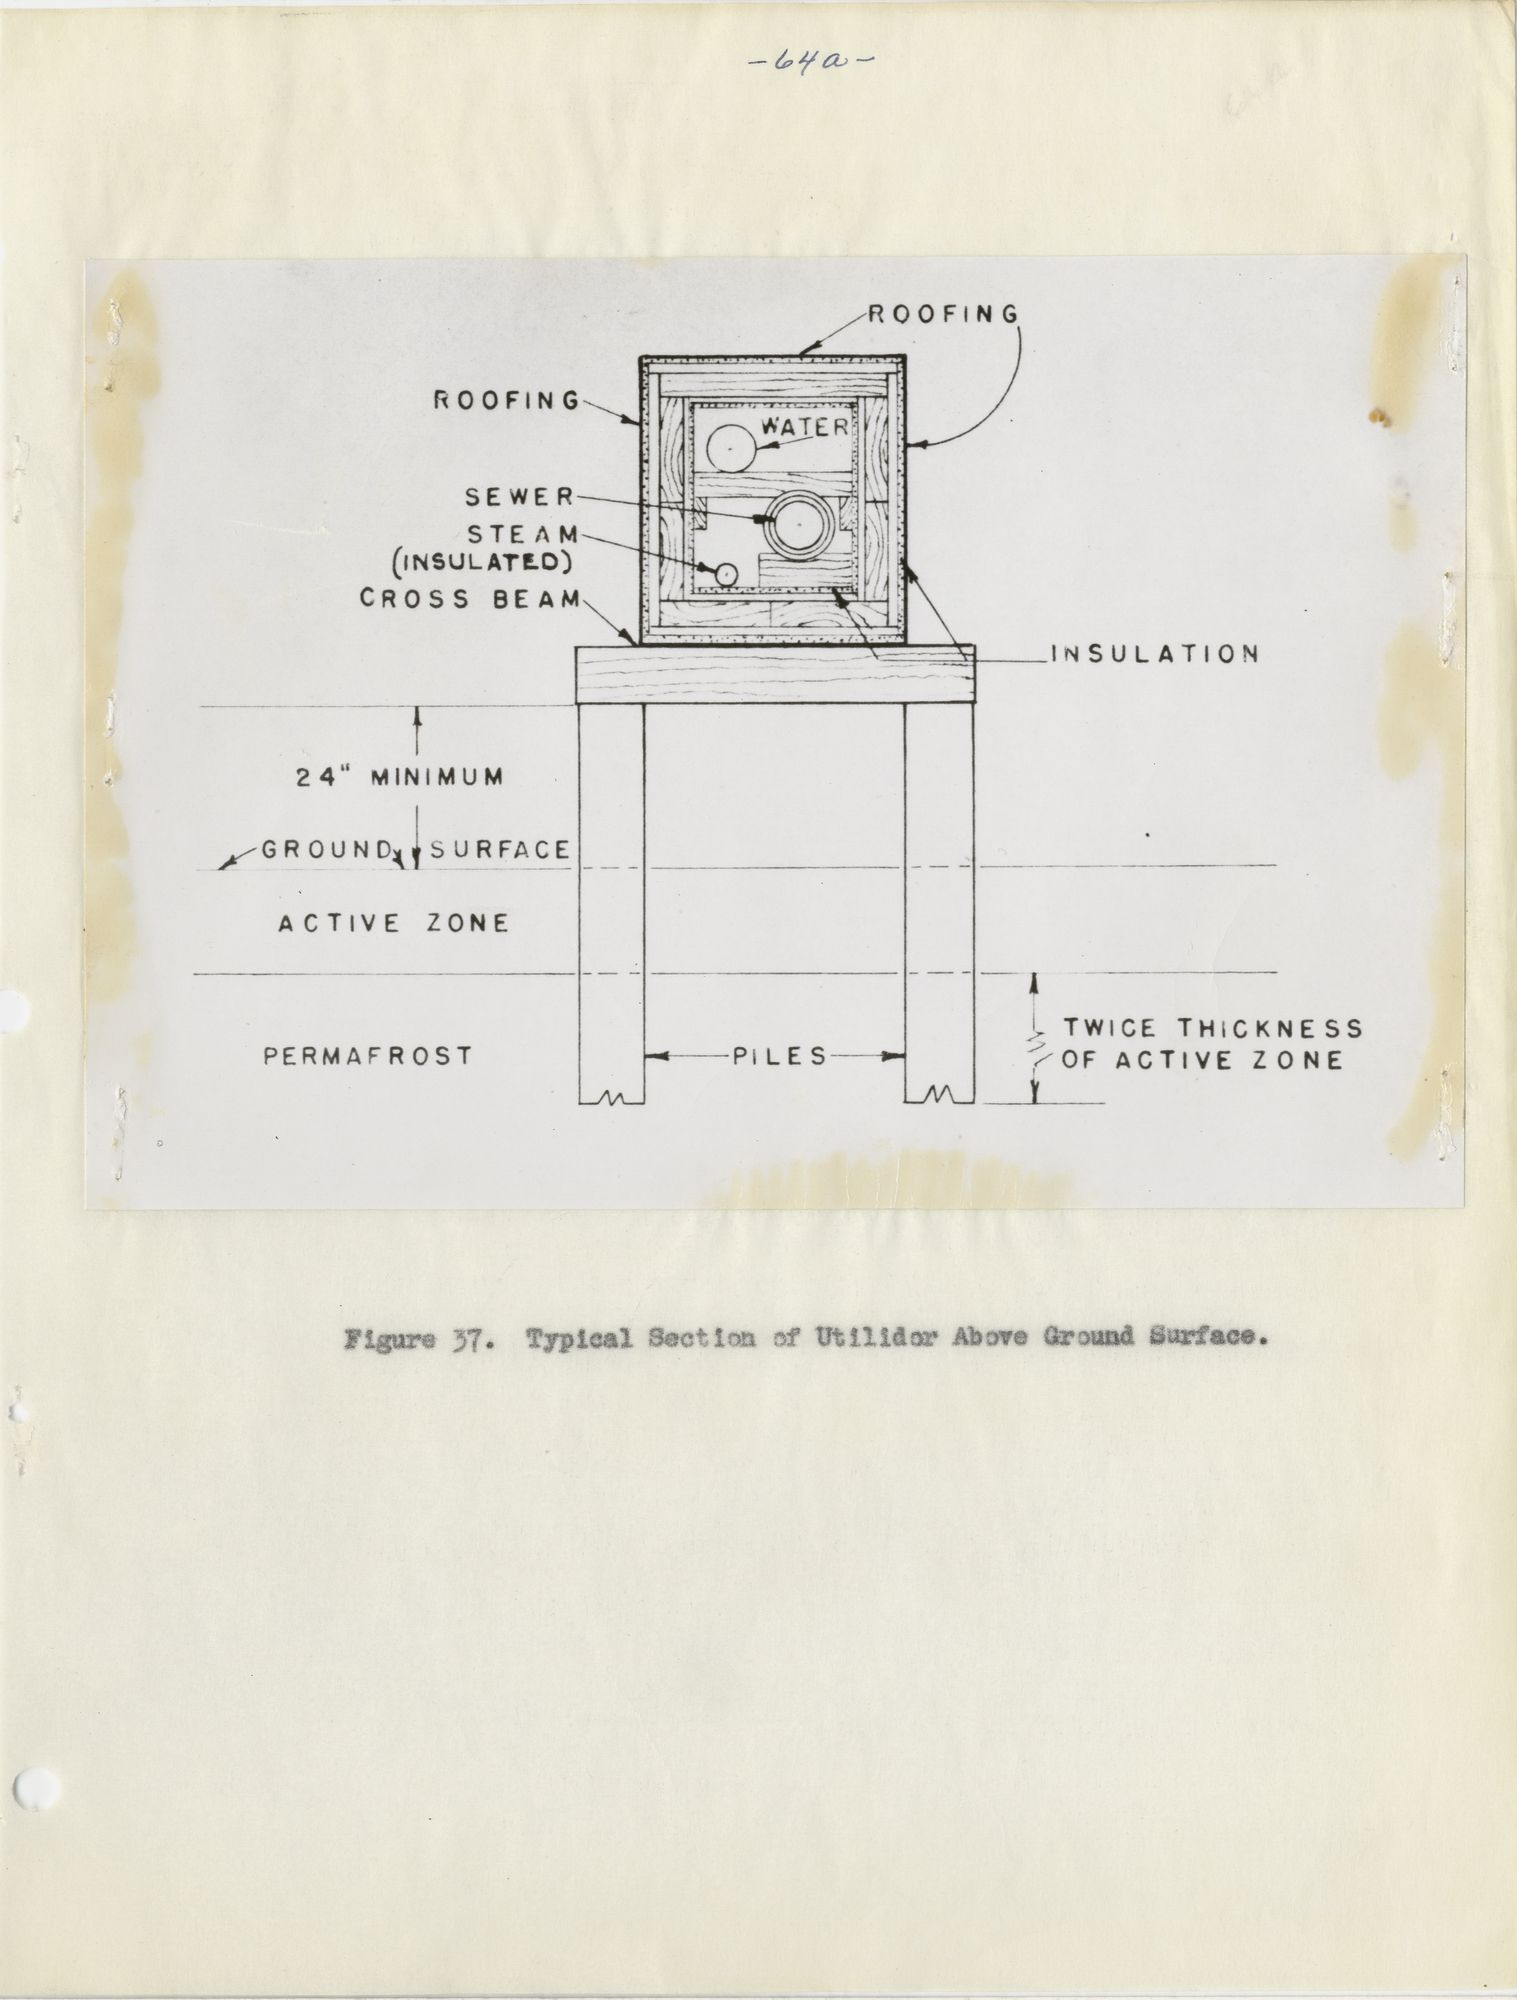
Typical Section of Utilidor Above Ground Surface.
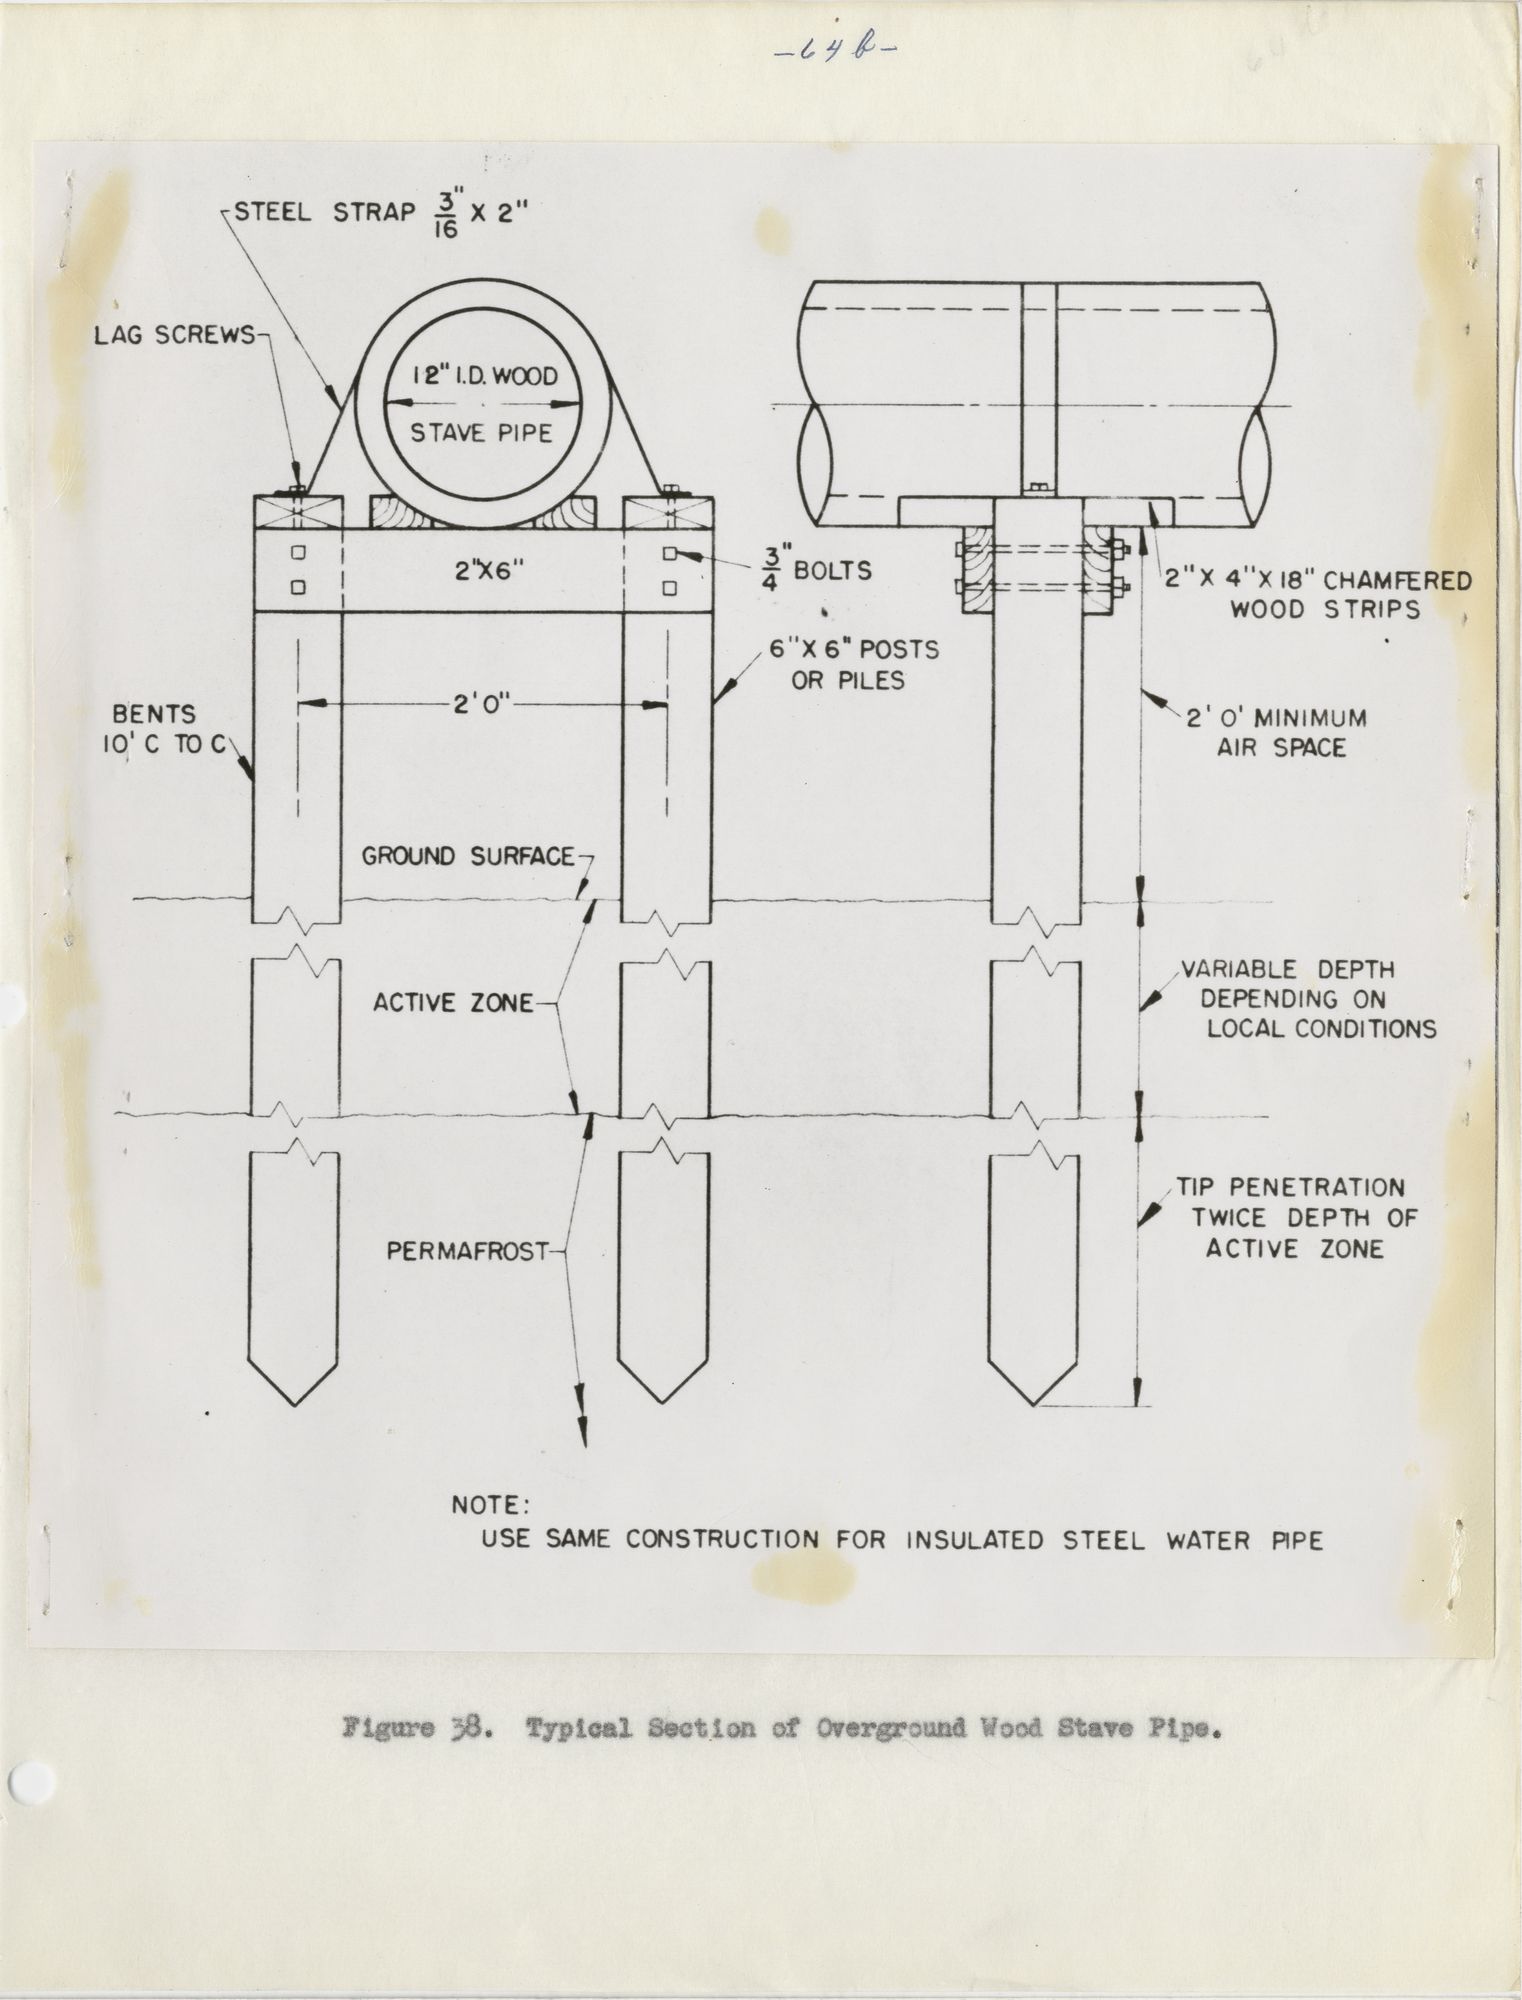
Typical Section of Overground Wood Stave Pipe.
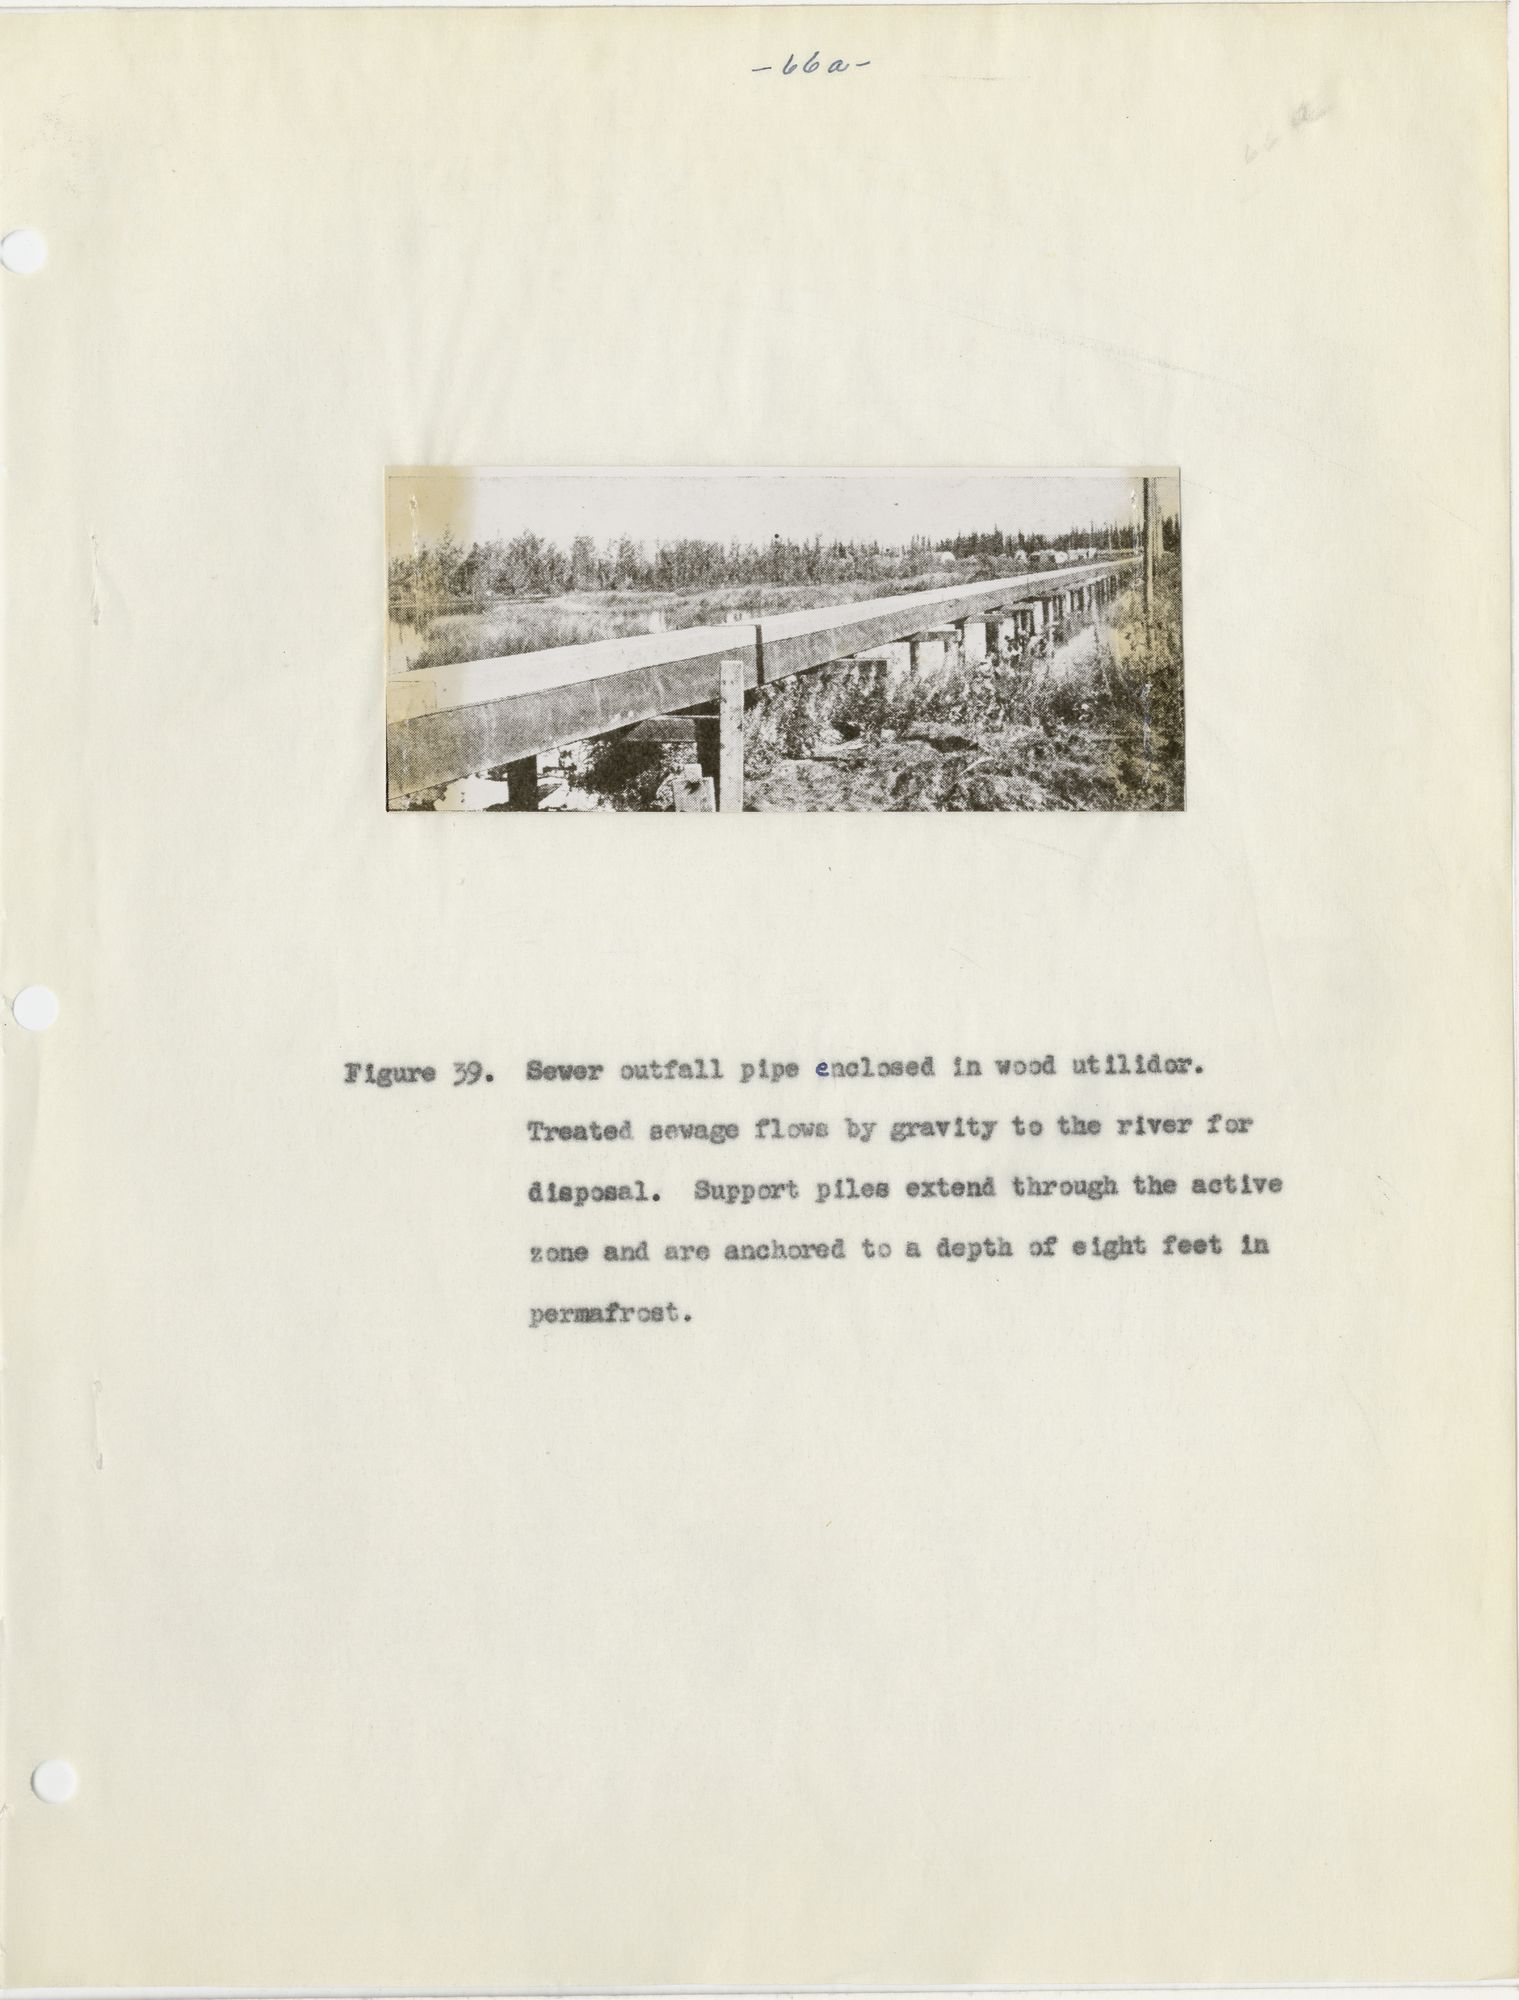
Sewer outfall pipe enclosed in wood utilidor. Treated sewage flows by gravity to the river for disposal. Support piles extend through the active zone and are anchored to a depth of eight feet in permafrost.
Physics of Ground Frost
Diagram of the liquid limit

[From description on previous page:] This figure shows the conditions of saturation in two originally saturated columns of medium sand, two and one-half years after drainage of the columns by discharge through their lower ends was started. The lowest section (I) of the specimens was still completely saturated. In the middle section (II) part of the void space was filled with air, but the water content of the sand formed continuous threads. In the uppermost part (III) of the specimens the soil moisture probably consisted of individual water particles surrounding the points of contact between grains. [Another sketch seems to represent the same concept and is crossed out.]
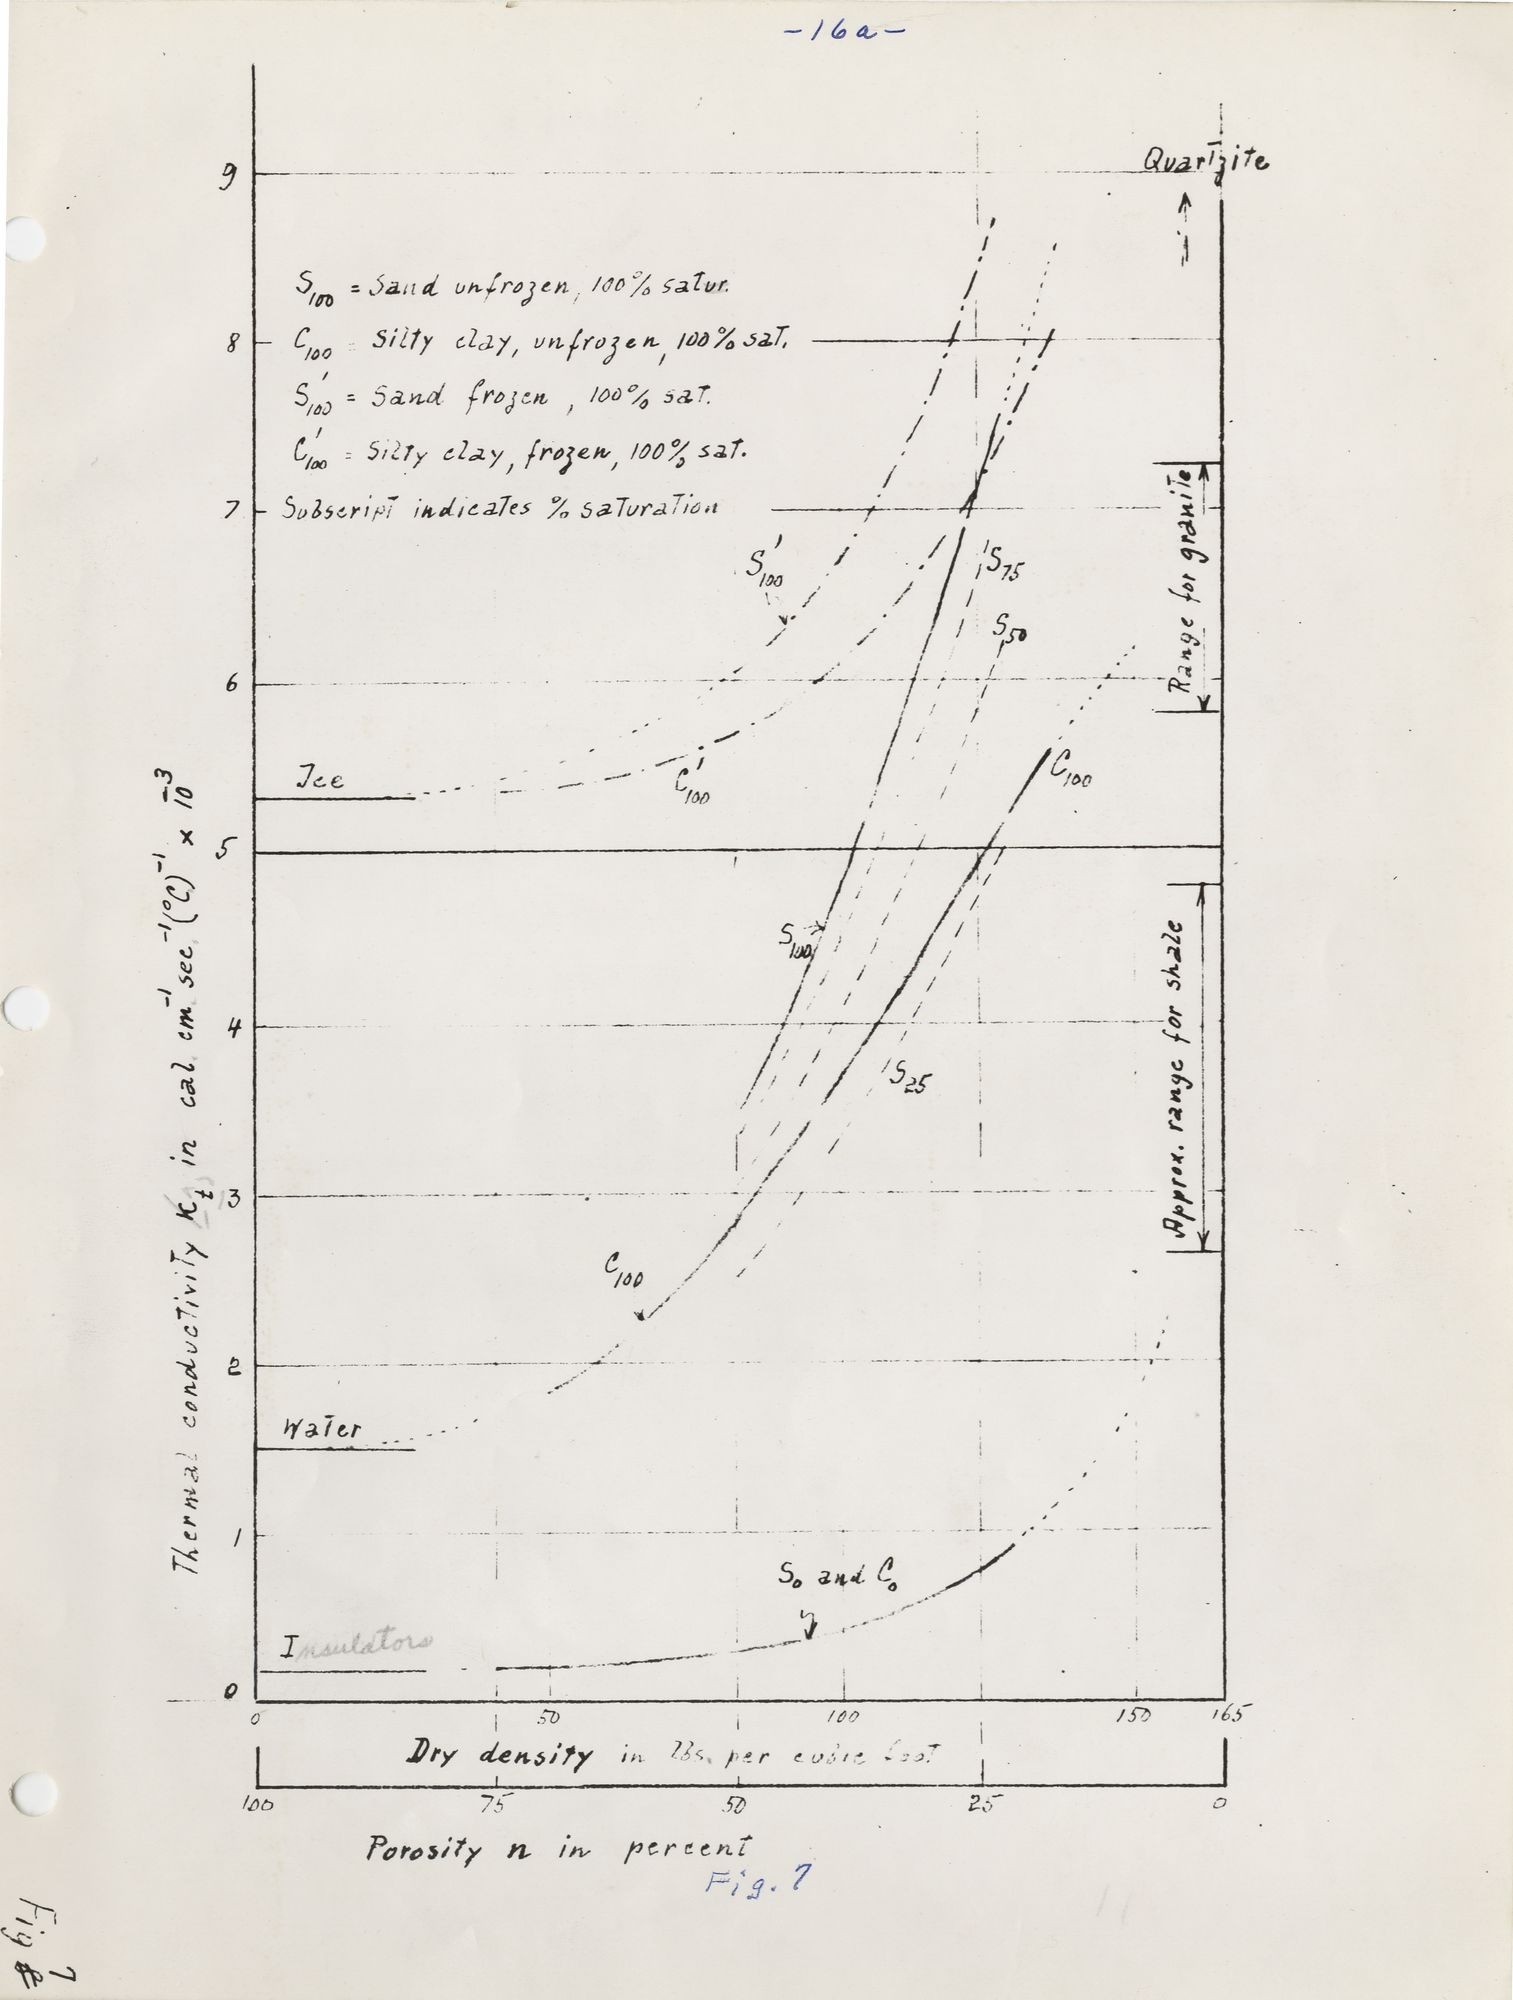
Graph showing the relationship between porosity n in percent and thermal conductivity for a variety of soils

[From description on previous page:] Figure 8 shows ground temperatures in a region of constant temperature.
Figure 9 shows geoisotherms and lines of flow of heat below a mountain chain.
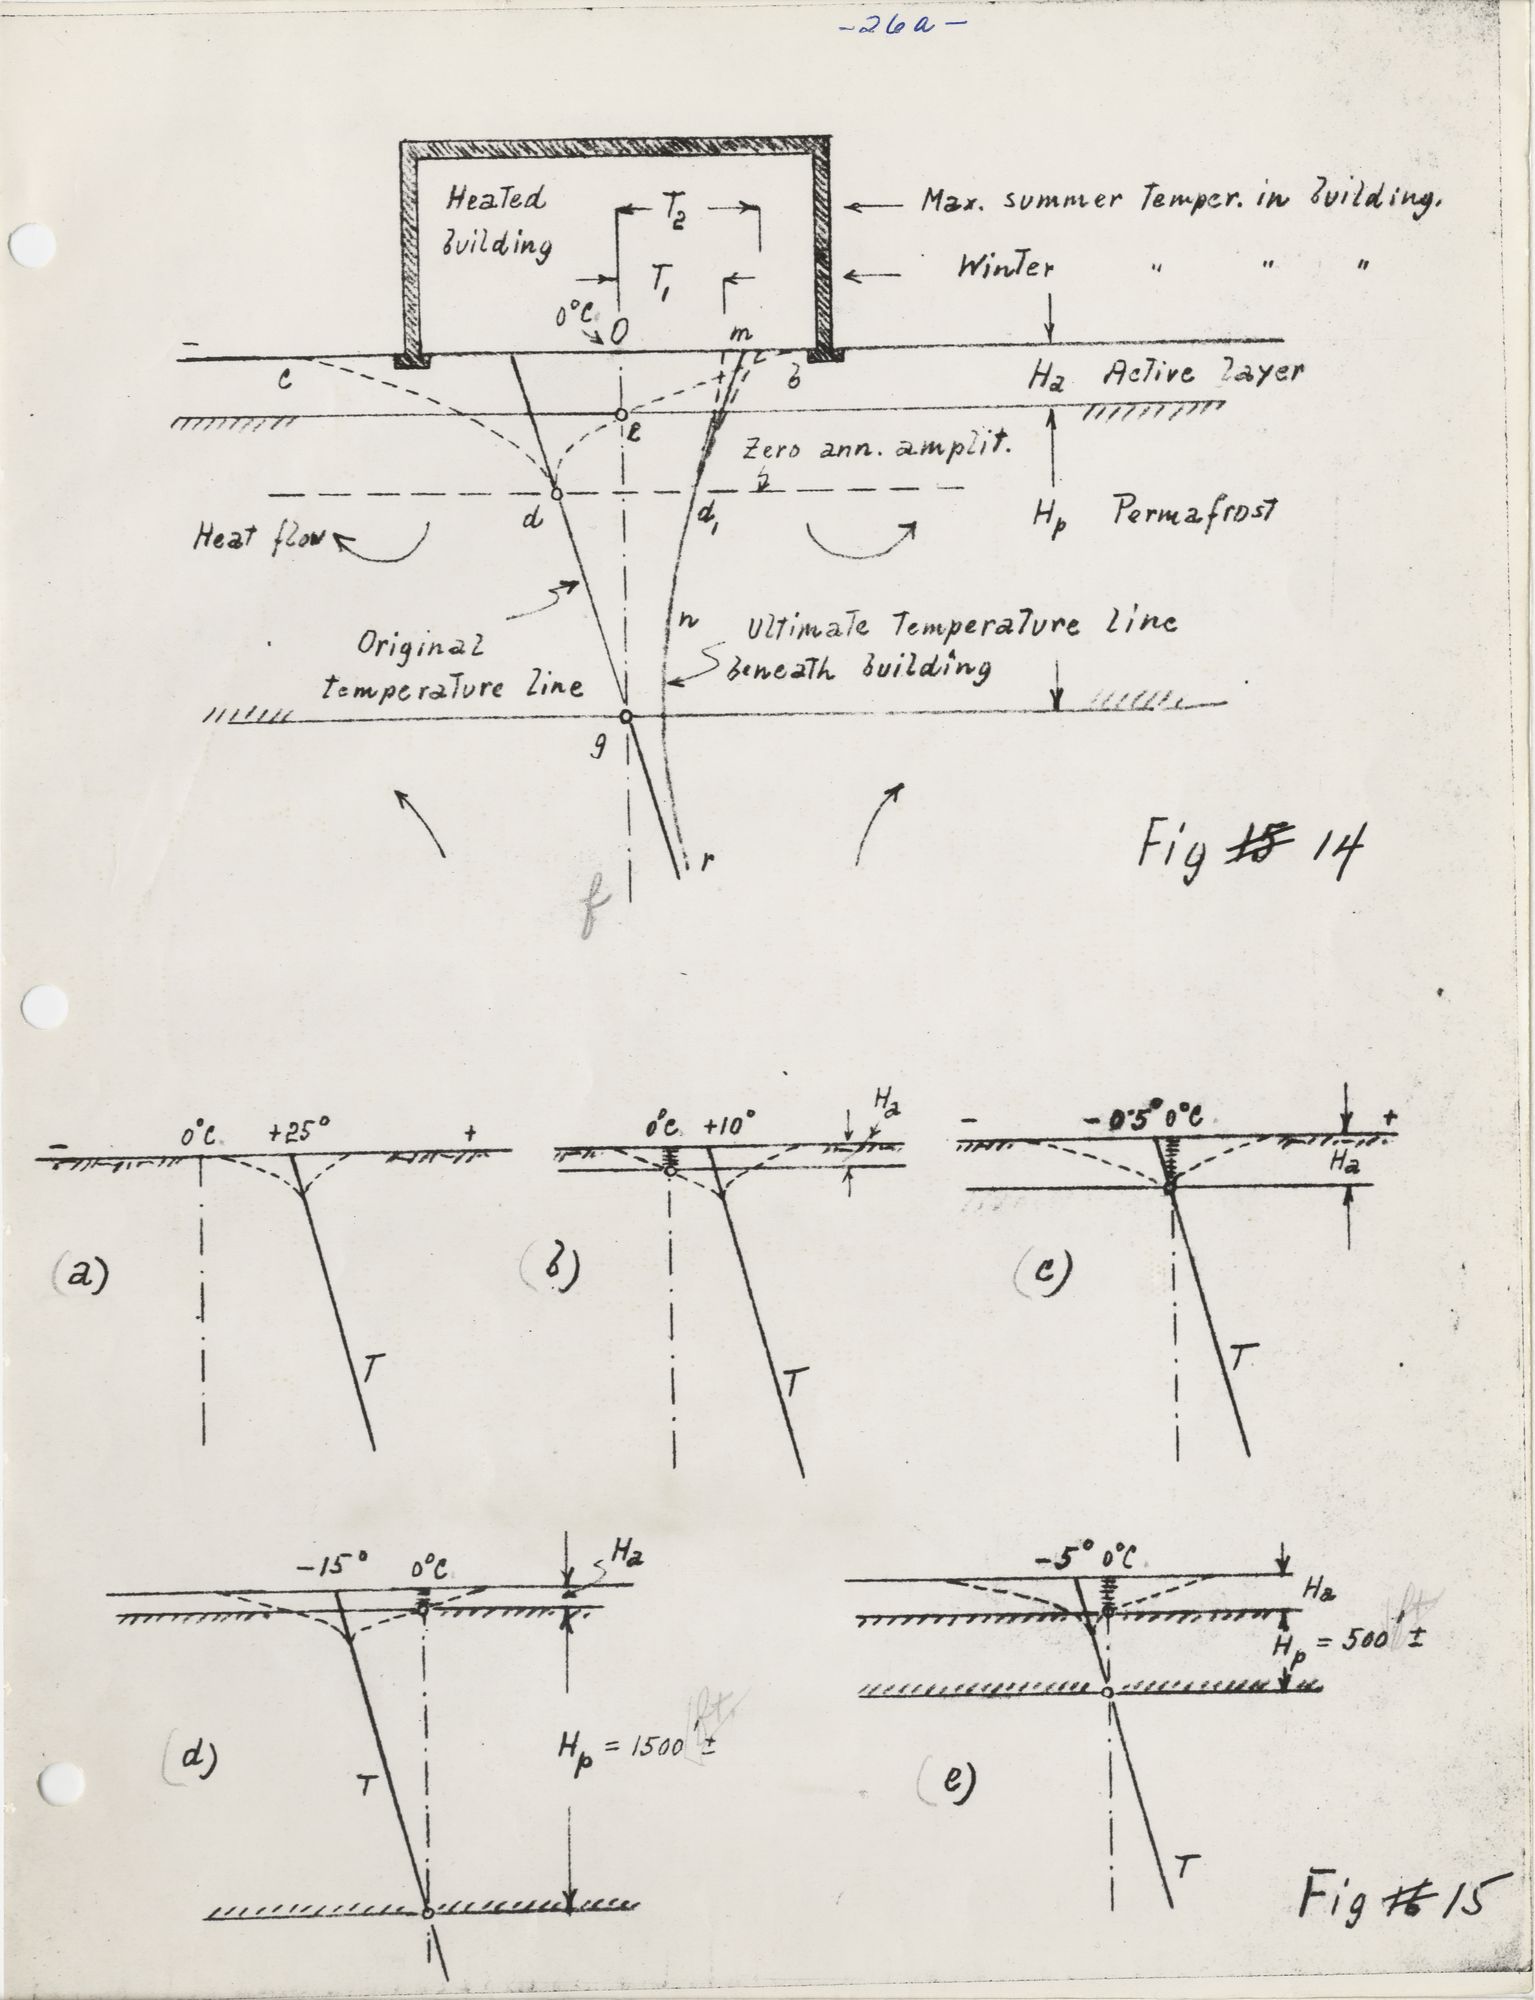
Figure 14: The effects of heating a building to a constant temperature on the subsoil beneath the building. Figure 15 [from the previous page]: The successive stages in the formation and subsequent degradation of permafrost are illustrated by Figure 15.
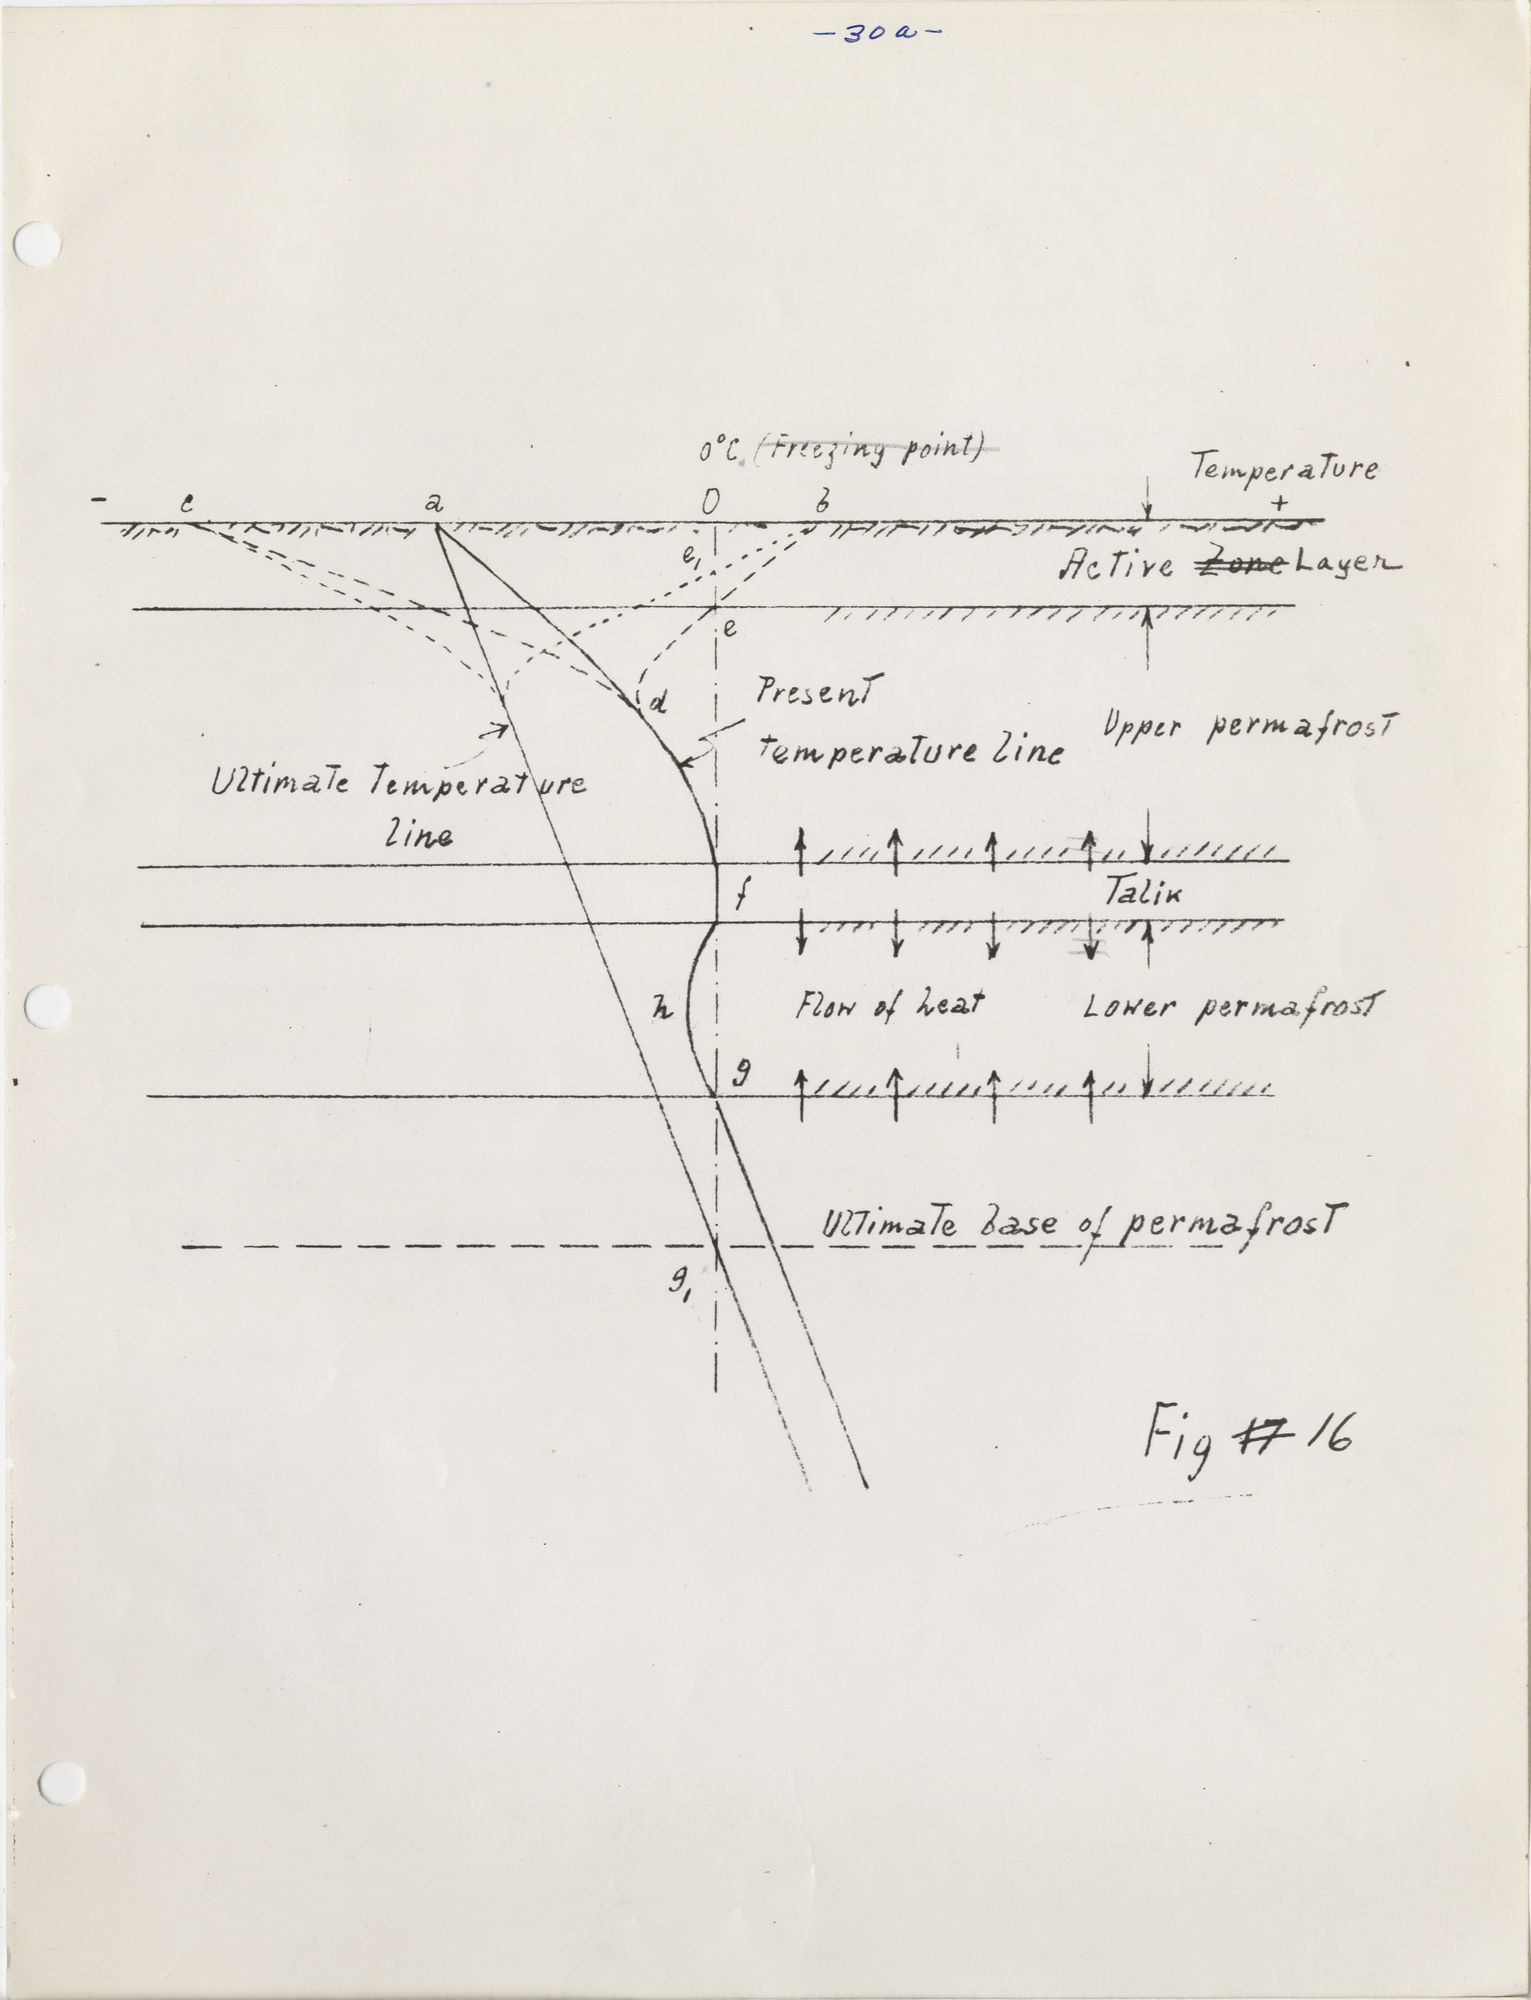
[From the previous page:] Figure 16 shows the temperature conditions which prevail in a two-layer sheet of permafrost.

Figure illustrating different soil types
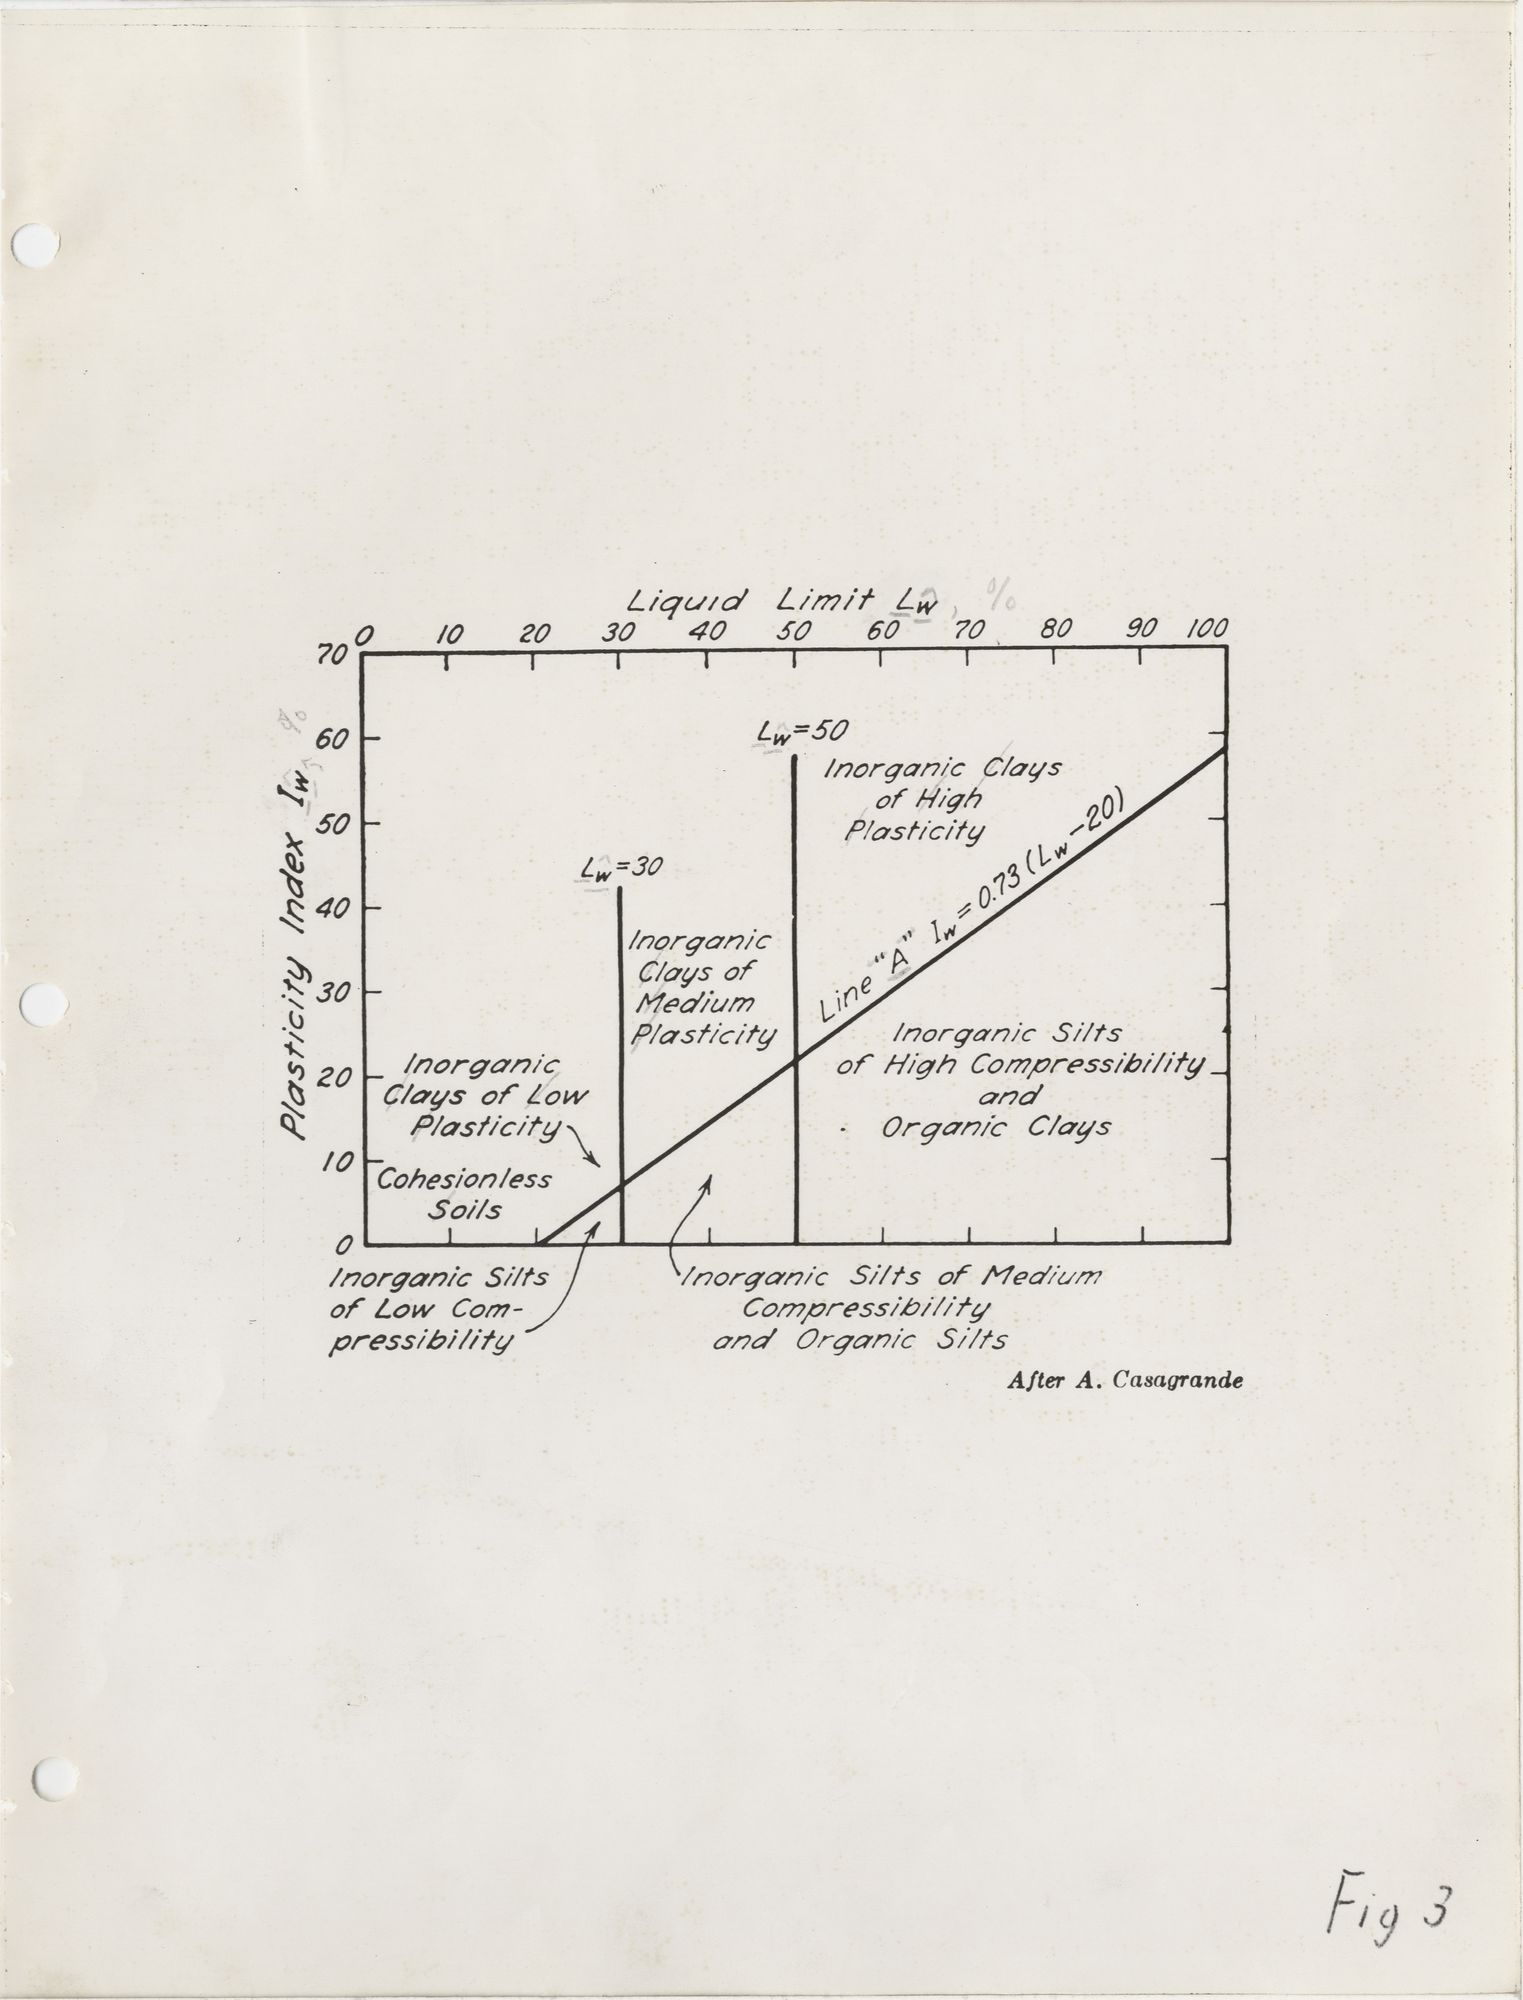
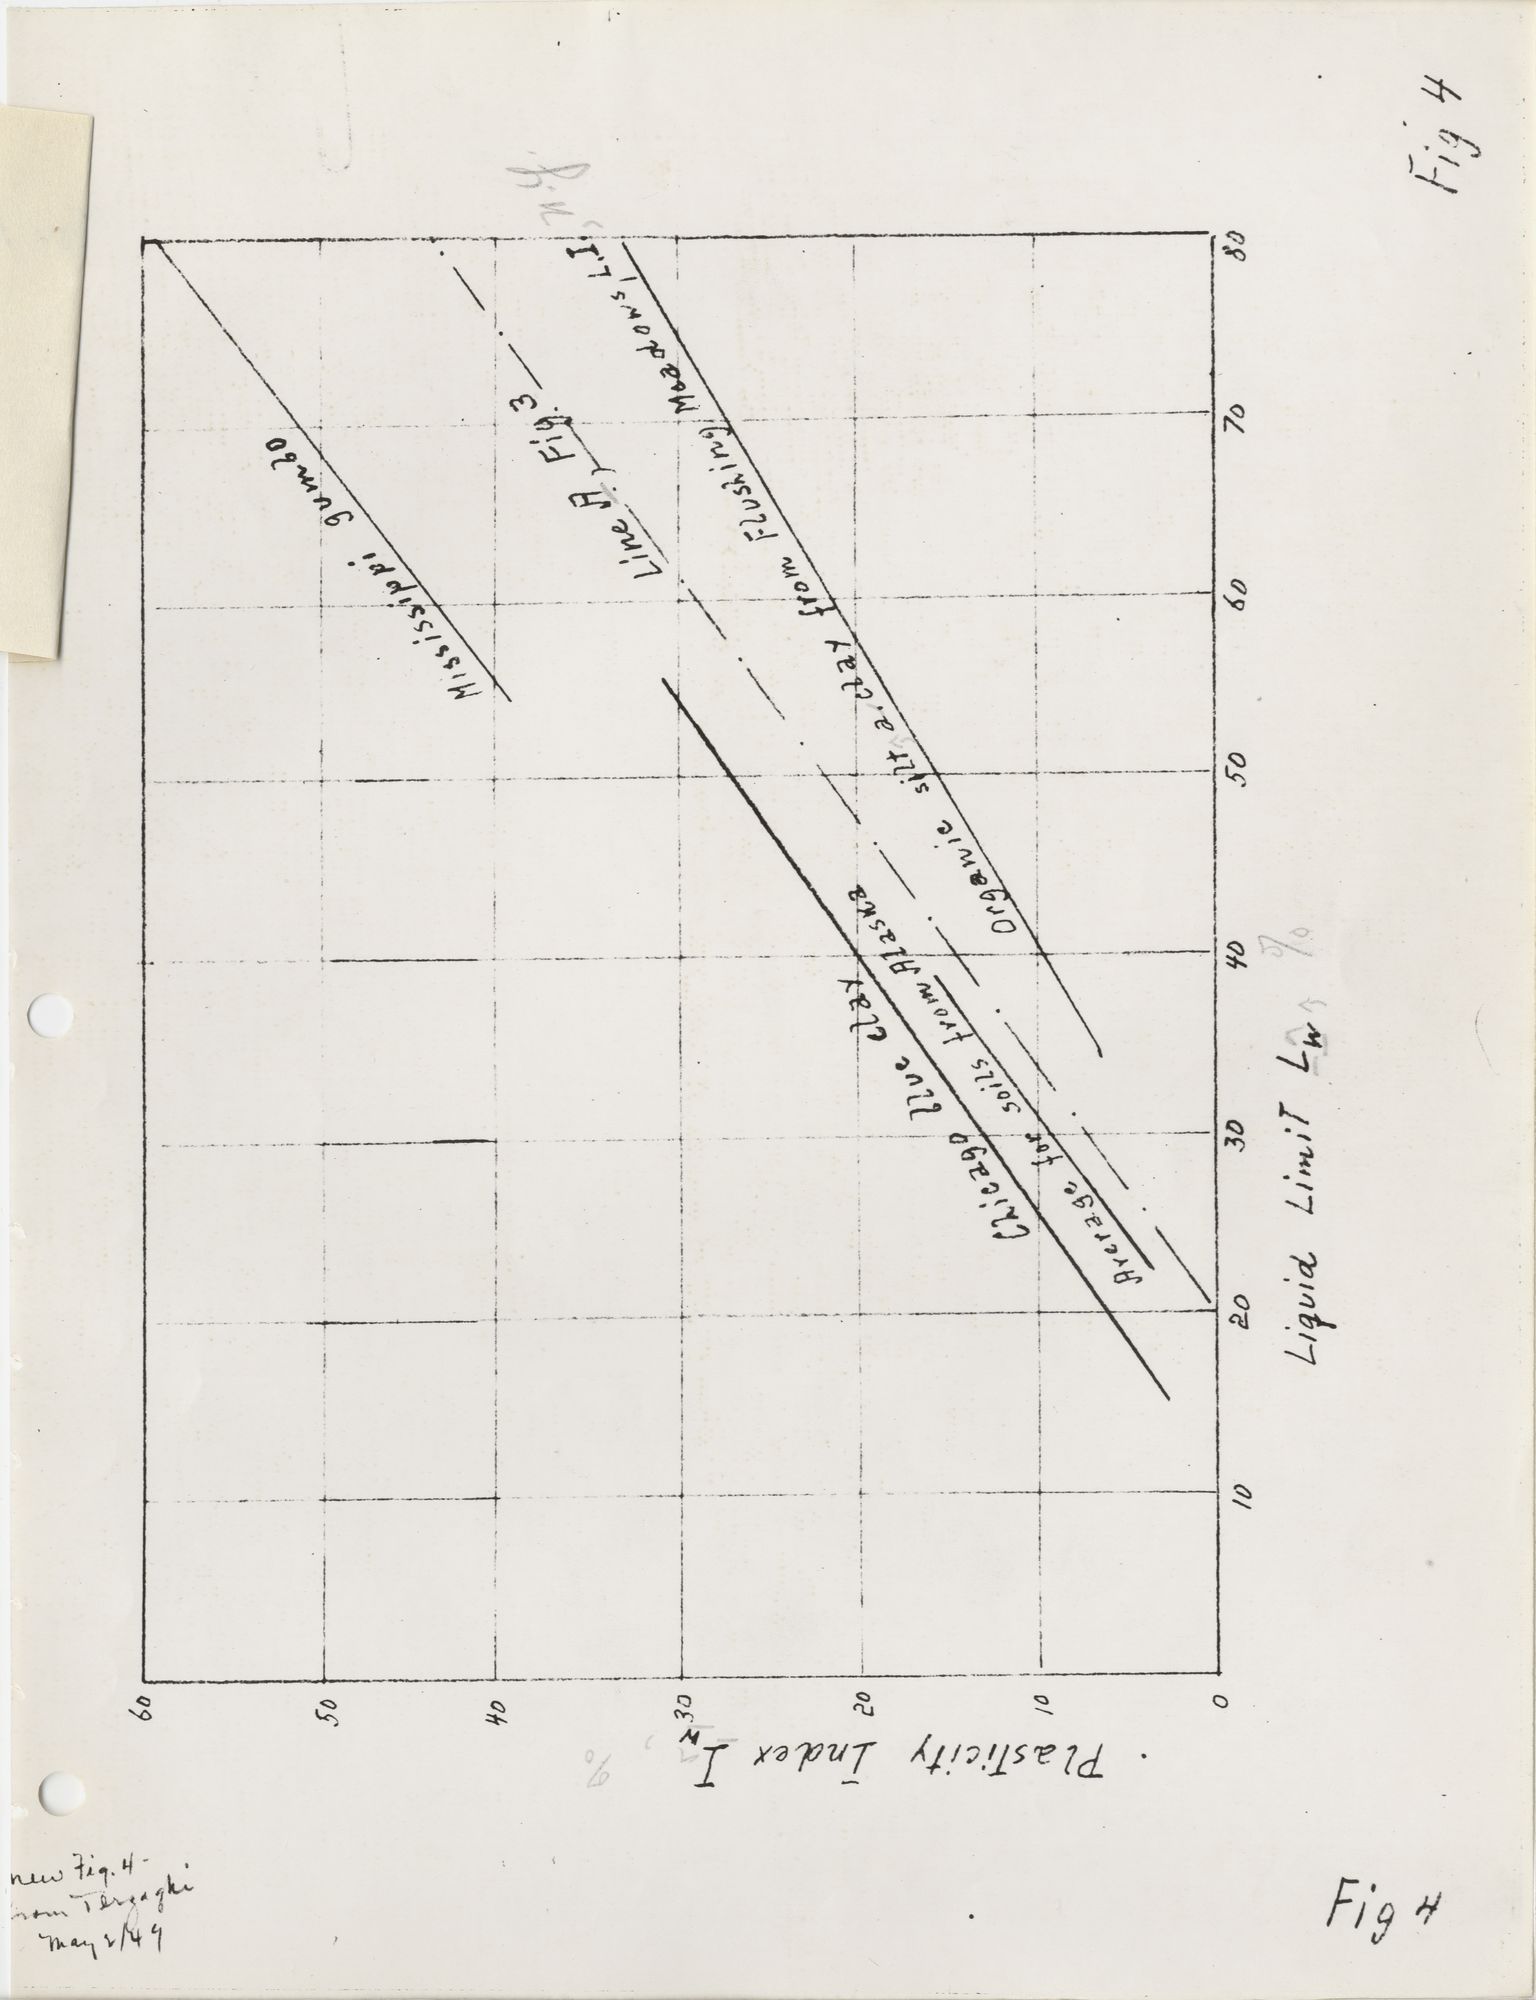
Plasticity chart for soils
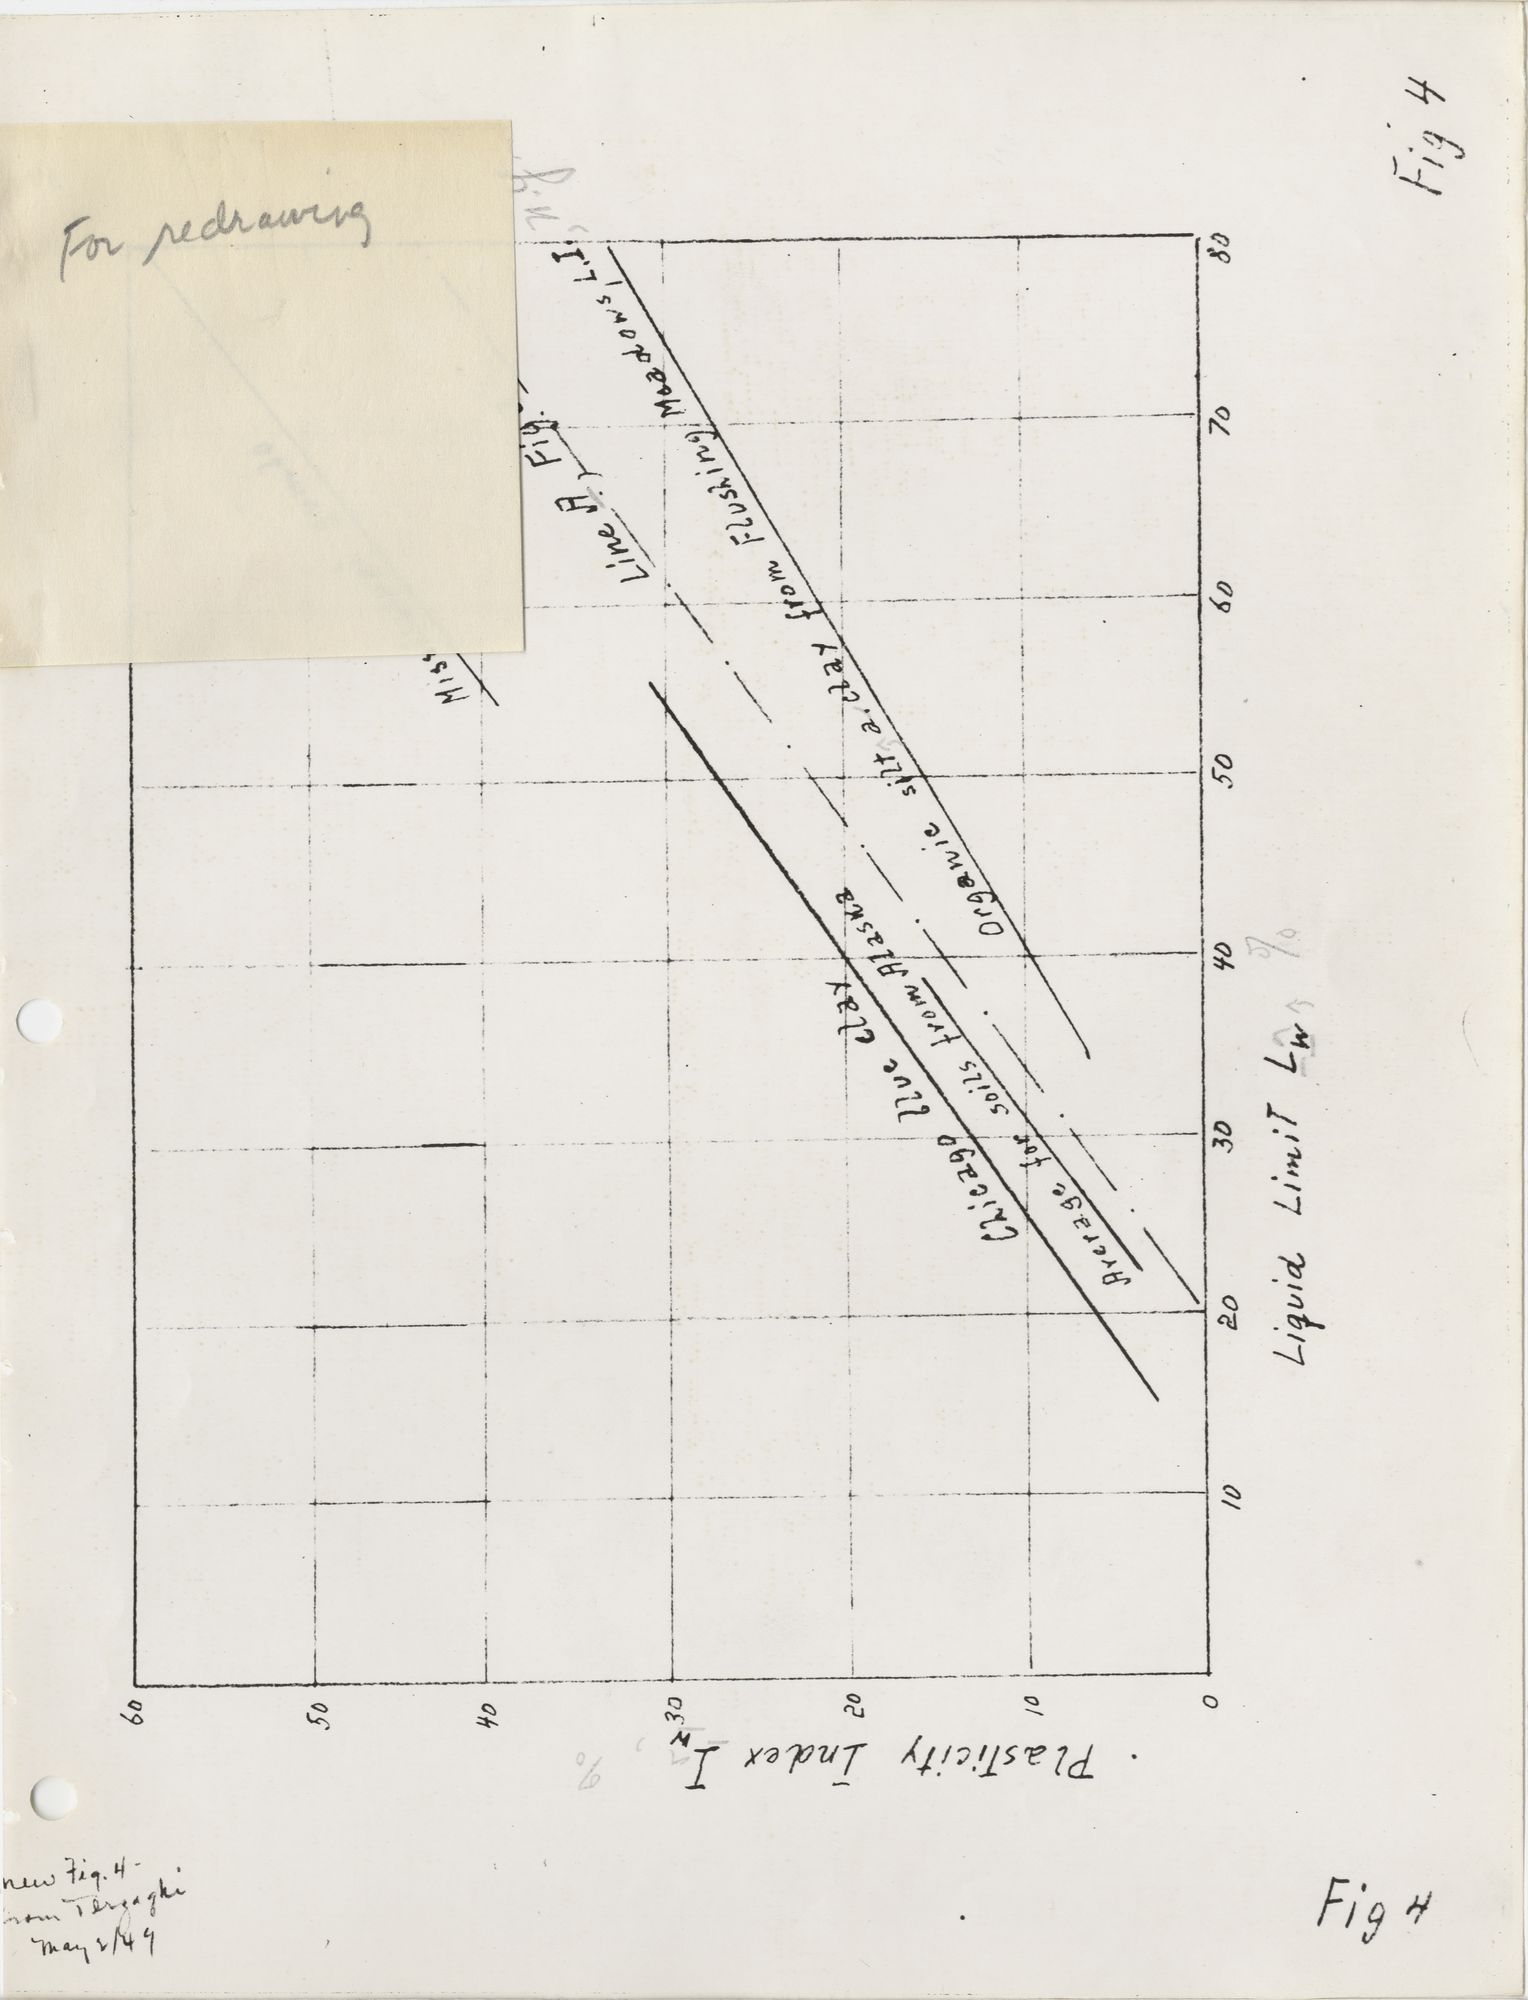
Liquid limit versus plasticity index for a variety of soils
Effective grainsize versus degree of saturation in percent for several soil types

Effects of increasing the temperature in figure 8
Temperature distribution in homogenous ground after surface tempearture has been raised
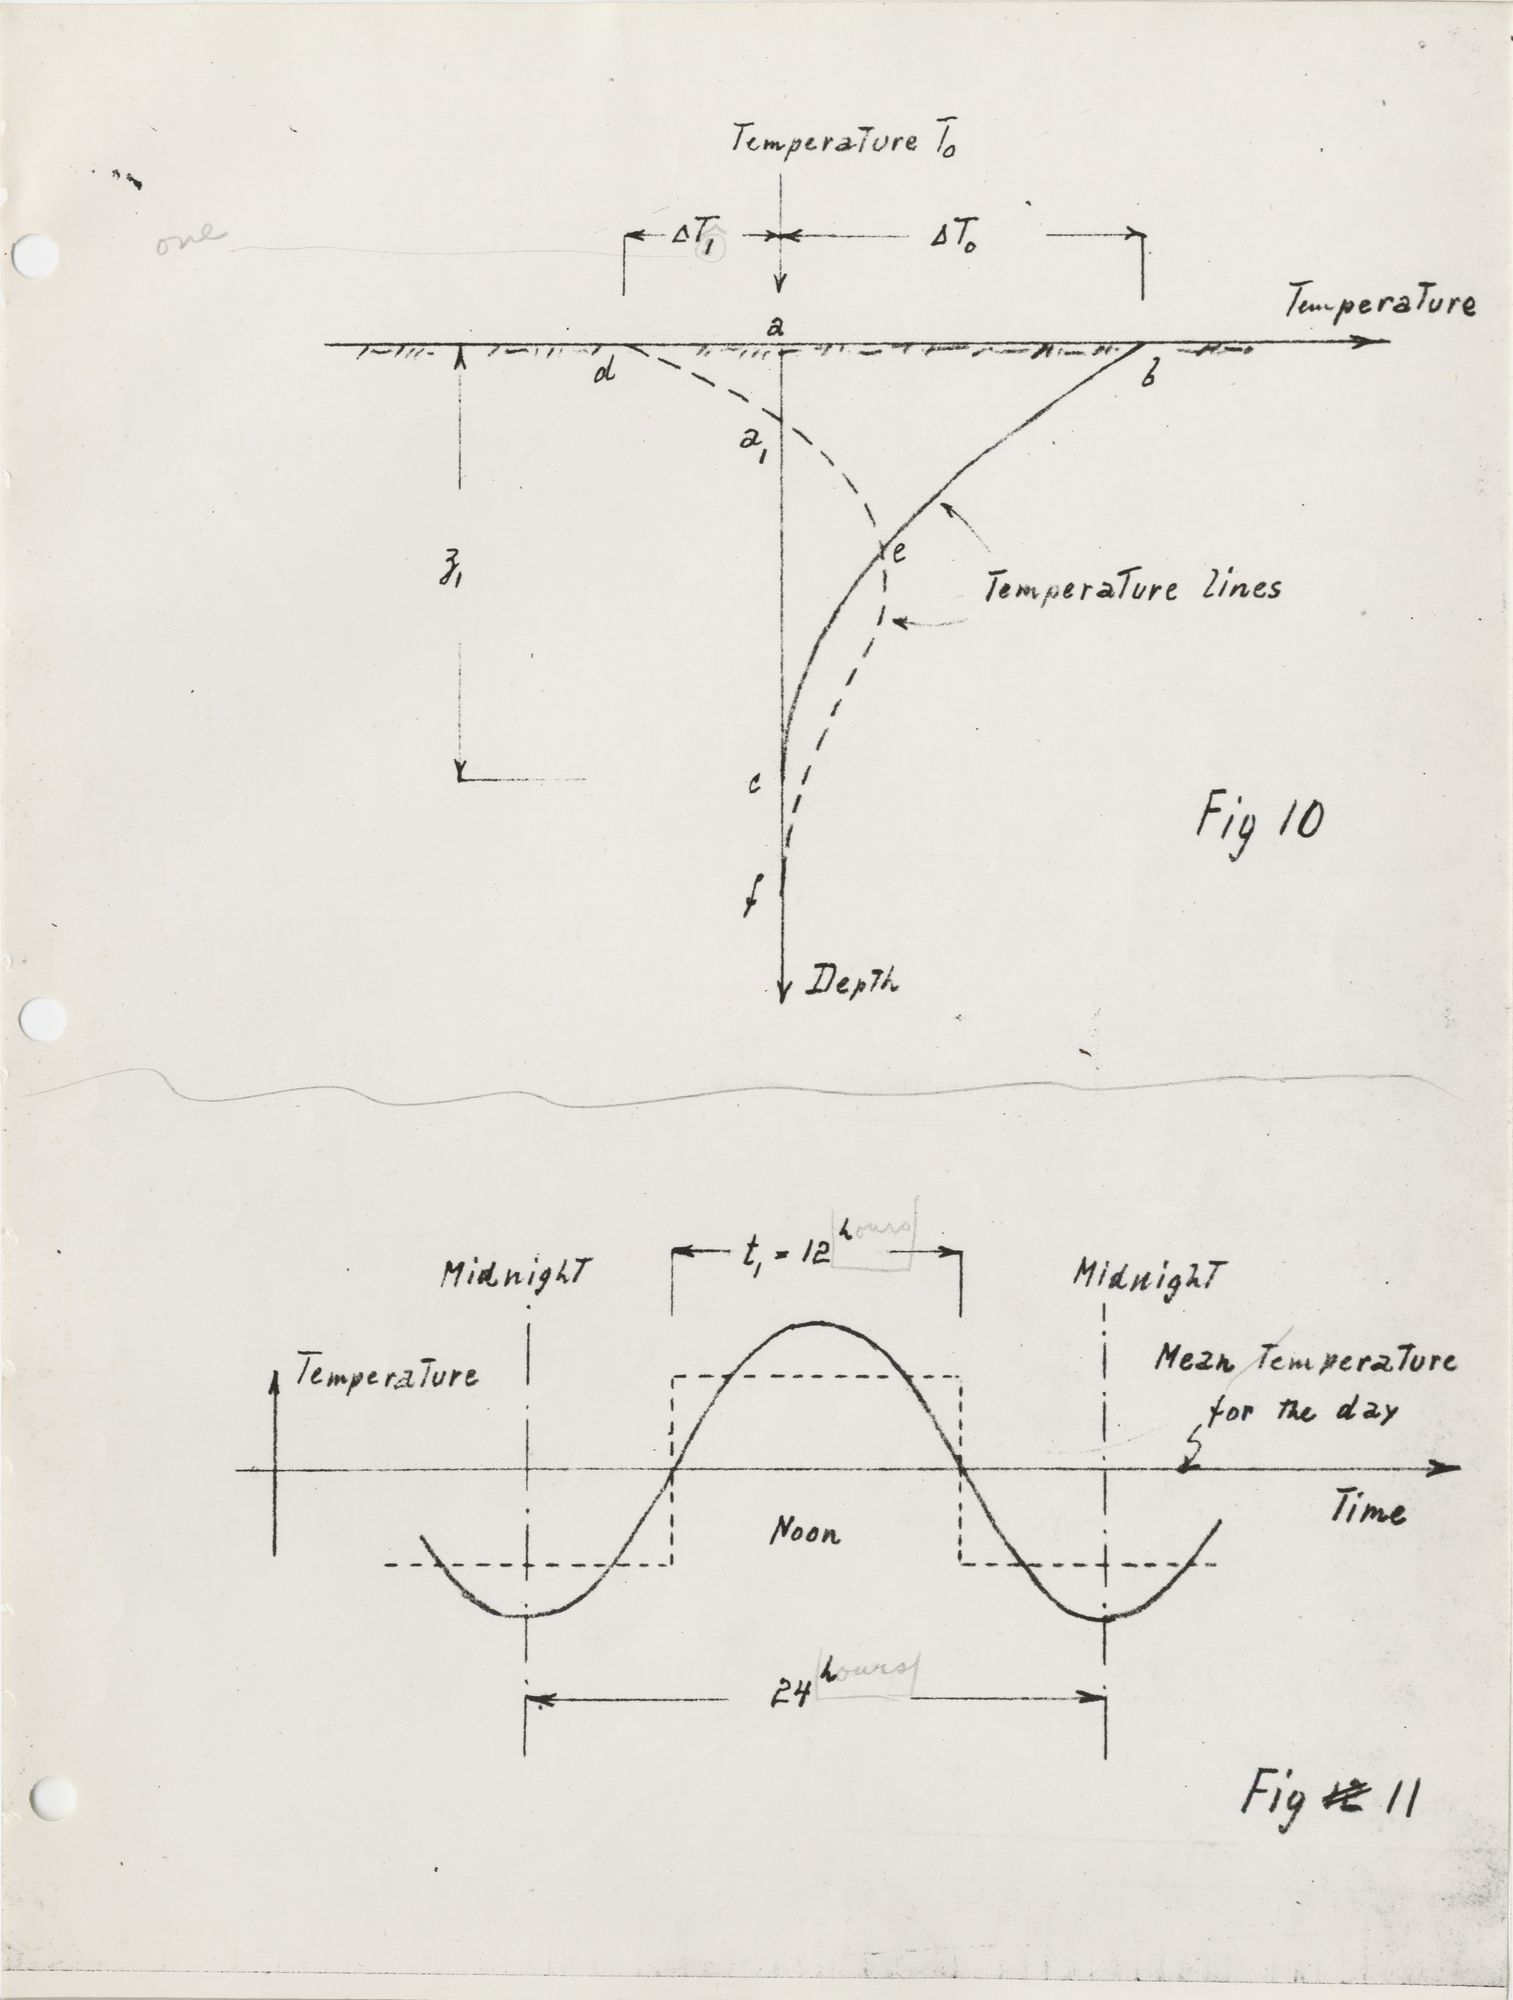
[From the text:] Figure 11 shows the diurnal variations of the surface temperature.
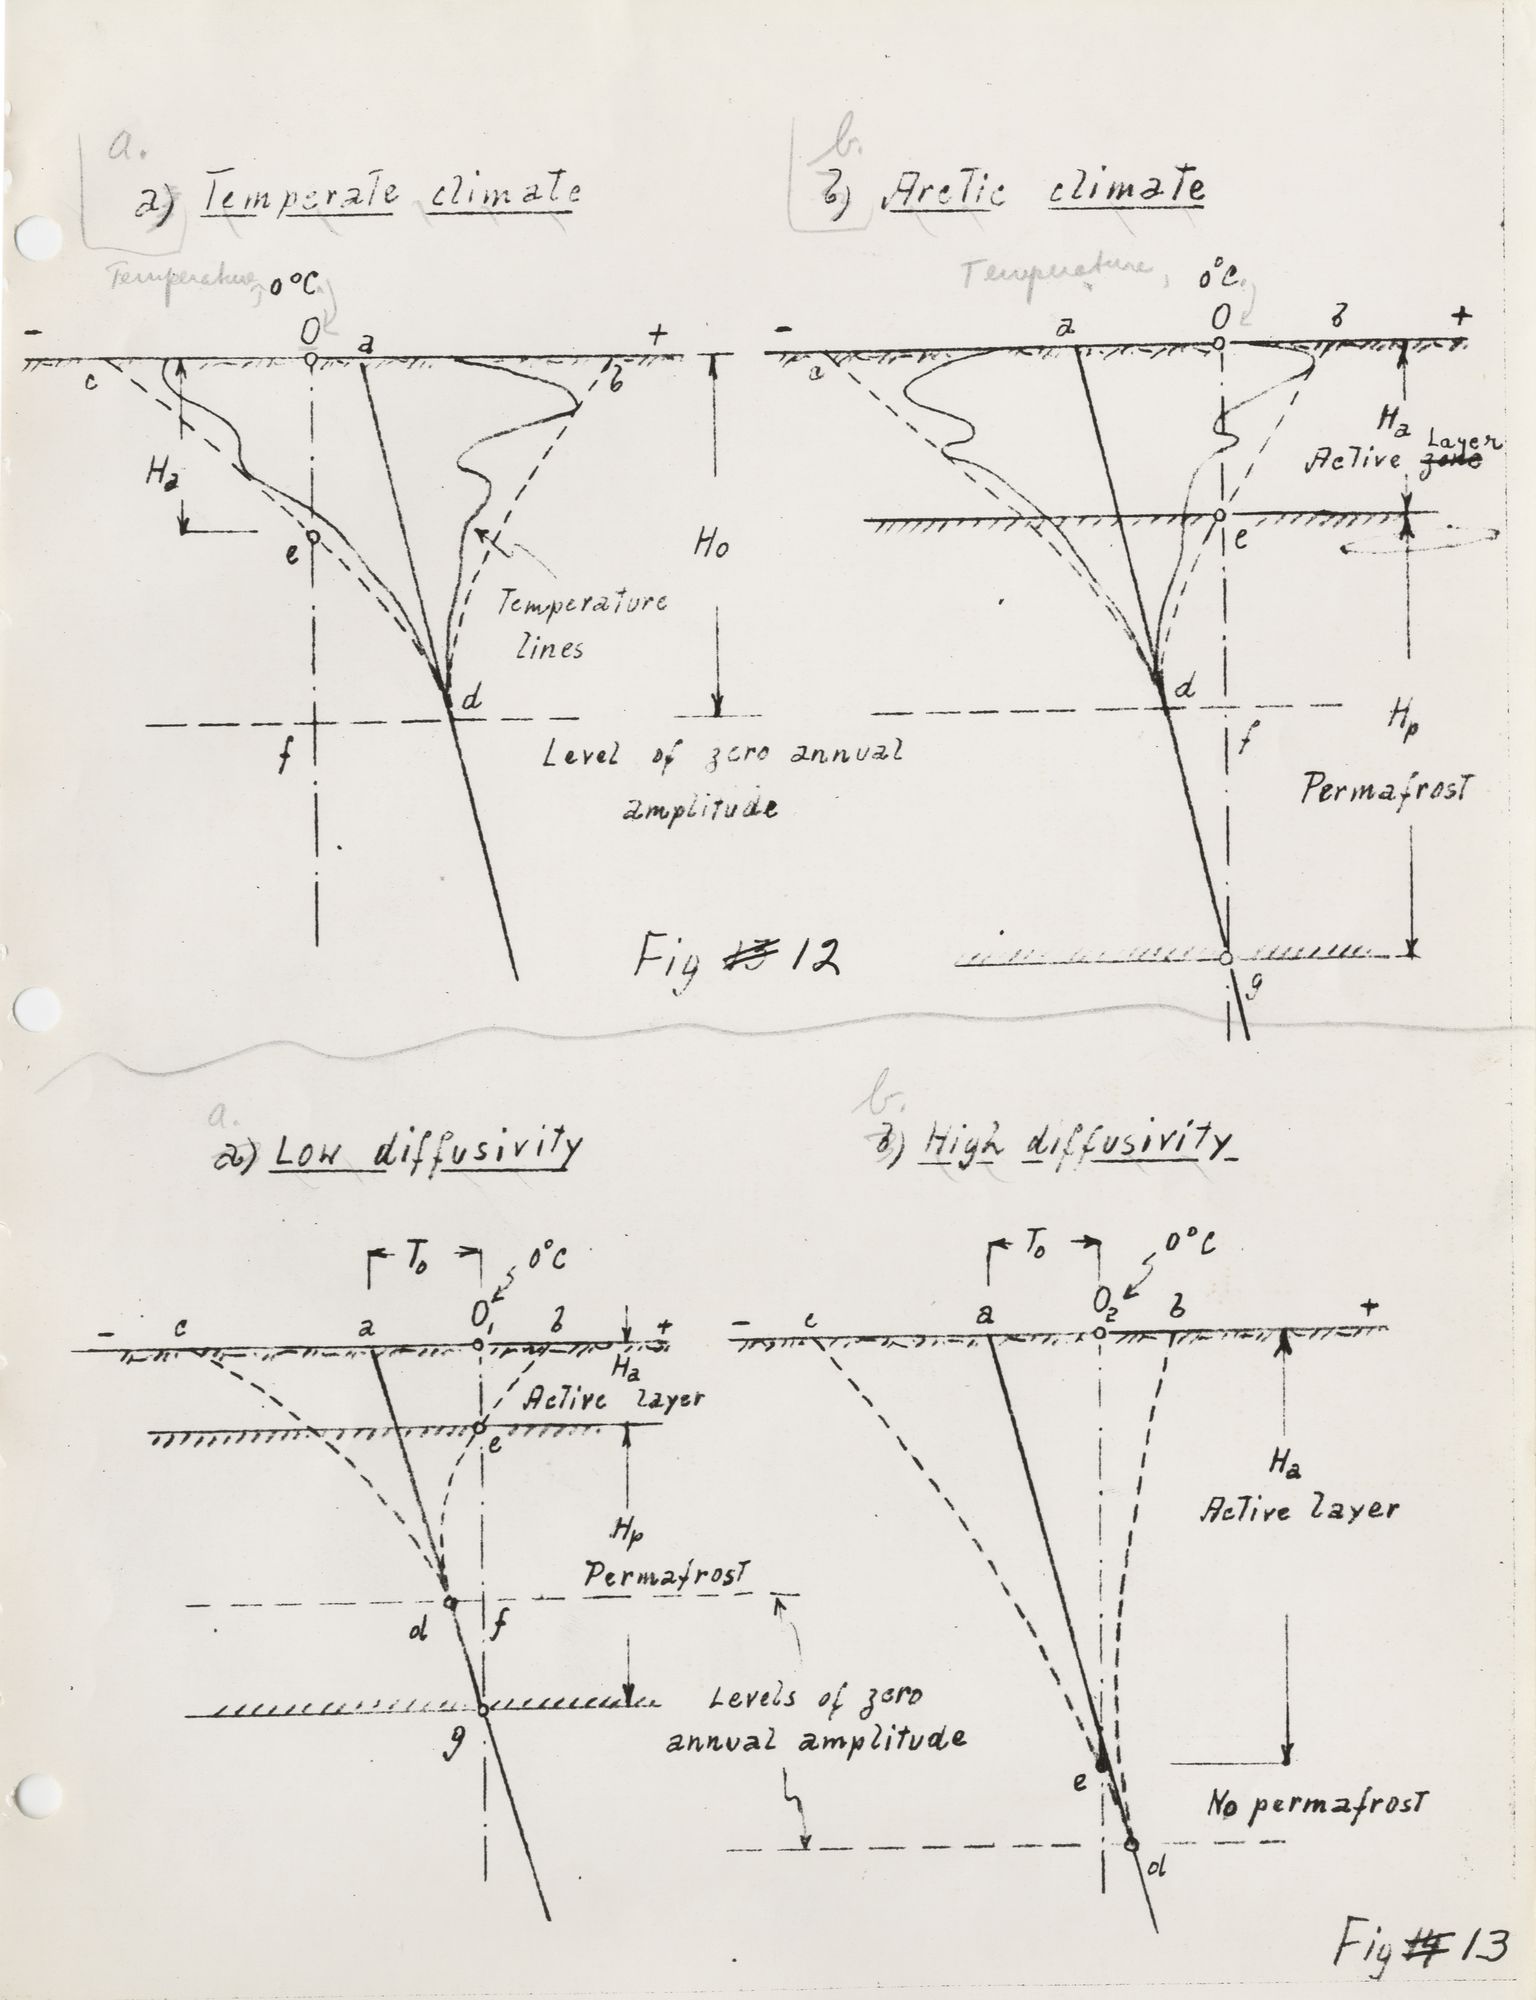
[From the text:] Figure 12a represents the temperature conditions in the subsoil of a region with a temperate climate and Figure 12b refers to a similar region with an arctic climate.
Effects of variations in heat diffusivity of the top layer of the ground

[From the text:] Figure 17 represents three cylindrical specimens of a fine saturated silt. Specimen (A) rest on a solid base, whereas the lower ends of specimens (B) and (C) are immersed in water. The temperature of the upper end of each specimen is kept below the freezing point. [See the text for a detailed description of the effects on each of these specimens.]
Soil Mechanics in Permafrost Regions
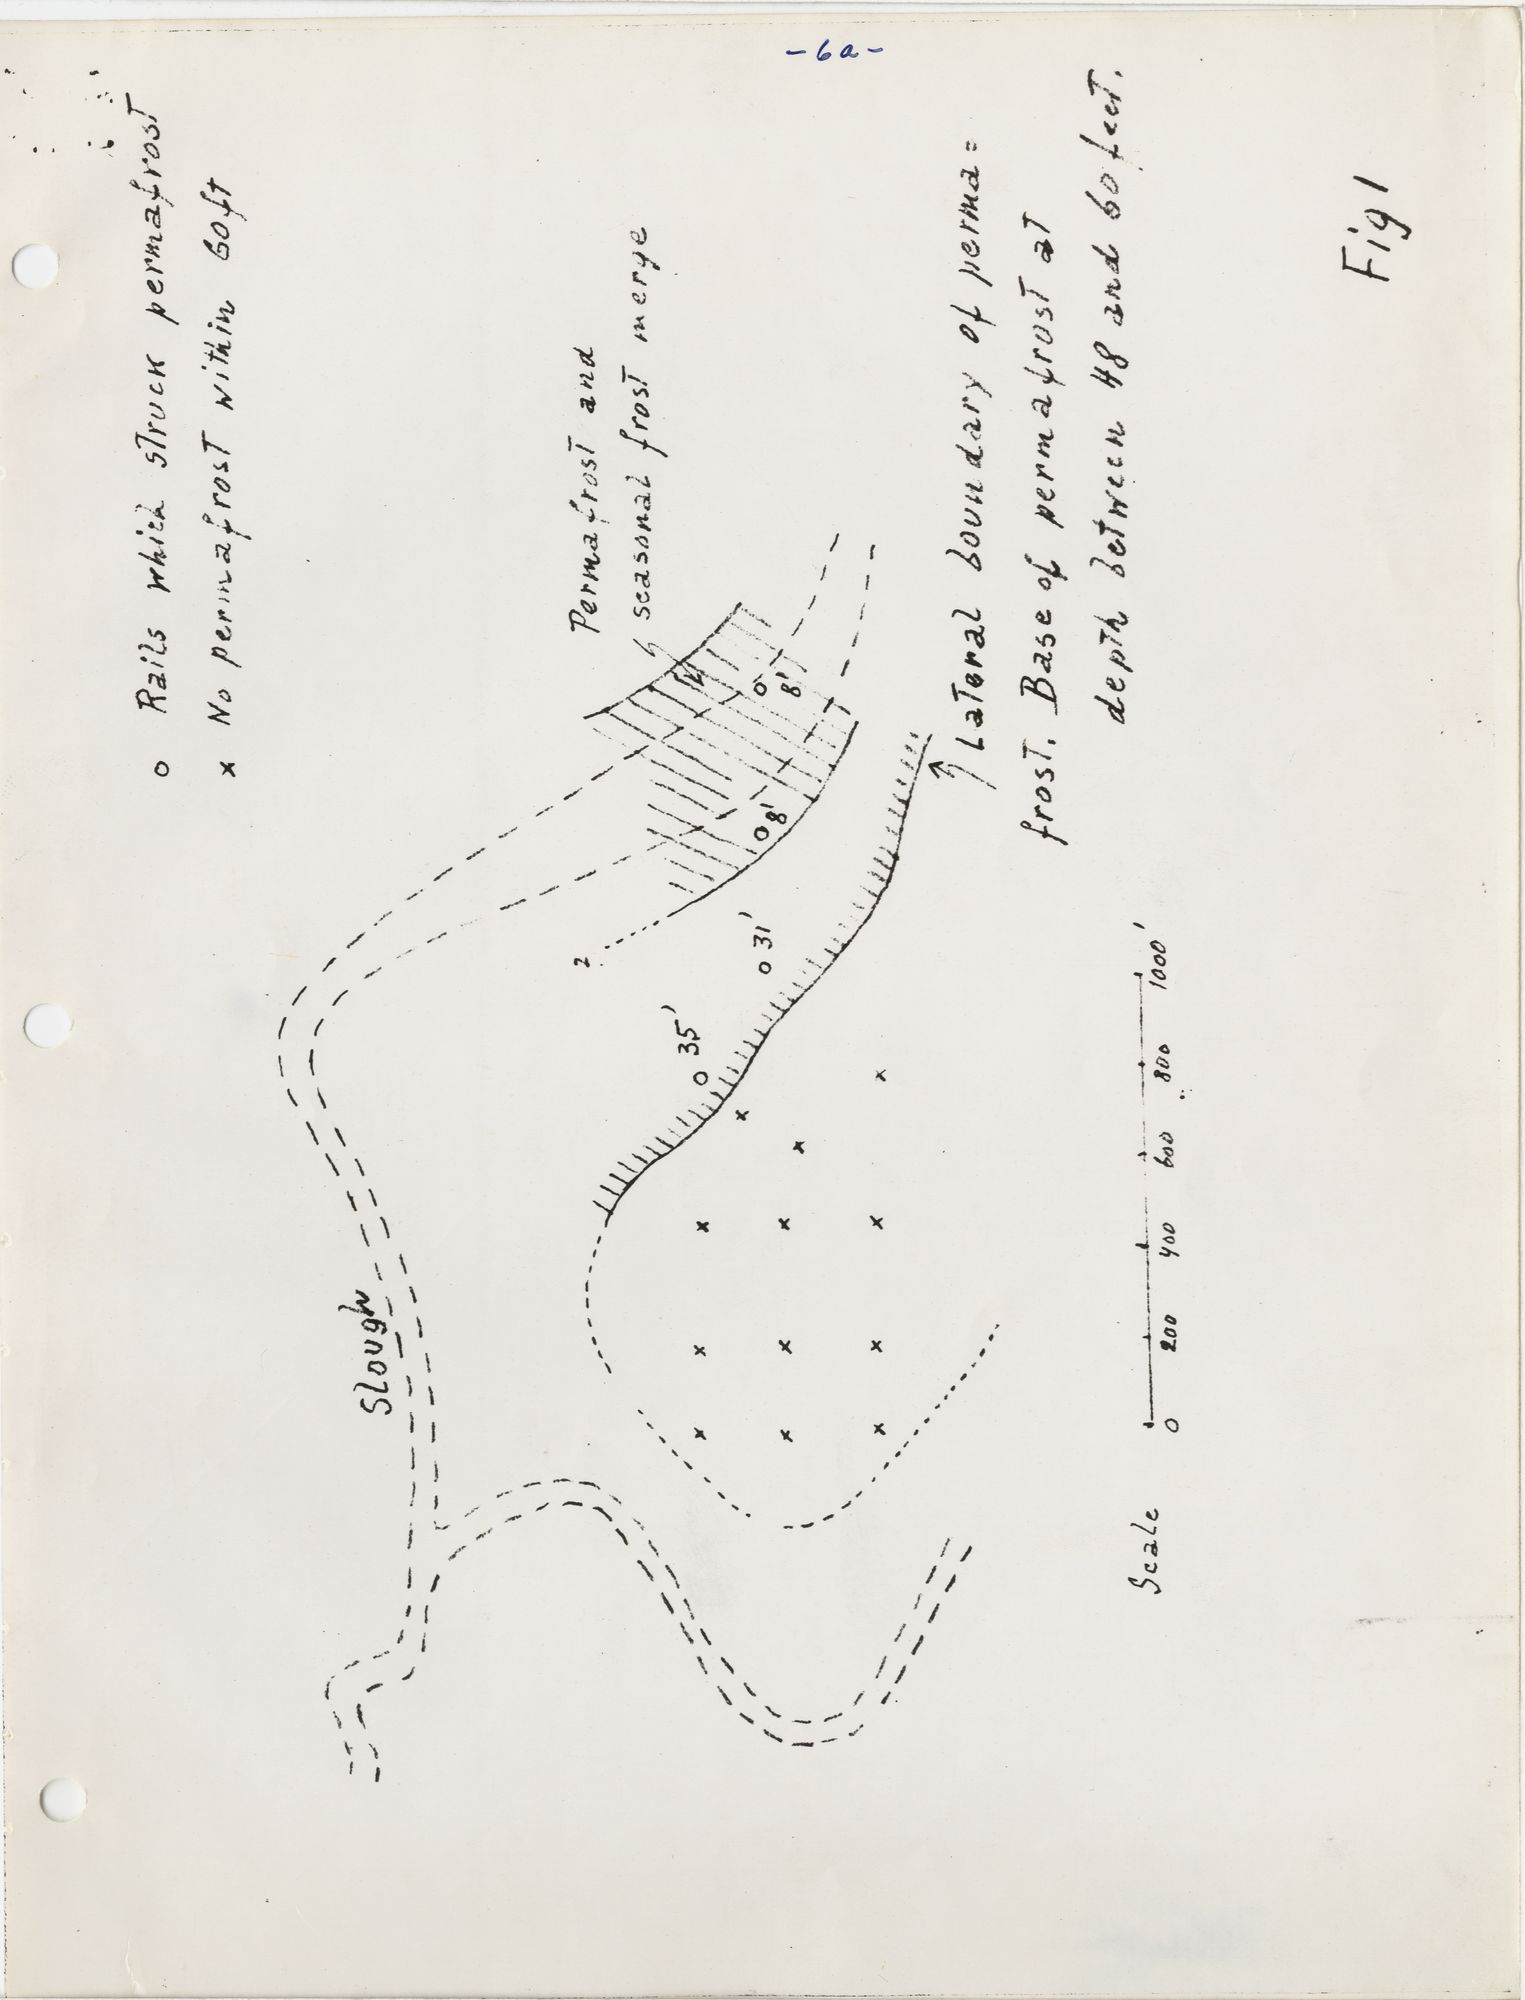
First diagram describing the results of driving steel rails into the ground to examine permafrost
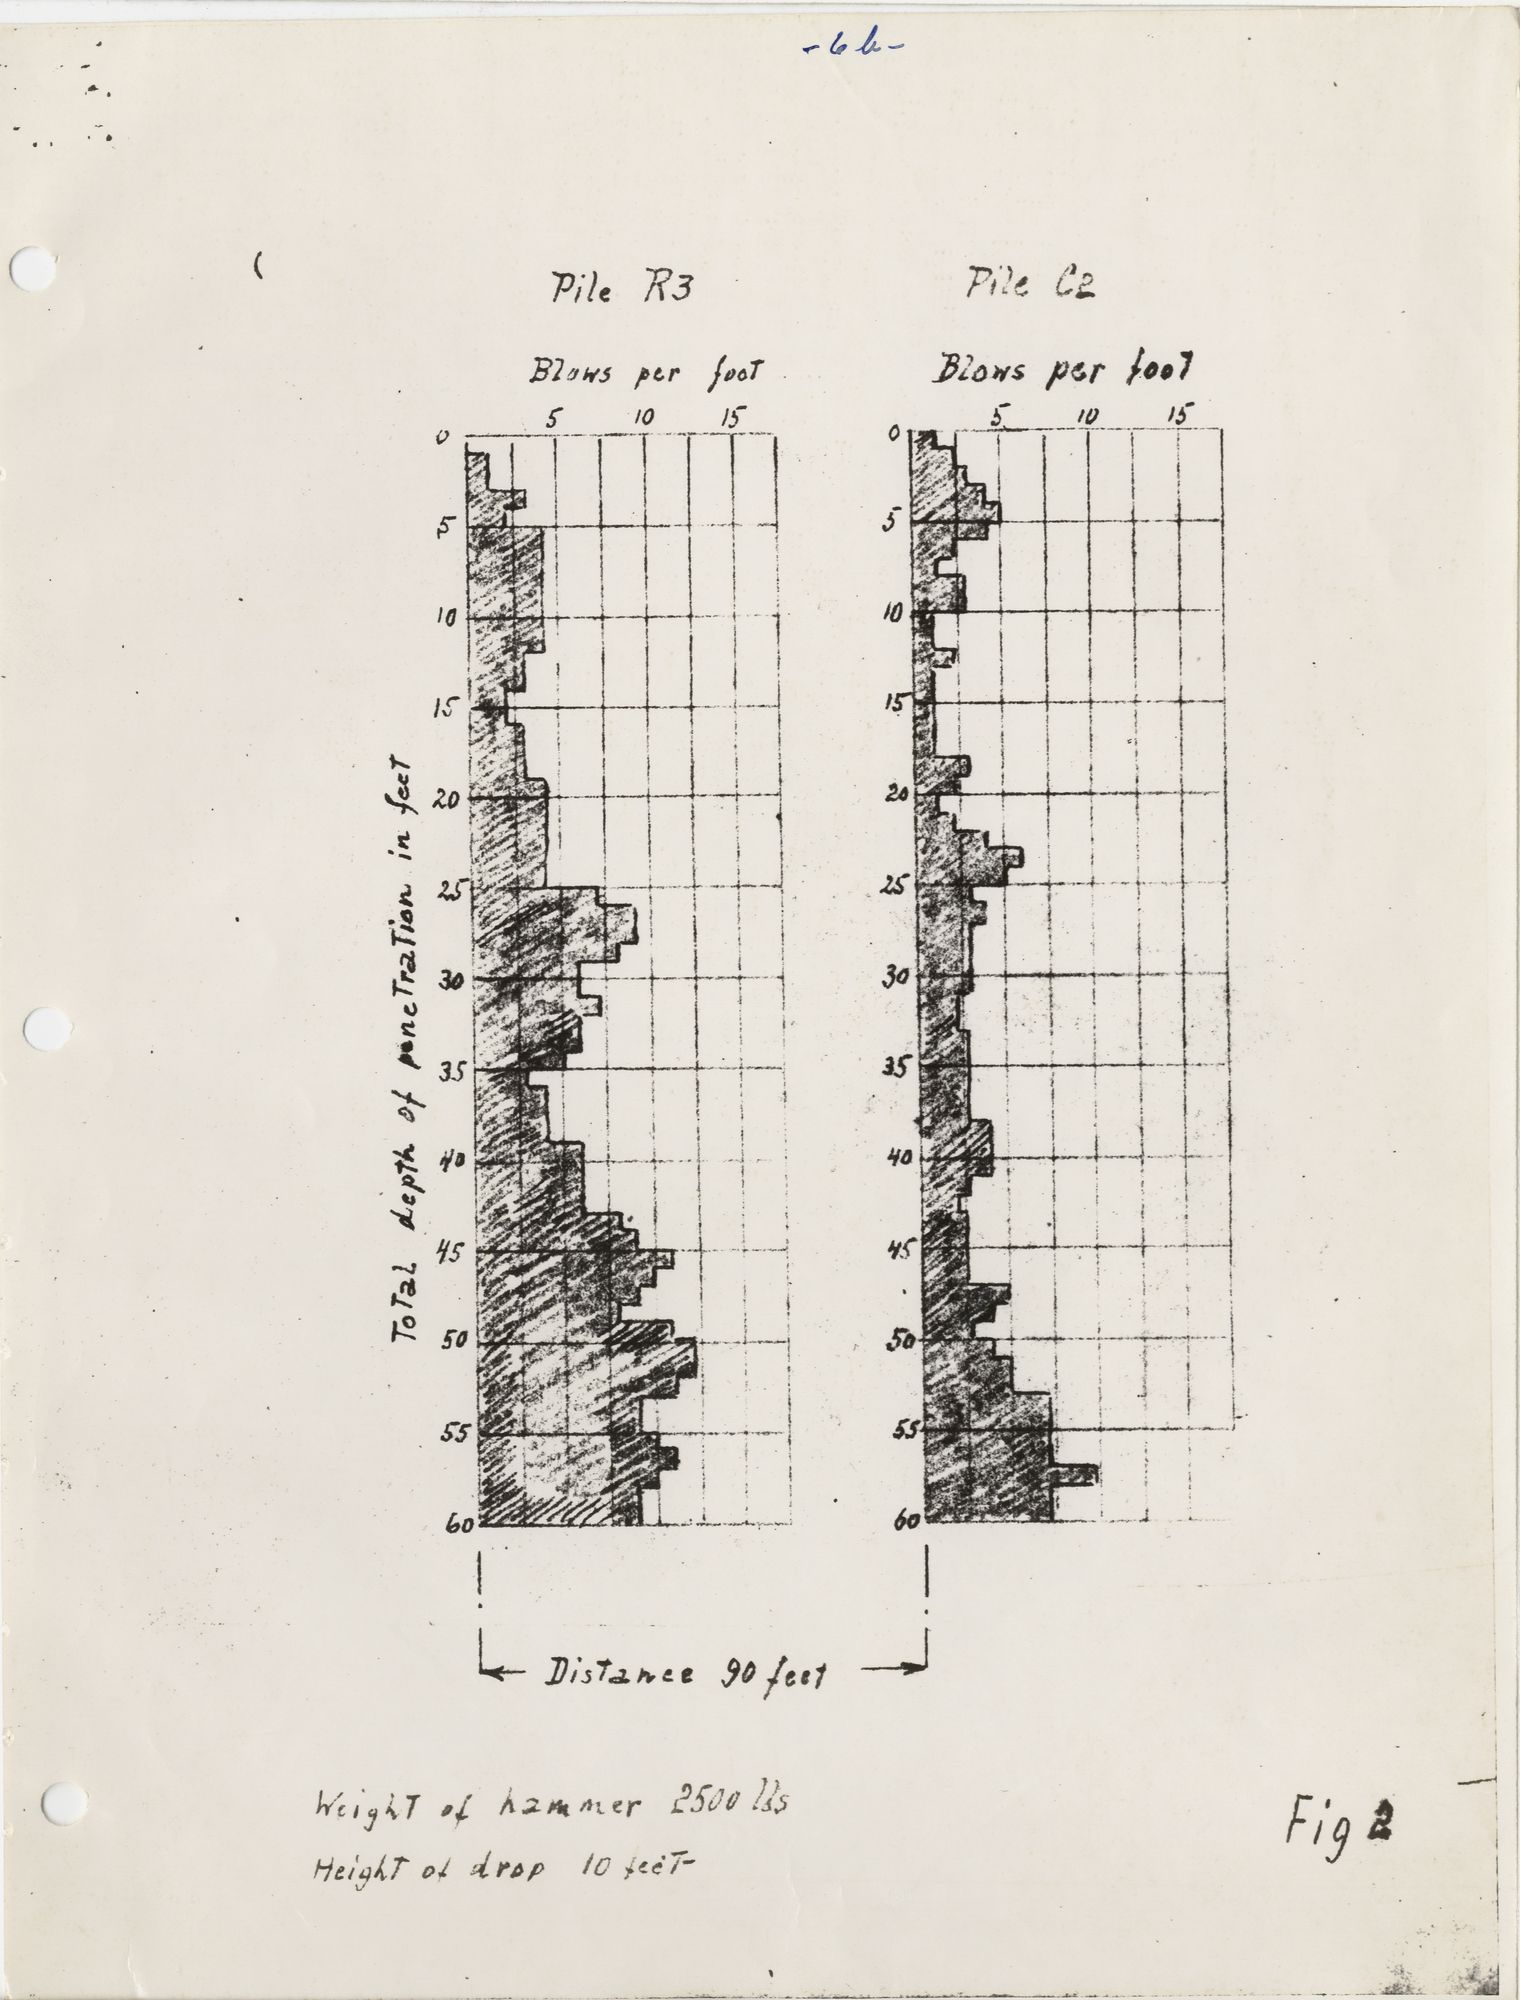
Second diagram describing the results of driving steel rails into the ground to examine permafrost
Natural Cold Storage
Newspaper clipping.
Work Feasibility
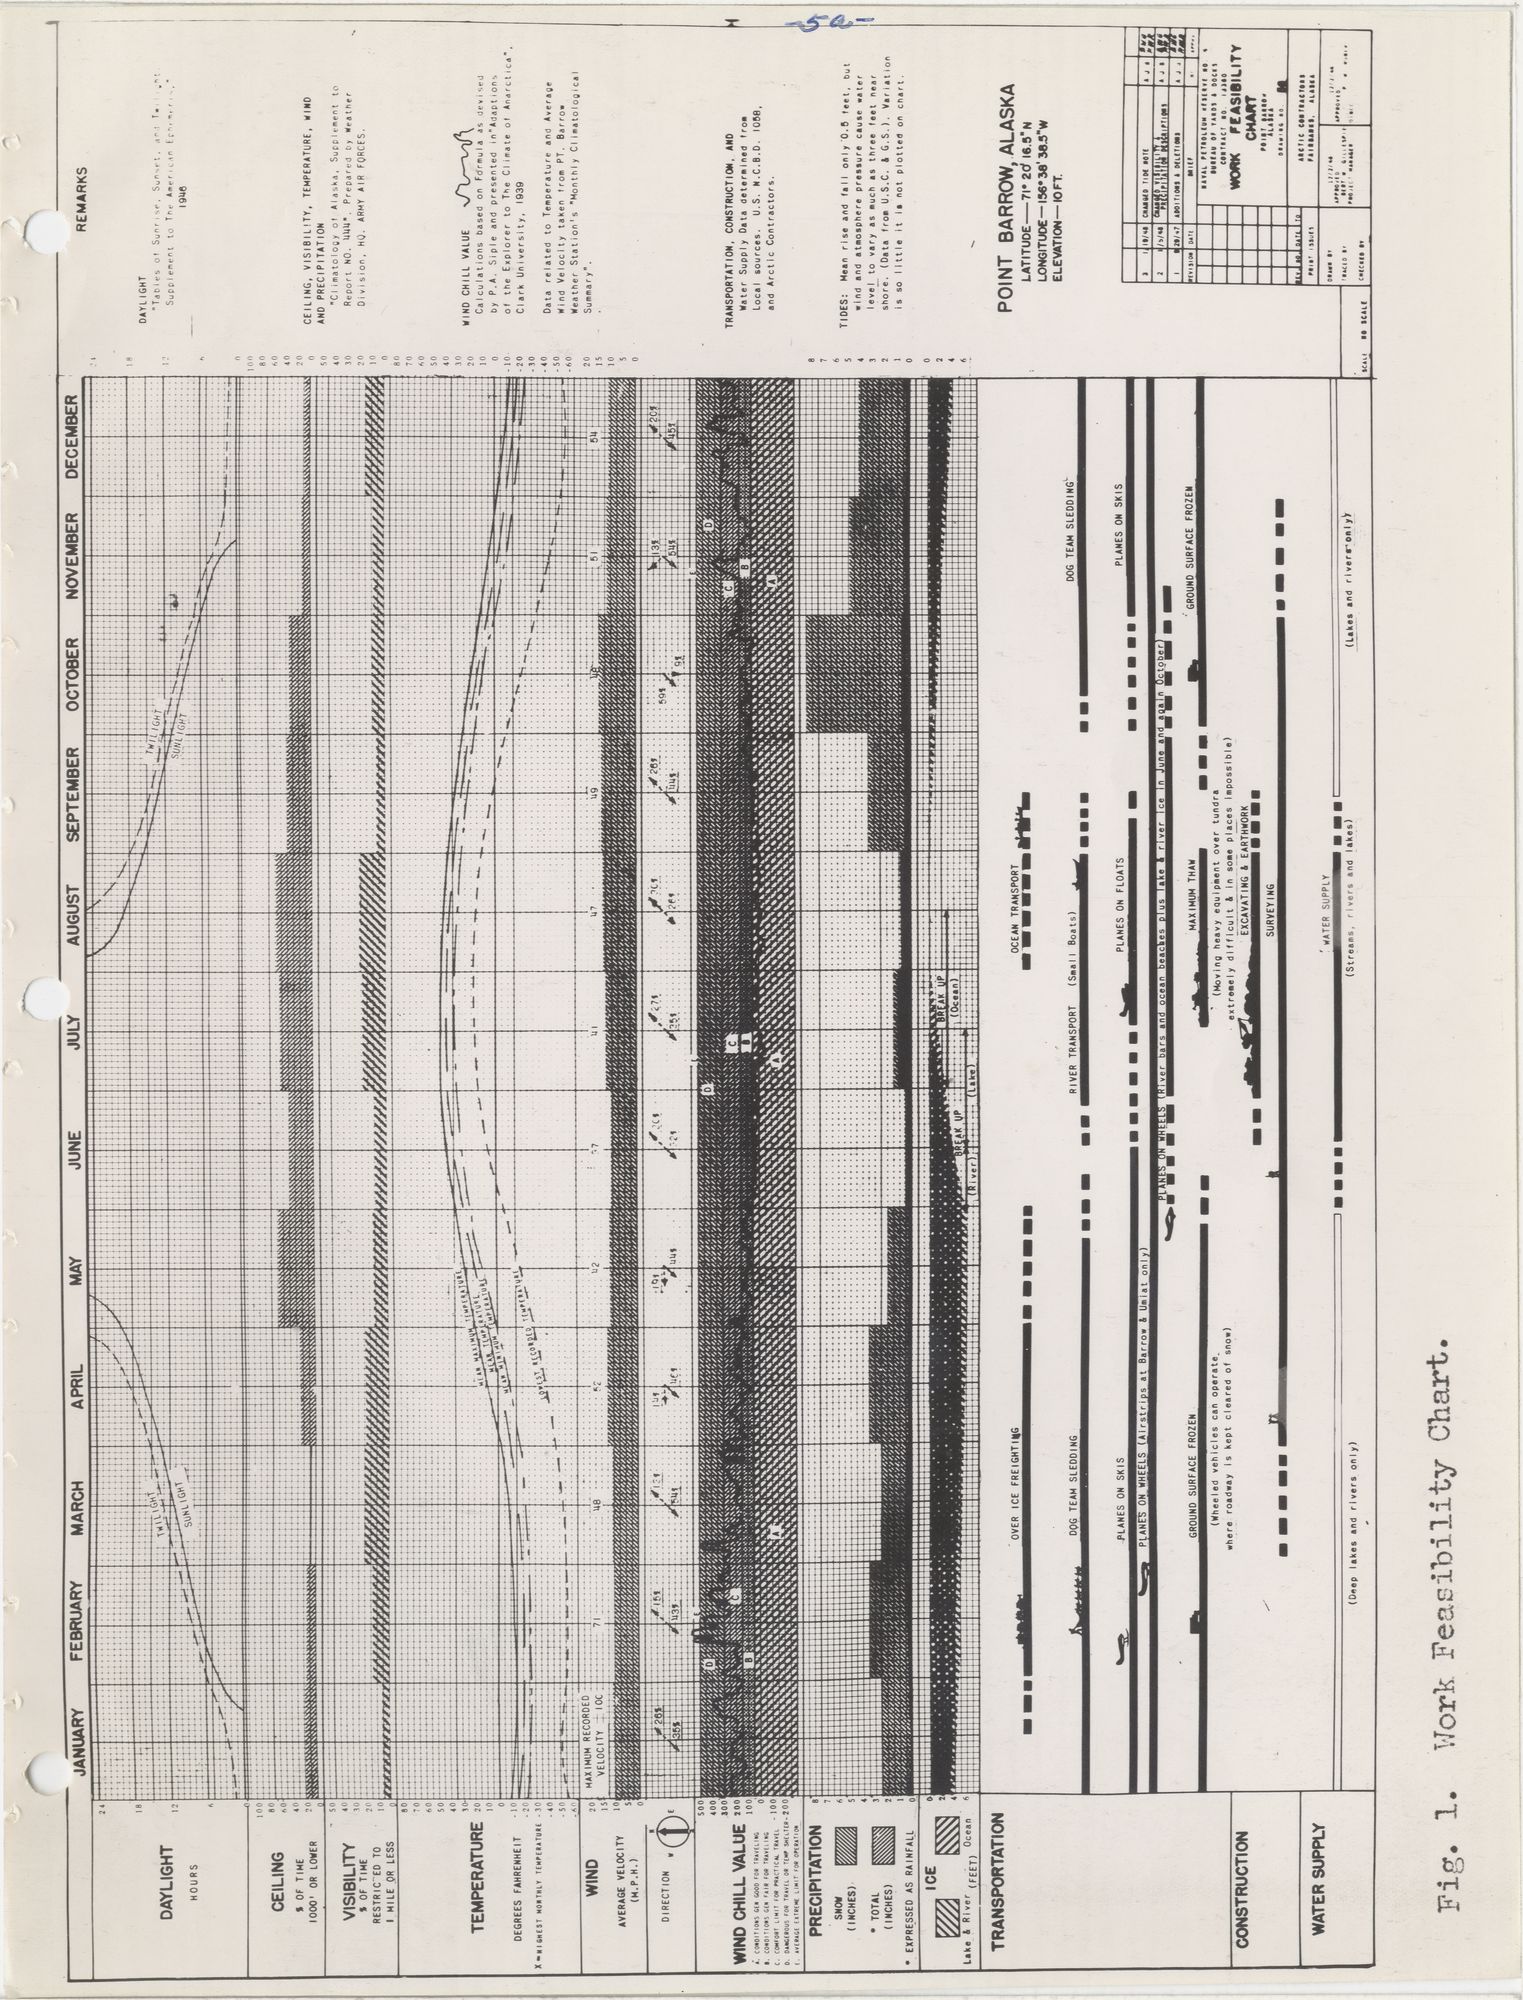
Work Feasibility Chart.
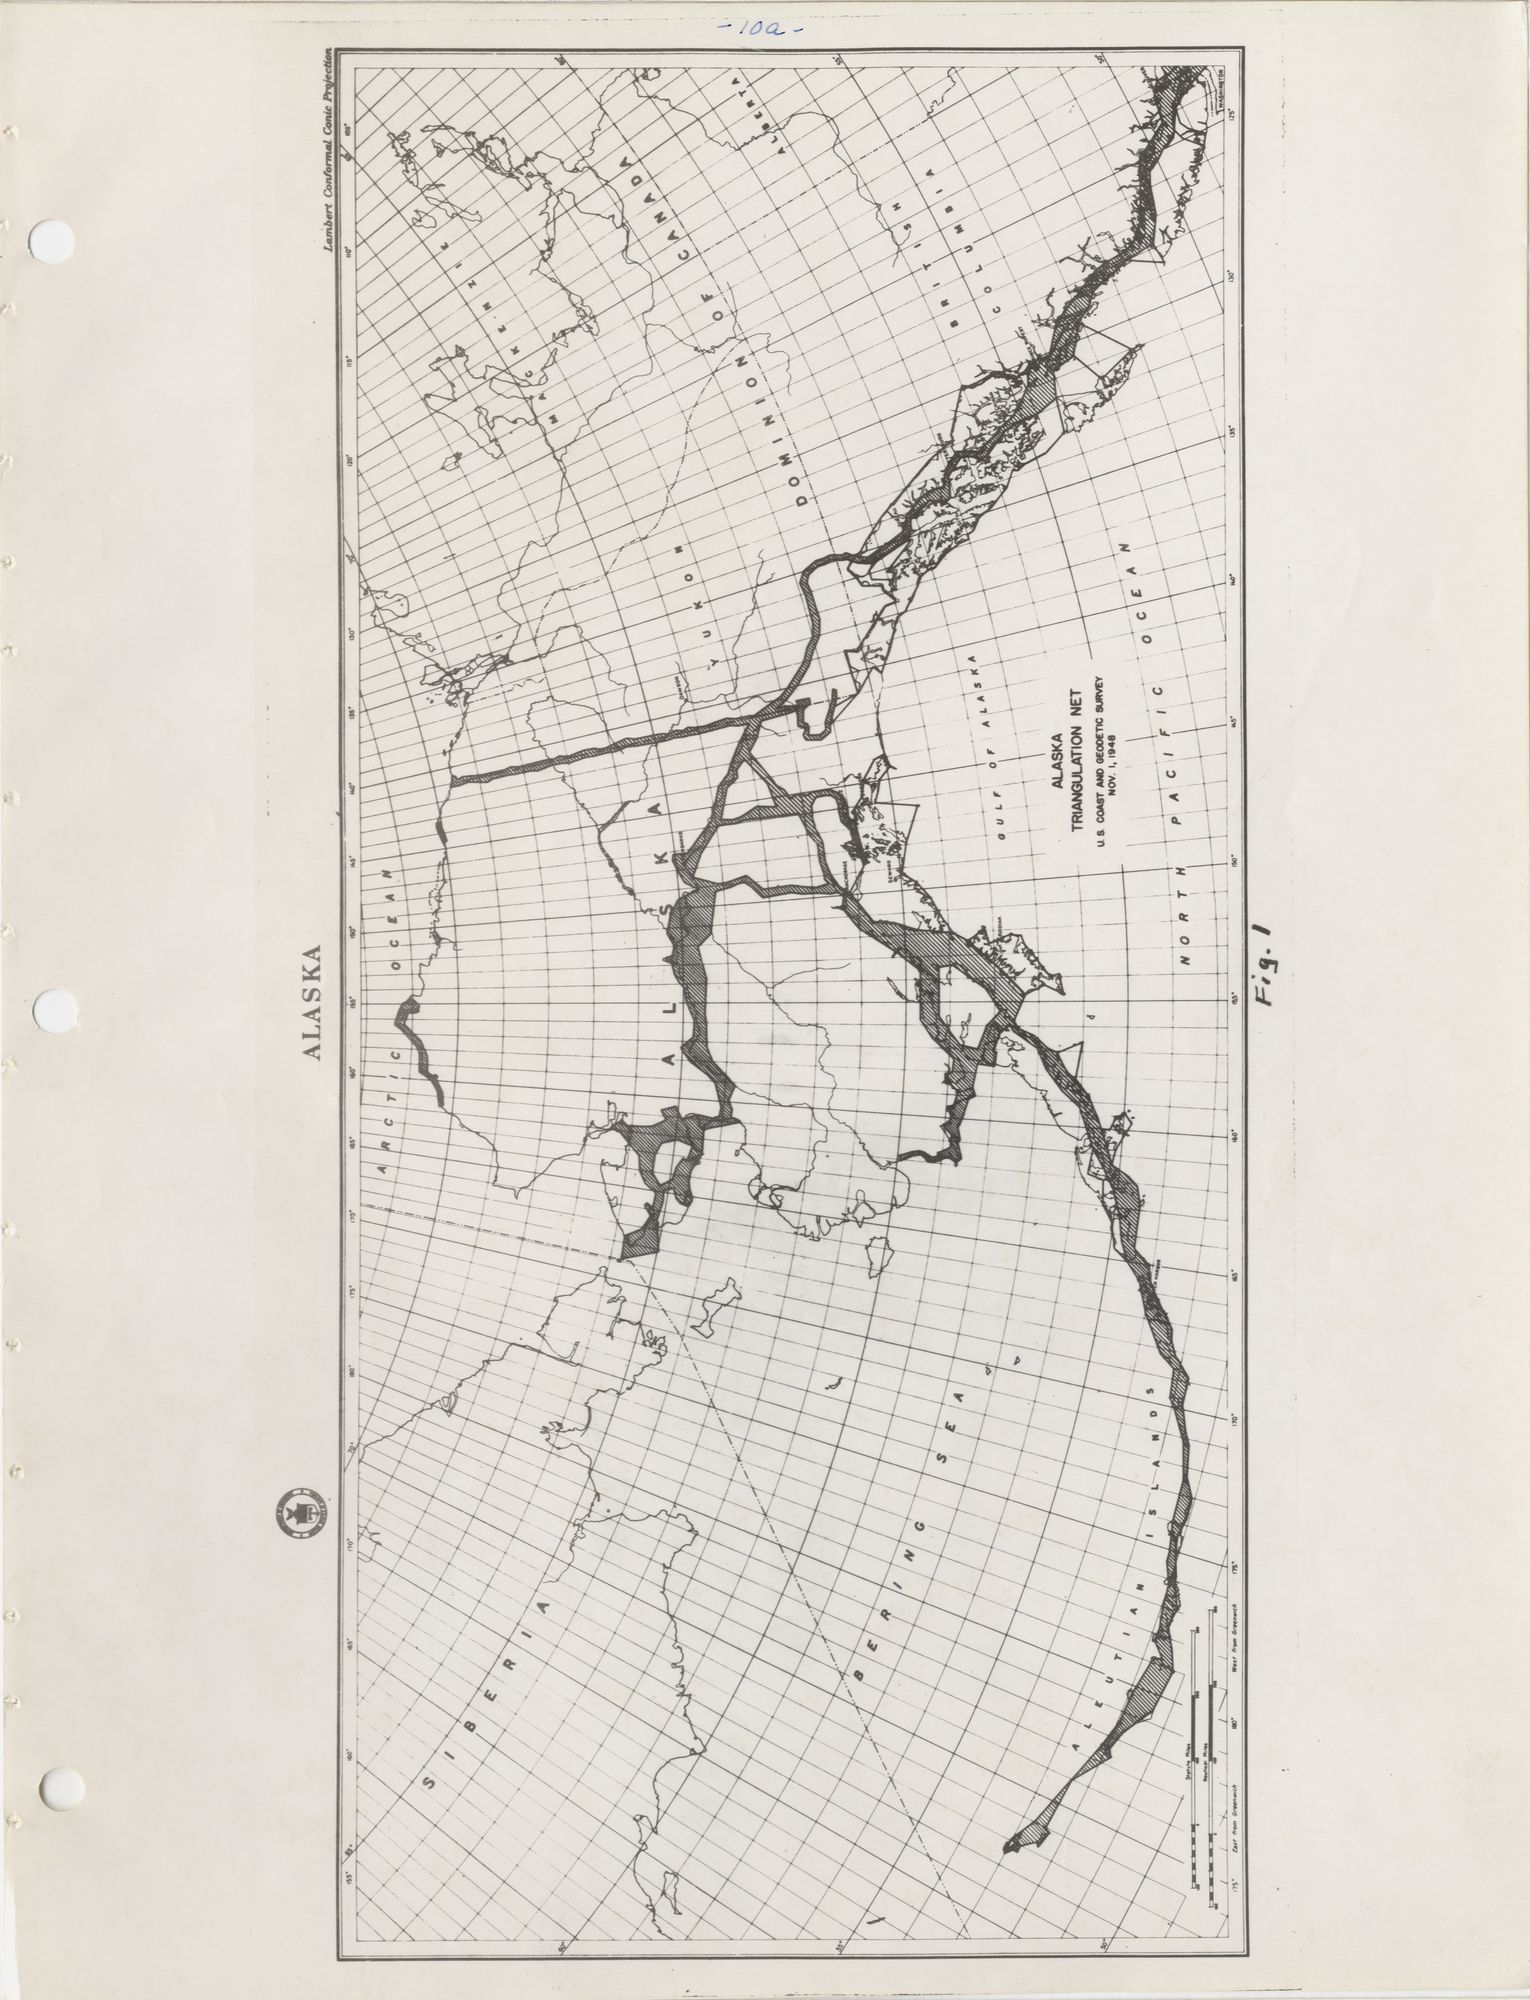
Alaska Triangulation Net

Alaska Hydrographic Surveys
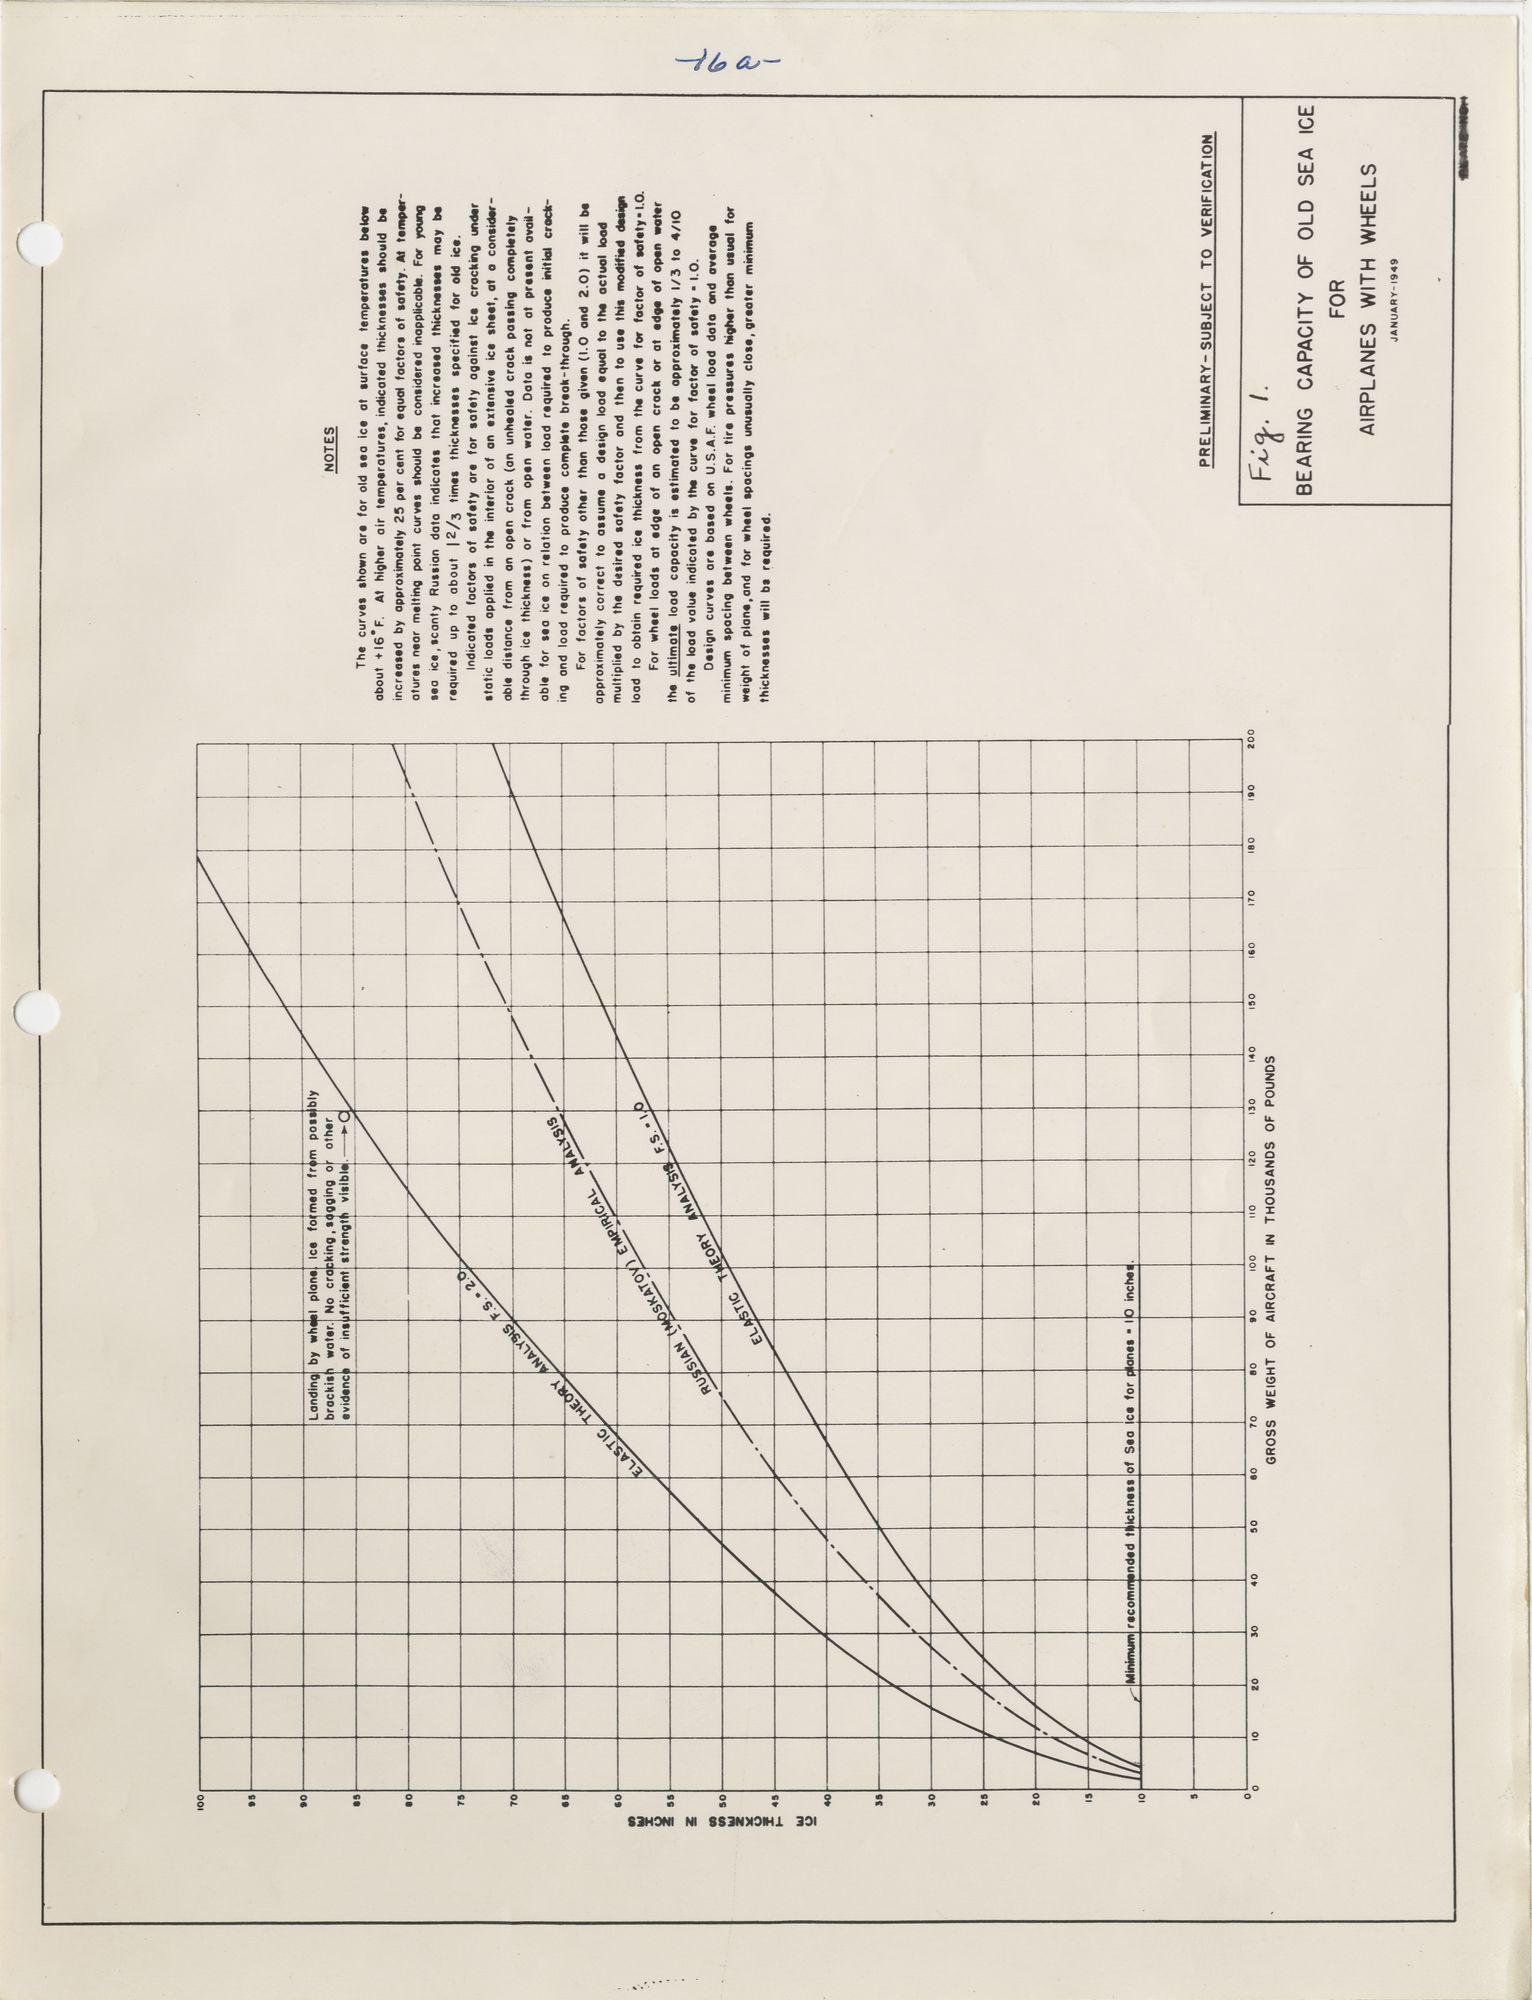
Bearing Capacity of Old Sea Ice for Airplanes with Wheels January-1949

Bearing Capacity of Fresh-Water Ice for Airplanes with Wheels January-1949
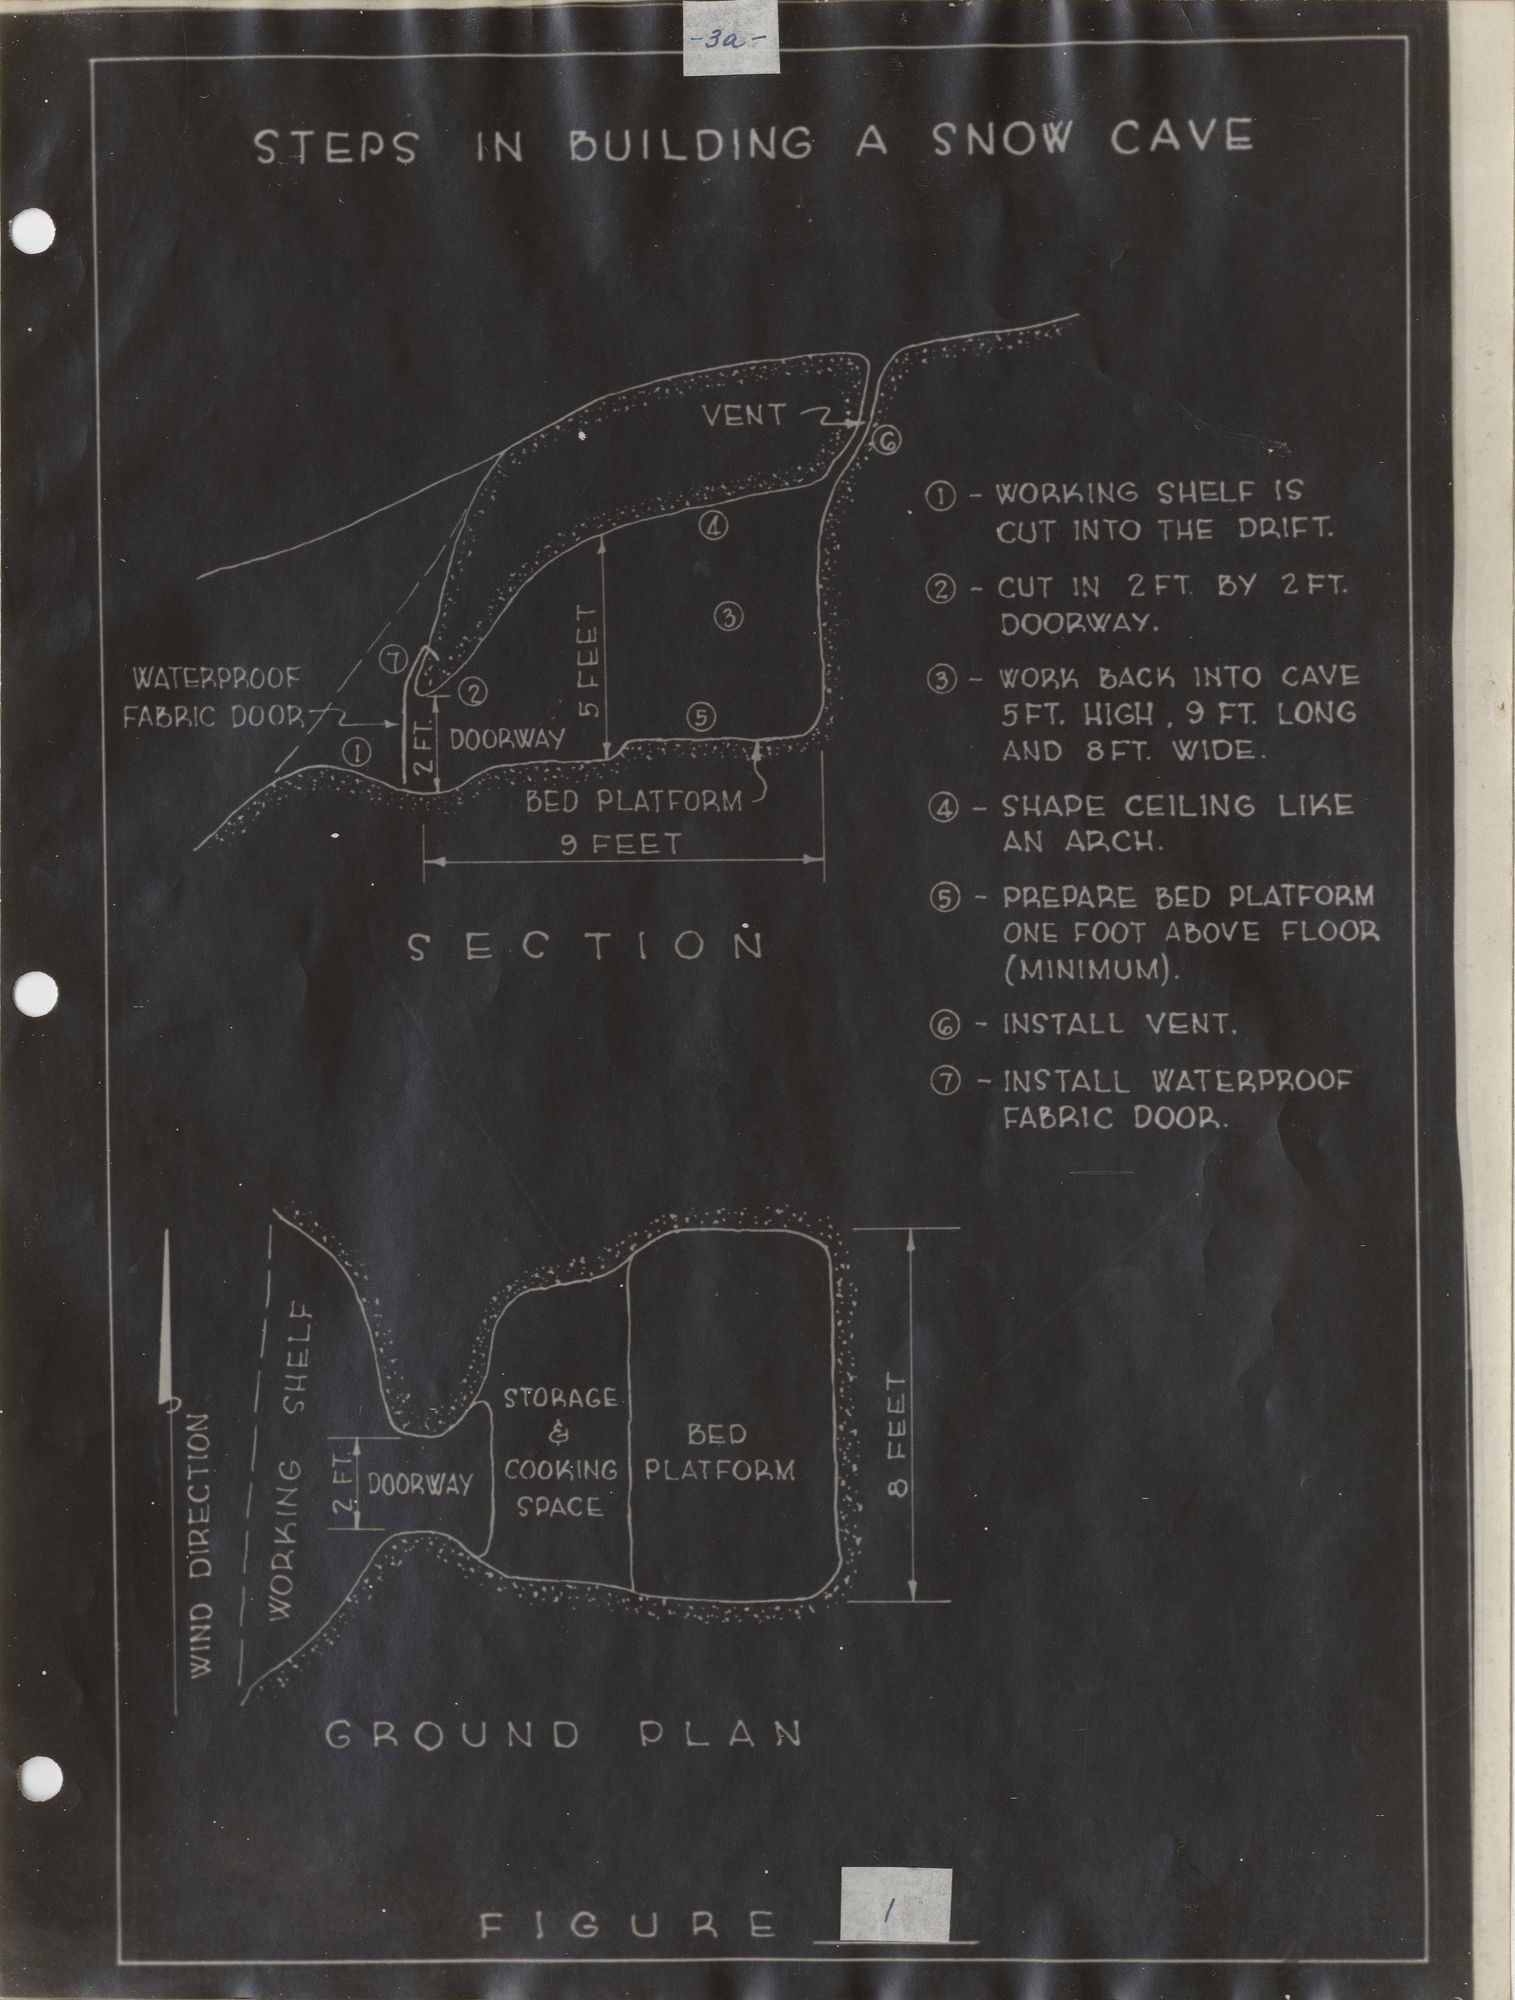
Instructions for building a snow cave and sample ground plan
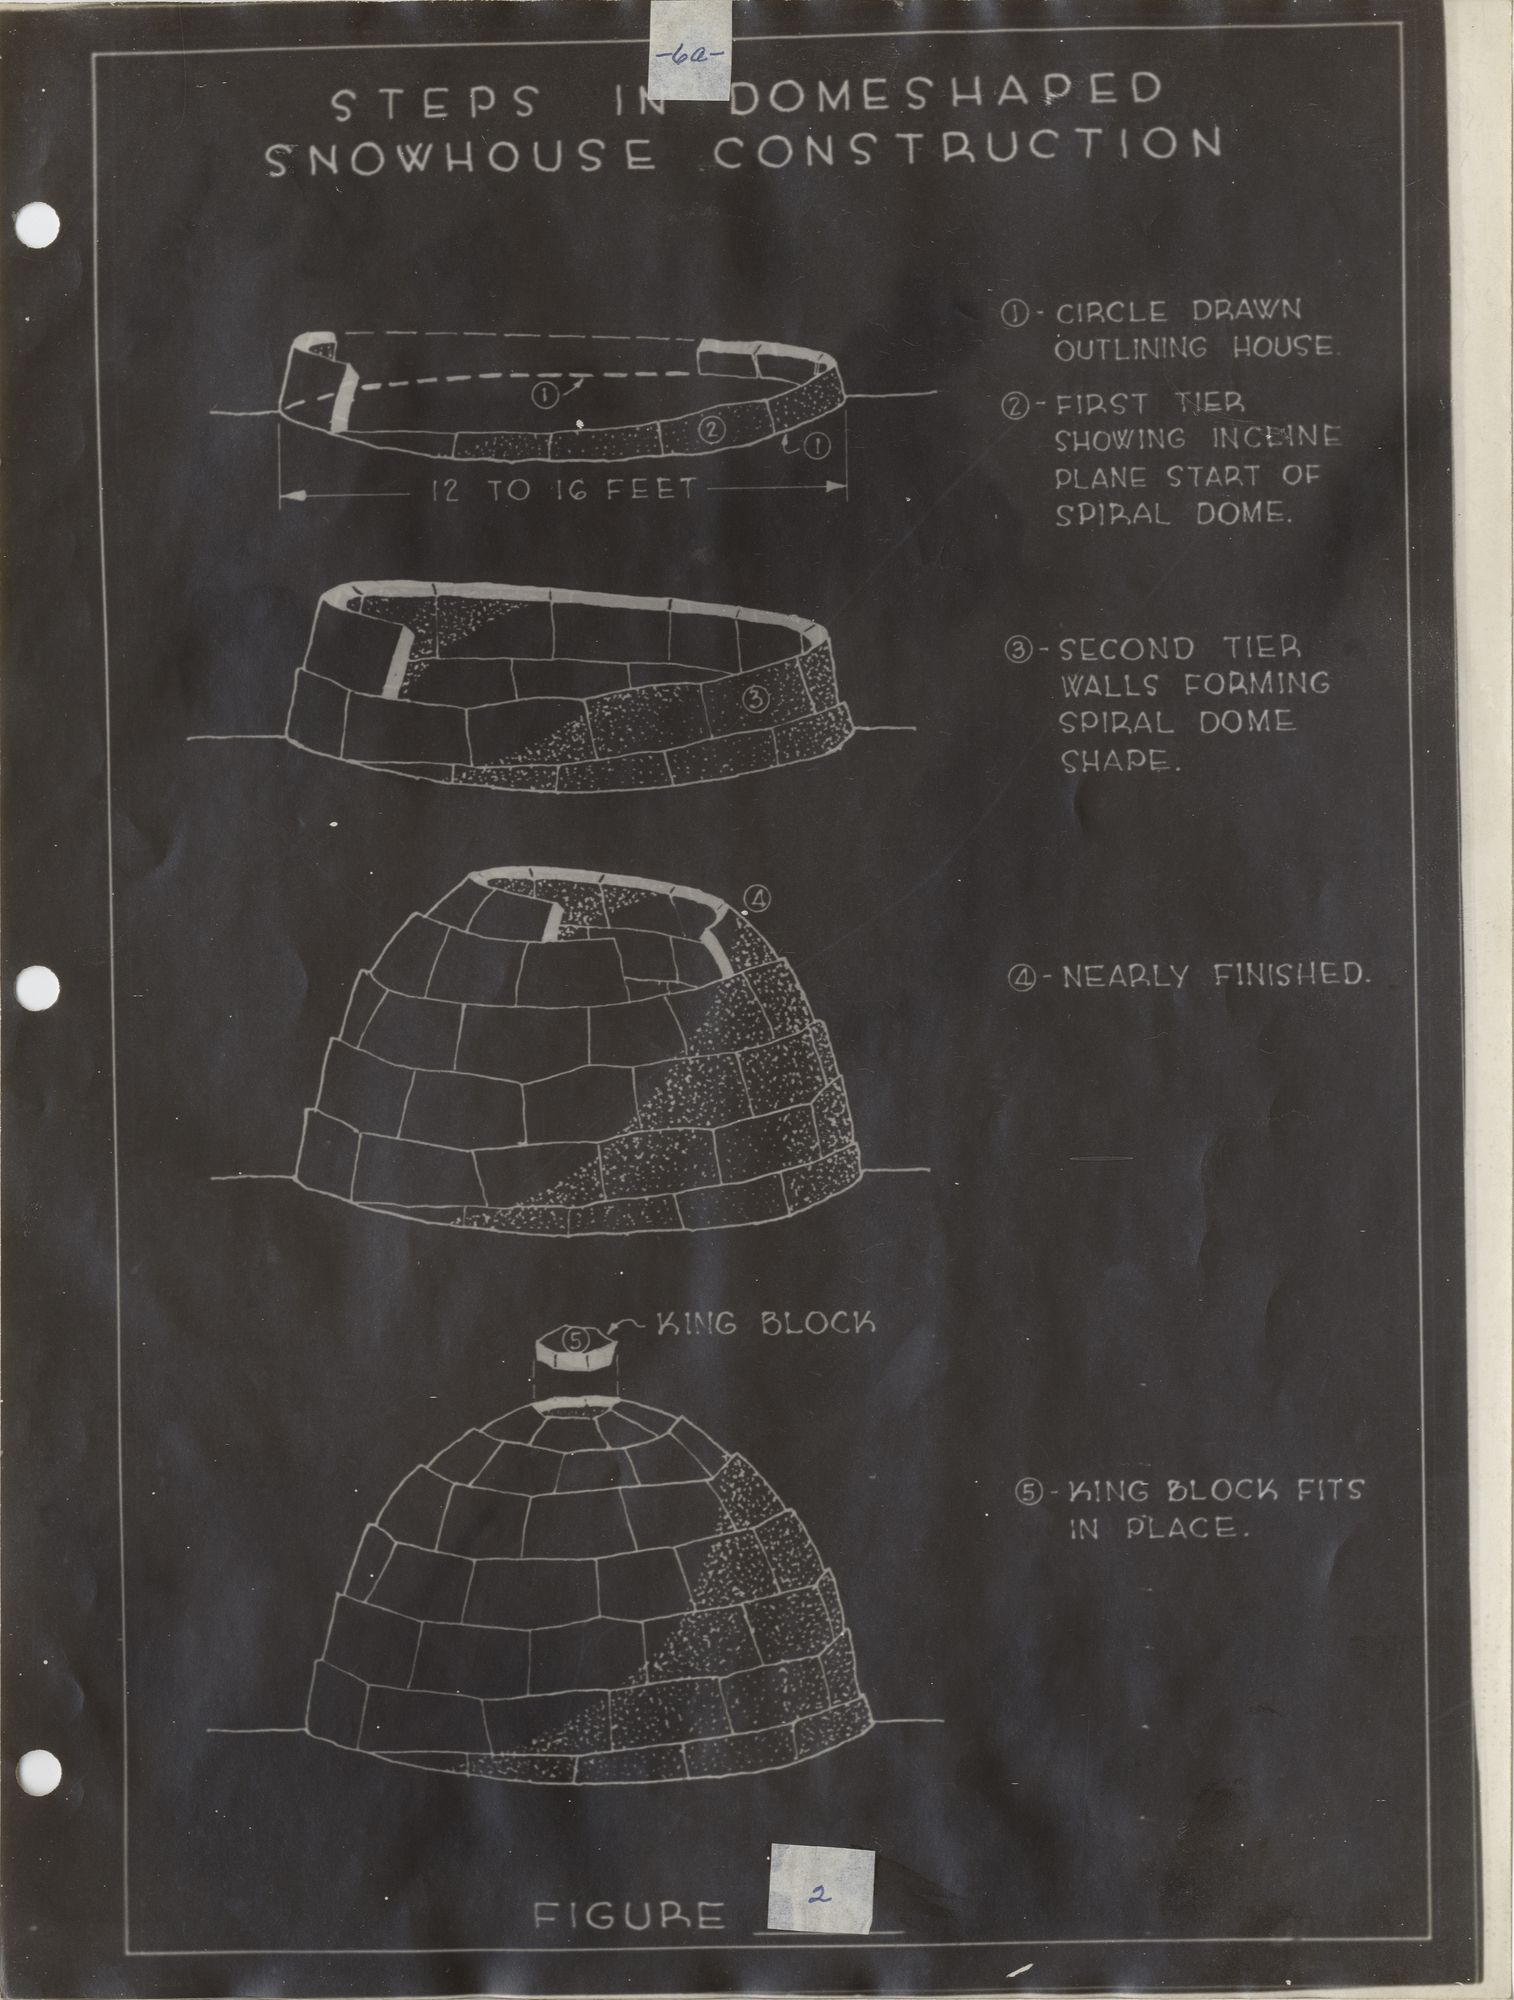
Steps in domeshaped snowhouse construction
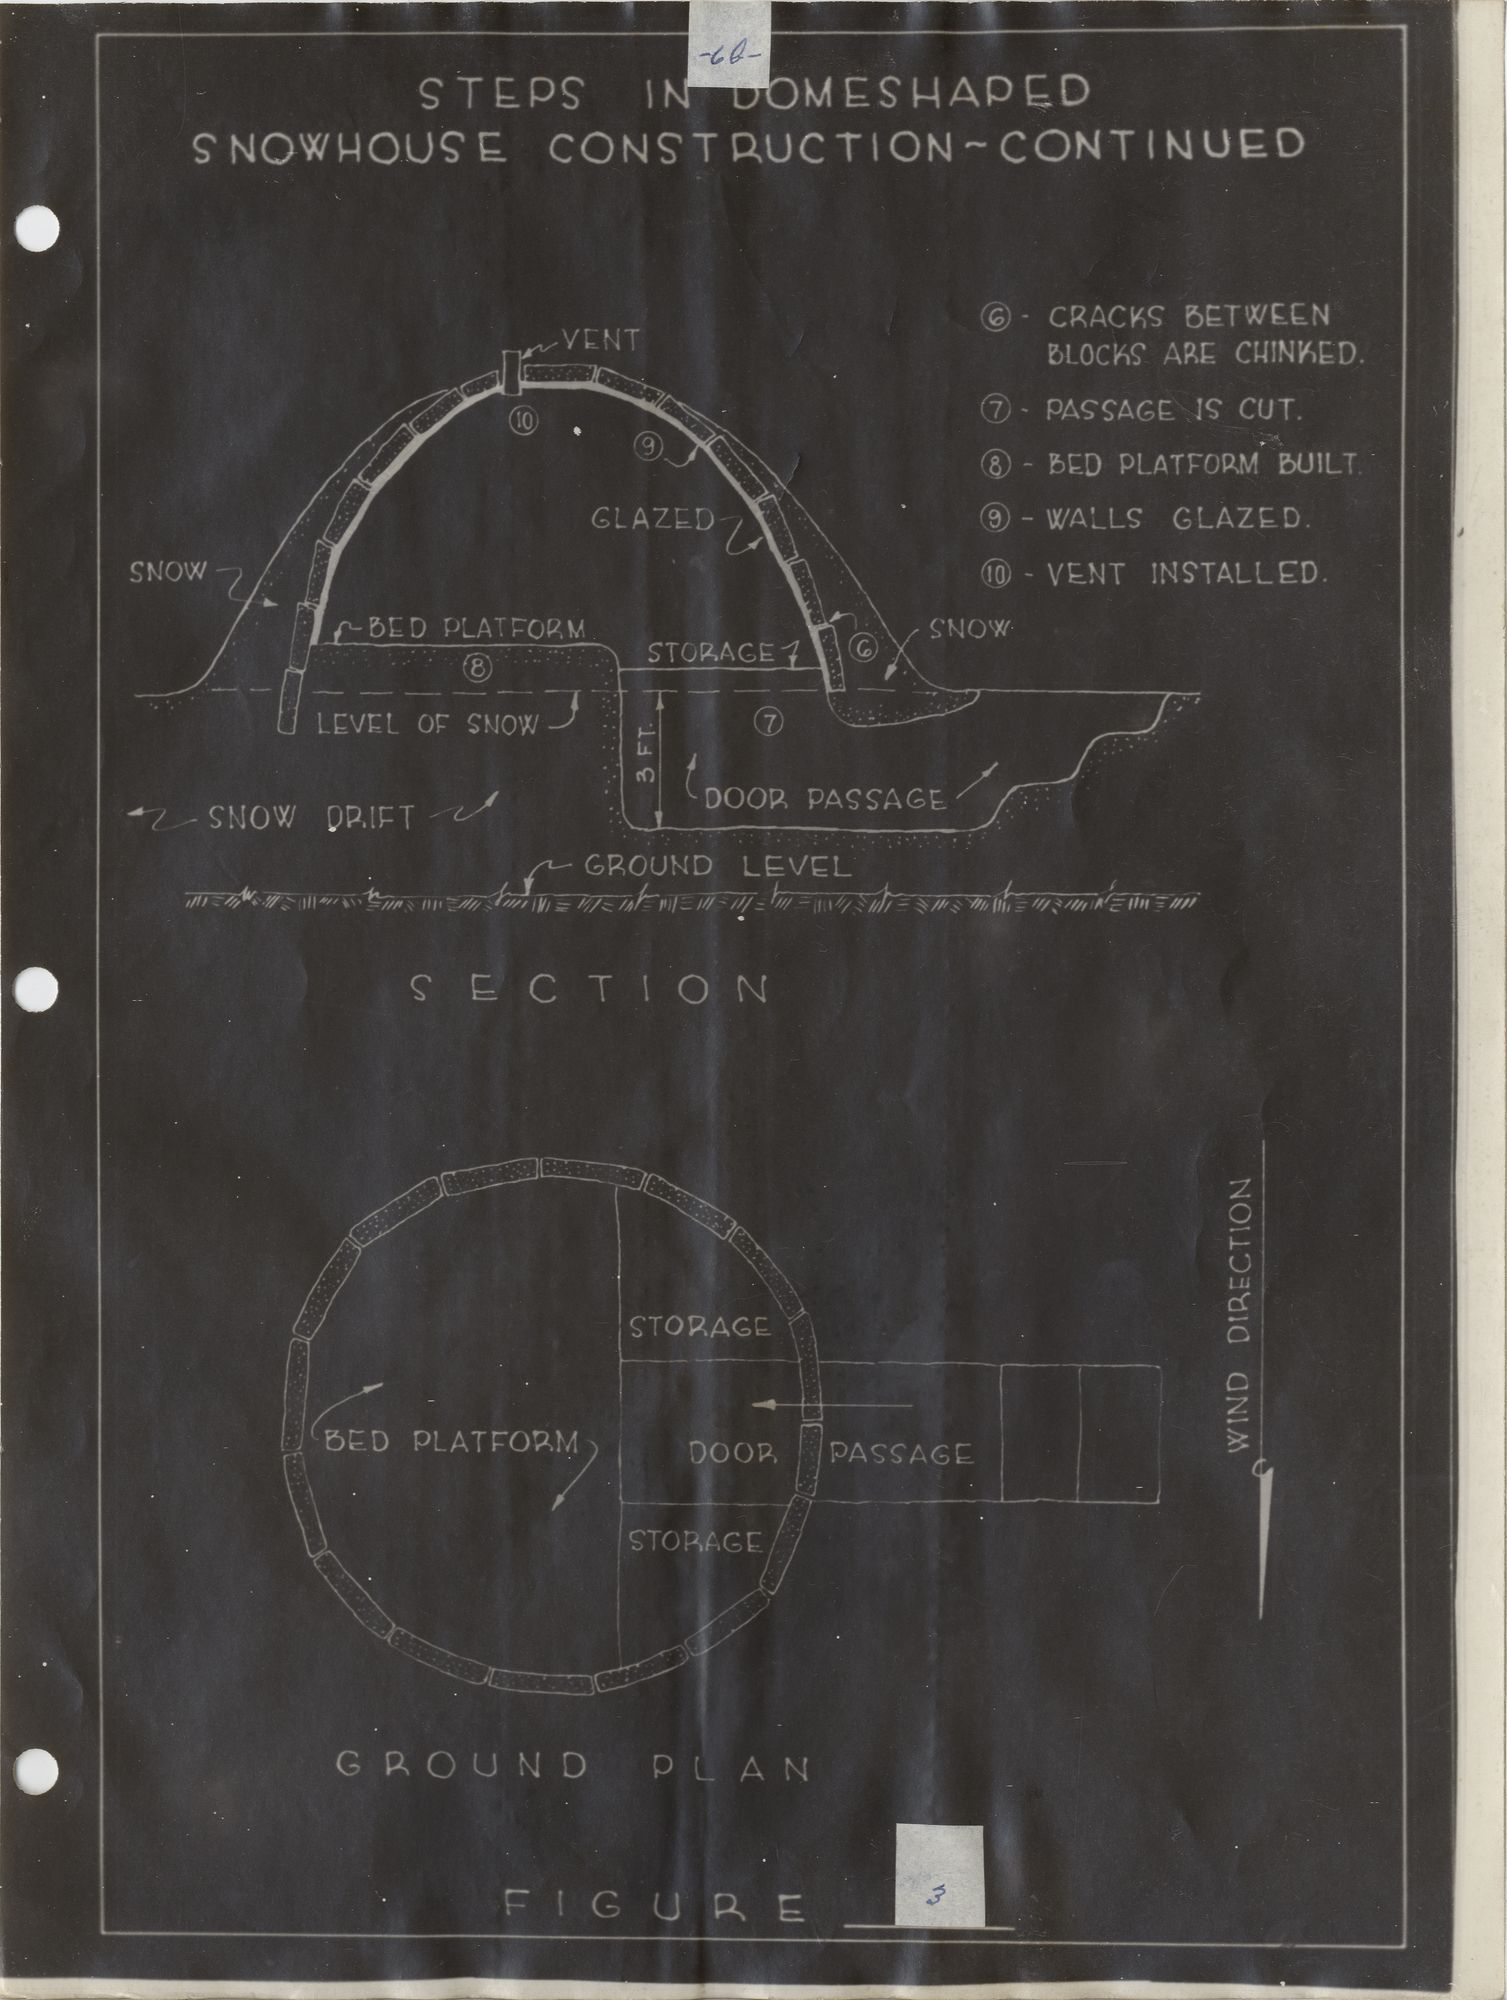
Steps in domeshaped snowhouse construction - continued
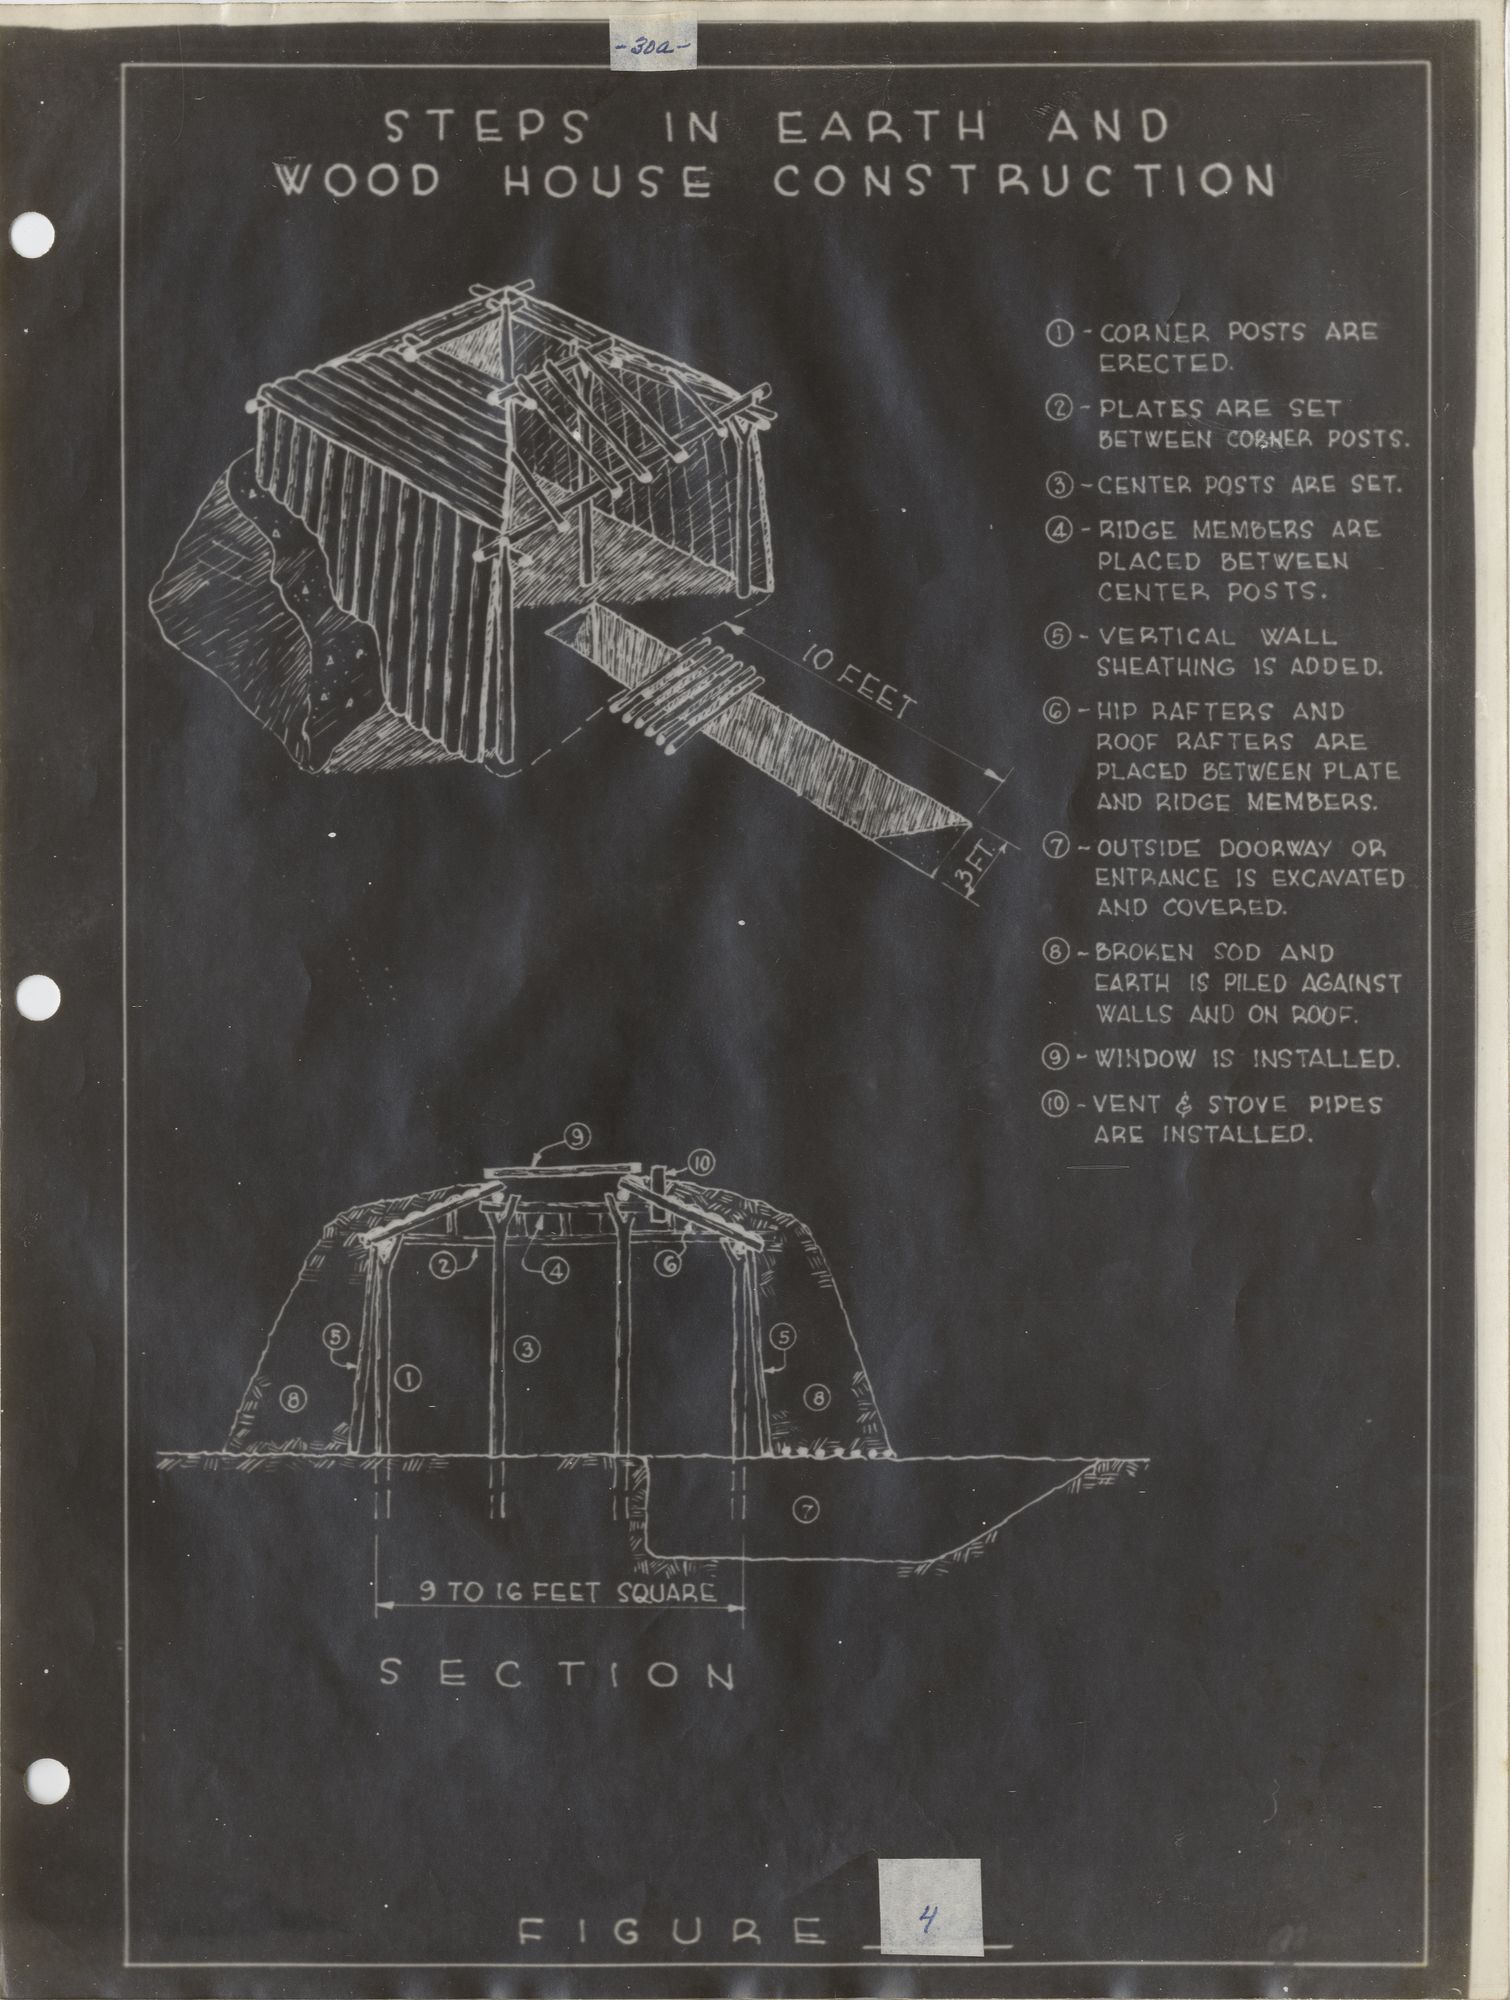
Steps in earth and wood house construction
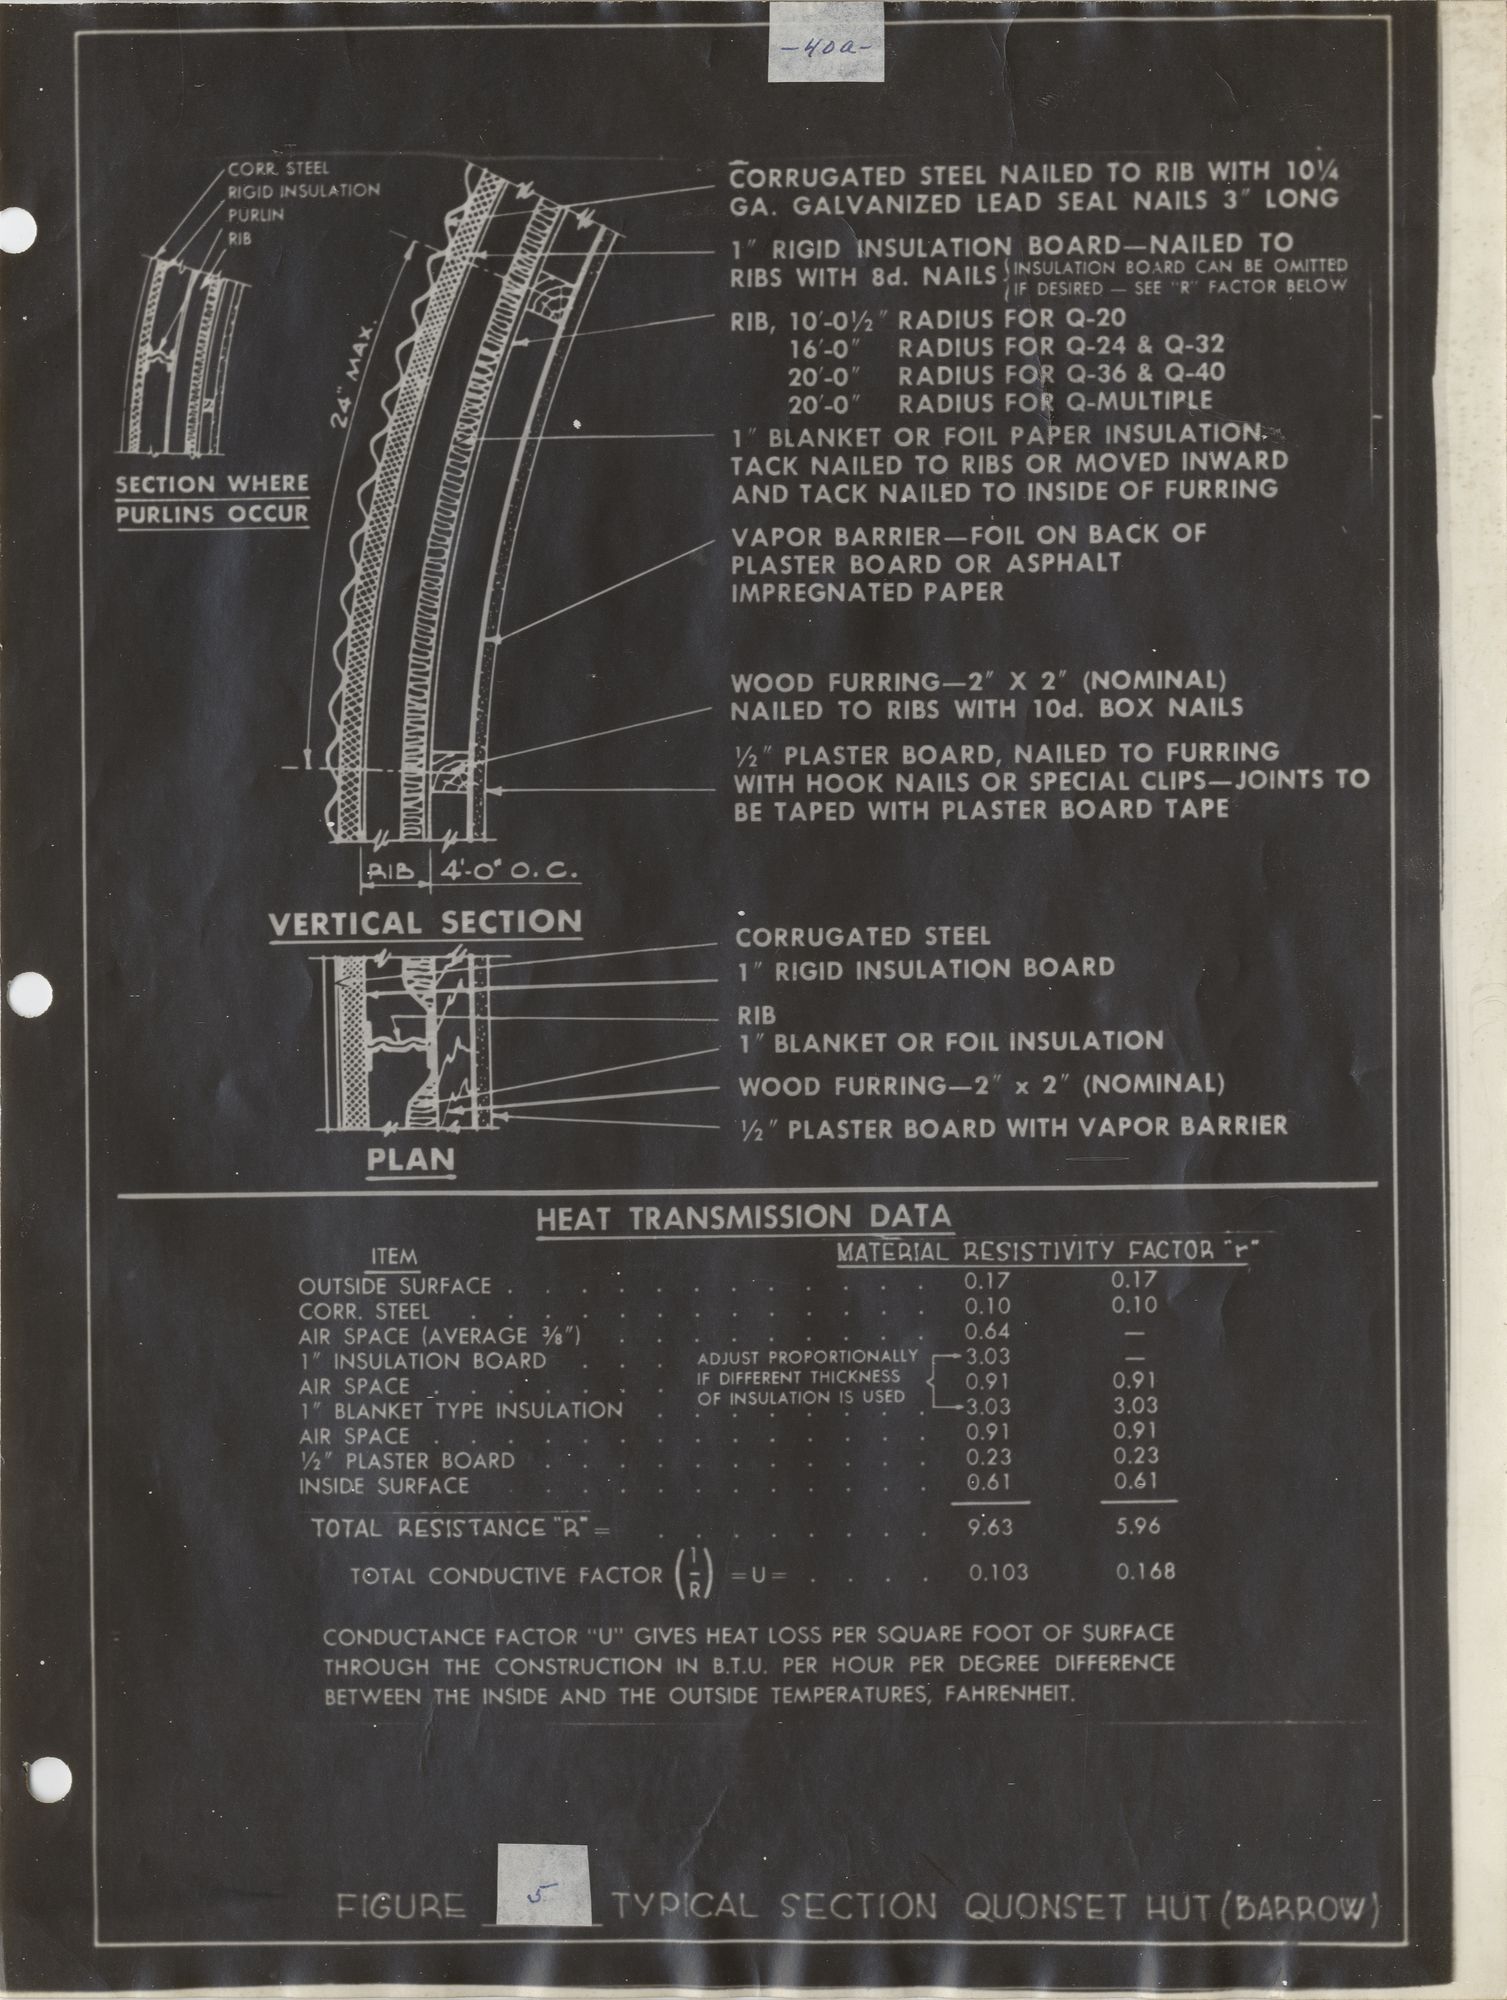
Typical Section Quonset Hut (Barrow)
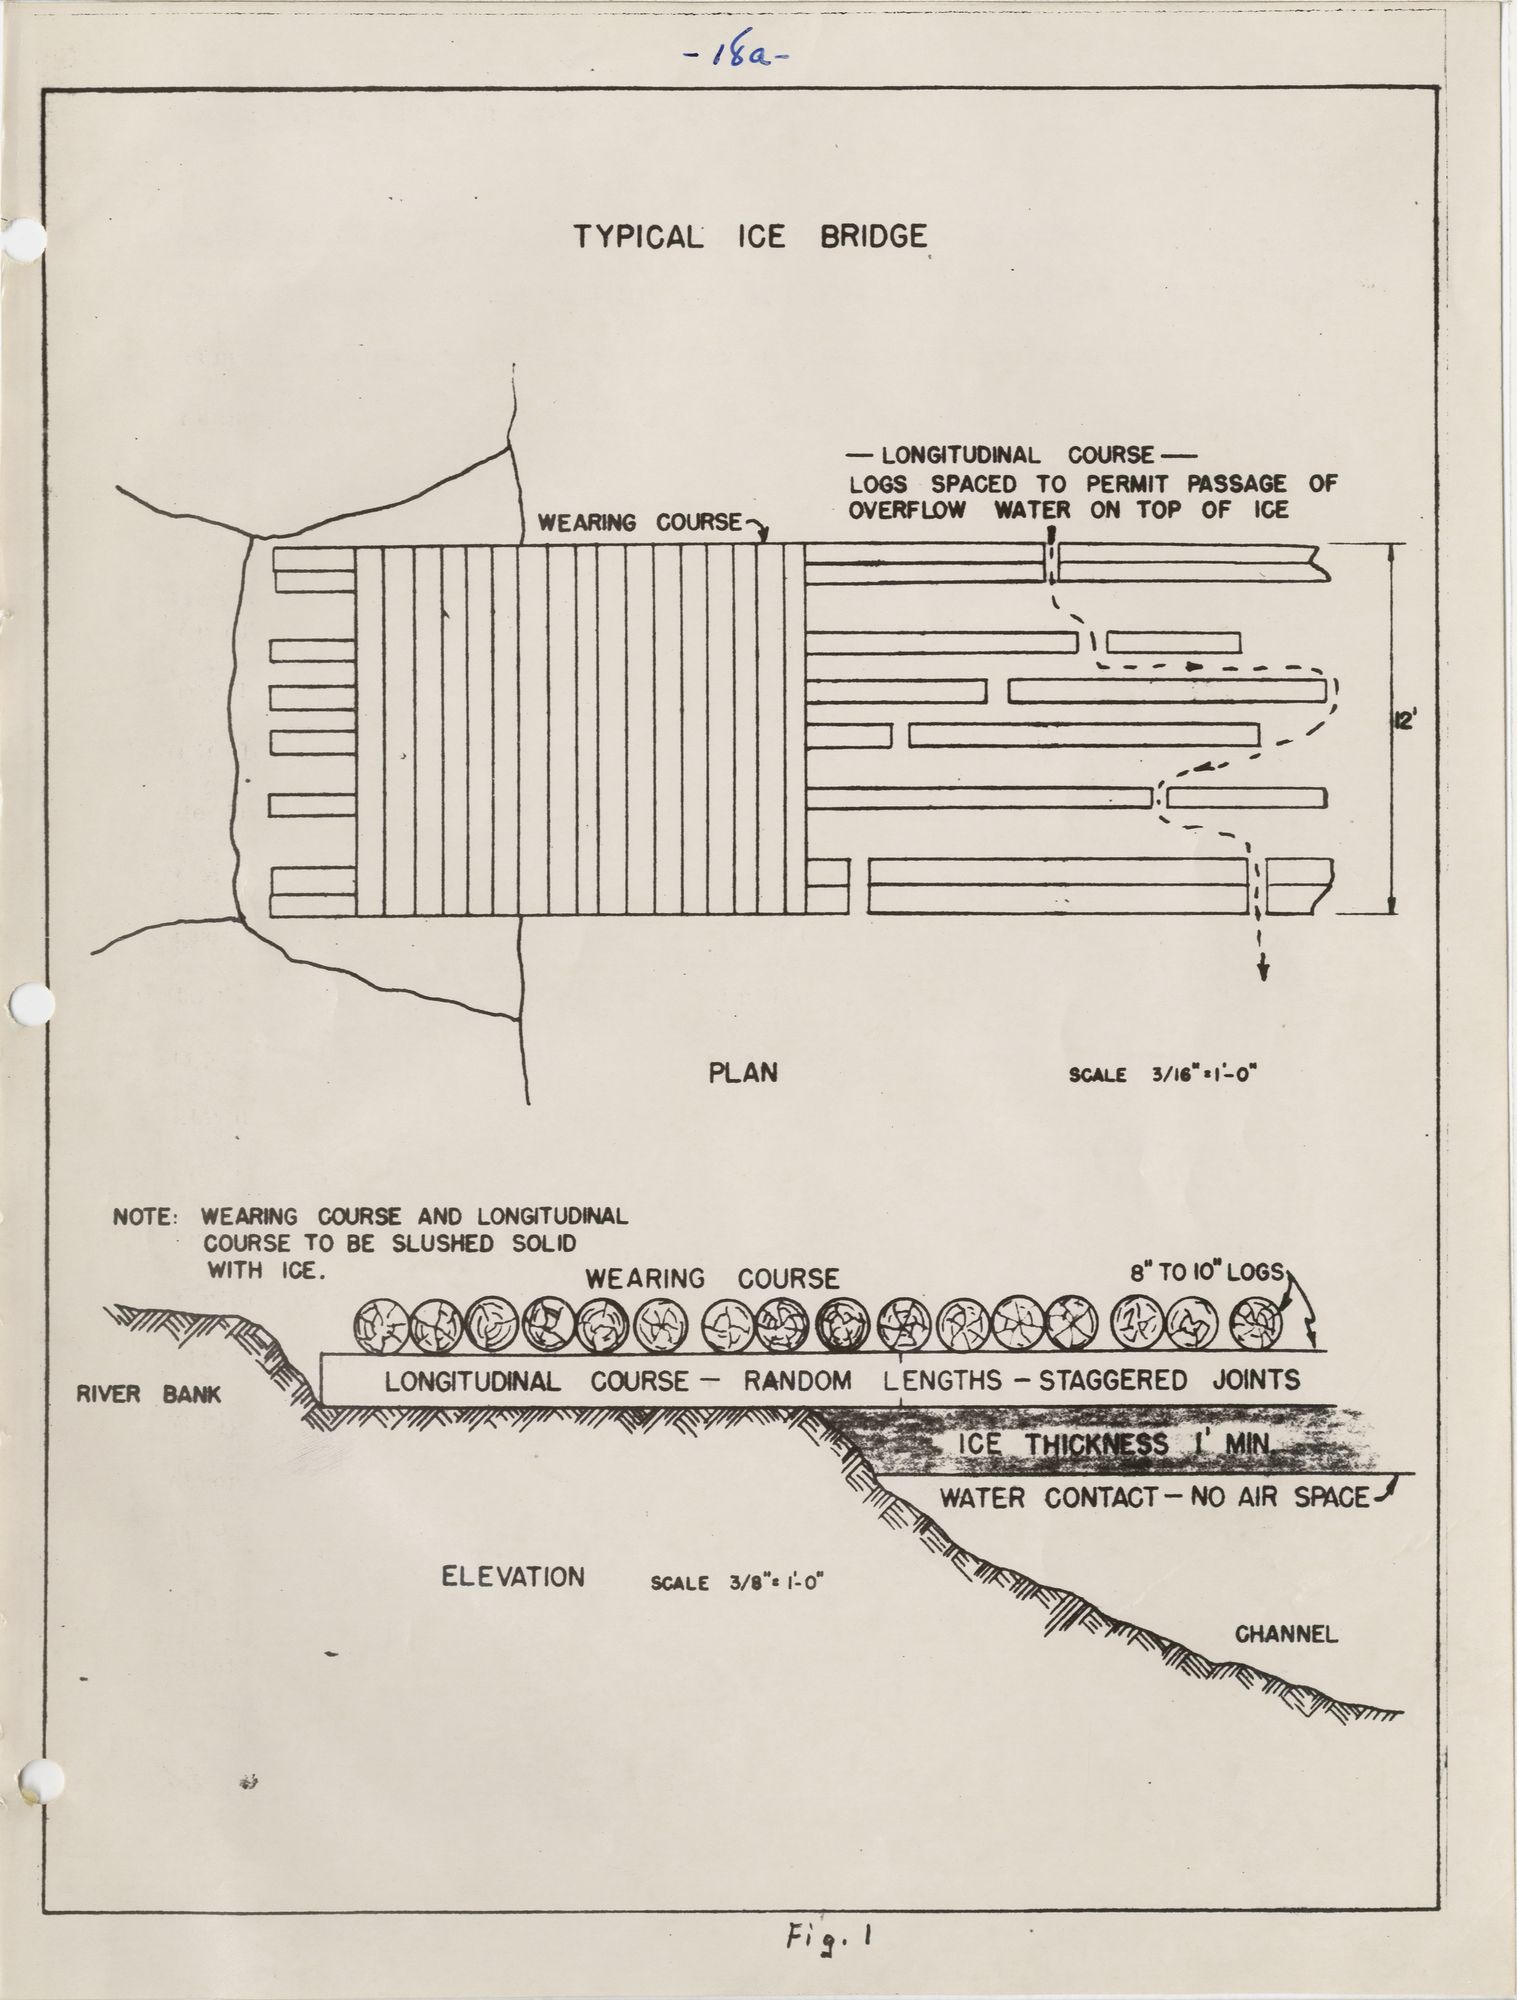
Typical Ice Bridge