Volume 7: Meteorology and Oceanography
Canadian Meteorology
The Climate of the American Northlands
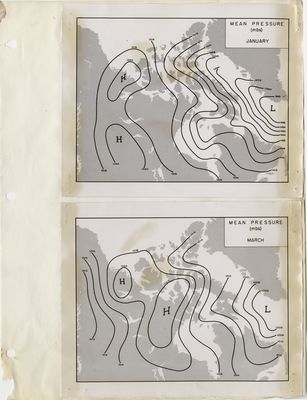
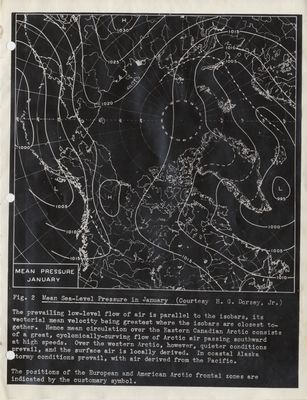
Mean Sea-Level Pressure in
January. (Courtesy H. G. Dorsey, Jr.) The
prevailing low-level flow of air is parallel to
the isobars, its vectorial mean velocity being
greatest where the isobars are closest together.
Hence mean circulation over the Eastern Canadian
Arctic consists of a great, cyclonically-curving
flow of Arctic air passing southward at high
speeds. Over the western Arctic, however, quieter
conditions prevail, and the surface air is locally
derived. In coastal Alaska stormy conditions
prevail, with air derived from the Pacific. The
positions of the European and American Arctic
frontal zones are indicated by the customary
symbol.
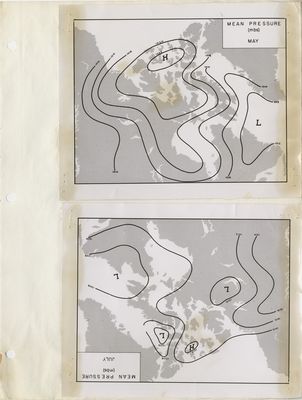
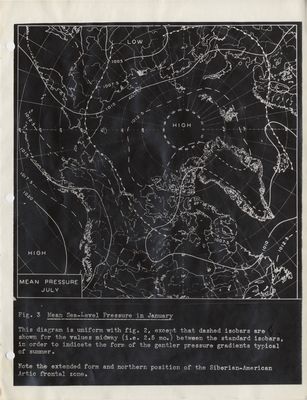
Mean Sea-Level Pressure in
January. This diagram is uniform with fig. 2,
except that dashed isobars are shown for the
values midway (i.e. 2.5 mo.) between the standard
isobars, in order to indicate the form of the
gentler pressure gradients typical of summer. Note
the extended form and northern position of the
Siberian-American Arctic frontal zone.
Oceanography of the Arctic
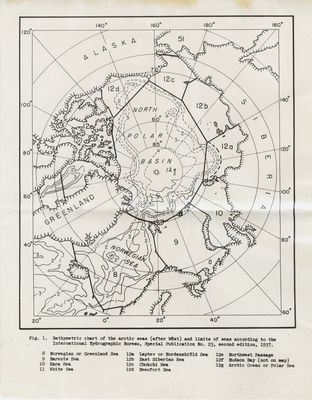
Bathymetric chart of the
arctic seas (after Wüst) and limits of seas
according to the International Hydrographic
Bureau, Special Publication No. 23, second
edition, 1937. 8 Norwegian or Greenland Sea 9
Barents Sea 10 Kara Sea 11 White Sea 12a Laptev or
Nordenskiöol Sea 12b East Siberian Sea 12c Chukchi
Sea 12d Beaufort Sea 12e Northwest Passage 12f
Hudson Bay (not on map) 12g Arctic Ocean on Polar
Sea
The Uses of Ice
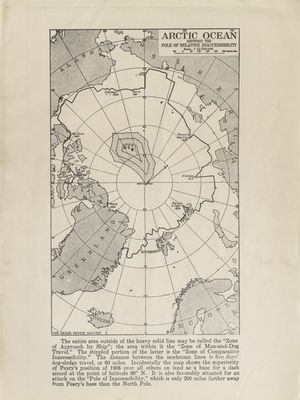
The entire area outside of
the heavy solid line may be called the “Zone of
Approach by Ship”; the area within the “Zone of
Man-and-Dog Travel.” The stippled portion of the
latter is the “Zone of Comparative
Inaccessibility.” The distance between the
isochronic lines is five days’ dog-sledge travel,
or 60 miles. Incidentally the map shows the
superiority of Peary’s position of 1908 over all
others on land as a base for a dash aimed at the
point of latitude 90° N. It is also favorably
situated for an attack on “Pole of
Inaccessibility,” which is only 200 miles farther
away from Peary’s base than the North
Pole.
