-
The Meteorology of the Arctic Region
Encyclopedia Arctica 7: Meteorology and Oceanography
Unpaginated | Vol_VII-0005
THE METEOROLOGY OF THE ARCTIC REGION
By
Sverre Petterssen, W. C. Jacobs,
and B. C. Haynes
Unpaginated | Vol_VII-0006
EA: Meteorology
[Sverre Petterssen, W.C. Jacobs and B.C. Haynes]
THE METEOROLOGY OF THE ARCTIC REGION
Page Introduction 1 Composition and Structure 4 Inversions and Lapse Rates 19 Acoustic Phenomena 25 Optical Phenomena 37 Air Masses and Fronts 46 Cyclones and Anticyclones 52 Atmospheric Pressure 56 Surface Wind 66 Upper-Air Winds 98 Air Temperature 107 Precipitation, Snowfall, Thunderstorms 164 Humidity 211 Cloudiness and Ceilings 228 Fog and Visibility 264 Sunshine, Illumination 287 Information on Diagram 302 Reference to Literature 304 Legend to Diagrams 308
Note : The diagrams referred to in this paper are of a dimension too
large to be included in the present binding. These diagrams
may be consulted in the Stefansson Collection where they are
filed. (December, 1954)
001 | Vol_VII-0007
INTRODUCTION
From the broadest point of view the climatic regions of the
world may be divided into five principal types, vis.,A. Tropical Rainy Climates , which comprise the tropical rain
forests, the tropical monsoon systems, and the adjoining savannas.B. Dry Climates , which comprise the deserts and steppes in
subtropical and adjacent latitudes.C. Warm Temperate Climates , which comprise the part of the
midlatitude rainy belt that is not normally covered by snow in
winter.D. Snow-Forest Climates , which comprise the mid and high
latitude belt with extensive forests and snow cover during the
winter.E. Polar Climates , which comprise the tundra regions and the
fields of perpetual snow and ice.Fig. 1 The distribution of these types of climatic regions in the nor–
thern hemisphere is shown in Fig. 1. Each of these regions may be
divided into sub-regions, depending upon the amount rainfall,
002 | Vol_VII-0008
seasonal variations, and other limiting factors that affect the
natural vegetation. In this respect the Polar Climate may be said
to be the simplest of all principal climatic types, inasmuch as it
suffices to divide it into two subtypes, namely the Tundra Climate
and the Frost Climate .The Frost Climate occupies the regions of perpetual snow and
ice, while the Tundra Climate is characterized by bare ground during
the warm season. The vegetation typical of the tundra consists
largely of mosses, lichens and grasses with dwarf trees in sheltered
places. Along its equatorward border the tundra merges with the
vegetation of the snow-forest climatic zone of the northern hemi–
sphere, and the border between these two climatic zones has been
found to coincide very nearly with the line along which the mean
July temperature is 50°F (10°C). Using this isotherm as a criterion,
it is convenient to extend the border between the Polar Climate and
the adjoining regions across the oceans, as shown in Fig. 1.From a meteorological point of view it is convenient to define
003 | Vol_VII-0009
the Arctic Region as the region around the North Pole occupied by
Polar Climates (Fig. 1.), excluding the isolated islands of such
climates that occur in certain mountainous regions in lower lati–
tudes. It should be noted, however, the weather conditions typical
of the arctic are normally encountered also in the regions occupied
by the snow-forest climate (i.e., regions D in Fig. 1).Fig. 2 The normal distribution of the air temperature as a function
of latitude and as a mean for all meridians is shown in Fig. 2.
Using the 10°C July isotherm as the line of demarkation between the
arctic region and the adjacent climatic zones, it will be seen that
the mean position of this isotherm is about 66°N. The area of the
arctic region, as defined above, is therefore about one-twelvth of
the area of the northern hemisphere. Using the correspondence iso–
therm of the warmest month in the southern hemisphere as the border
of the antarctic region, it will be seen from Fig. 2 that this
isotherm is found about 48°S, indicating that the area of the
antarctic region is about three times as large as that of the
[ ?] arctic region.
004 | Vol_VII-0010
COMPOSITION AND STRUCTURE
Composition of Dry Air . - The air consists of mixture of a number
of gases. Most of these are present in a perfectly mixed state,
with the result that their relative amounts are constant all over
the world, at least up to 25-30 km. (80,000 - 100,000 ft.). The
most important of the constituents are given in Table I, which is
summarized from a recent publication of the International Meteoro–
logical Organization [ 21 ] . The amounts are expressed in terms
of mol. fractions, which for all practical purposes may be taken
to indicate the volume percentage occupied by each gas.TABLE I. - Principal Constituents of Dry Air . Nitrogen 78.09 per cent Oxygen 20.95 per cent Argon 0.93 per cent Carbon Dioxide 0.03 per cent
In addition to these principal constituents, there are traces
of Neon, Helium, Krypton, Hydrogen, Xenon, Ozone and Radon, but
005 | Vol_VII-0011
their amounts are so small that they are of no practical importance.The amount of carbon dioxide is not quite constant. The vege–
table world continuously consumes carbon dioxide which, again, is
produced by the animal world, through burning of fuels, volcanic
action, and various processes of decay in the soil. Although these
processes are not always balanced, the oceans, by dissolving the
excess of carbon dioxide, so effectively regulate it that no great
variations arise. In view of the absence of local sources, the
amount of carbon dioxide in the arctic is likely to be rather less
than the normal for the atmosphere as a whole.Ozone, which is present in minute amounts in the atmosphere,
shows a considerable variation with season, latitude and height;
it also varies with the weather situation.Extensive investigations by Dobson [ 11 ] , Tönsberg [ ], and
Langlo Olson [ 46 ] , Craig [ 10 ] and others have revealed the fol–
lowing broad features of the distribution and variation of the
amount of ozone.(a) The amount of ozone per unit volume increases with
006 | Vol_VII-0012
elevation, reaches a maximum value somewhere between 20 and 30 km.
(65 - 100,000 ft.) and then decreases.Fig. 3 (b) The total amount of ozone (in a vertical air column) has
a pronounced annual variation with a maximum in spring and a minumum
in late autumn (Fig. 3).(c) The total amount of ozone in middle latitudes varies
aperiodically with the general weather situation, the amount being
larger when the air current is from a northerly direction than when
it is from a southerly direction.From the foregoing discussion it follows that the composition of
the dry atmosphere in the arctic region is essentially the same as
elsewhere, except that the arctic region is particularly rich in
ozone, and probably slightly deficient in carbon dioxide content.
007 | Vol_VII-0013
Water Vapor . - The air also contains a variable amount of water
vapor. In many respects the water vapor is the most important
constituent of the atmosphere. The maximum amount of water vapor
that the air can absorb depends entirely upon the temperature; the
higher the temperature of the air the more water vapor can it hold,
the air being saturated with moisture when the maximum is reached.The amount of water present in the air is conveniently
expressed by the pressure that it exerts. This pressure is usually
expressed in millibars, 1 mb. corresponding to 0.75 mm. or 0.029
inches of mercury under standard conditions.The maximum amount of water vapor, or the saturation vapor
pressure , various temperatures is given in Table II. Comparing
these figures with the curves in Fig. 2, it will be seen that the
maximum vapor pressure corresponding to the mean temperatures in
the vicinity of the North Pole would be about 0.1 mb. in January,
6.0 mb. in July, and 2.8 mb. as a mean for the year. The amount of
water vapor in the arctic may, therefore, vary by several thousand
percent during the year.
008 | Vol_VII-0014
TABLE II. Saturation Vapor Pressure (E, in millibars) at various
temperatures . E w refers to a water surface , and E i to ice surface .T(°C) T(°F) E w T(°C) T(°F) E w E i 30 86.0 42.4 −5 23 4.21 4.02 28 82.4 37.8 −10 14 2.86 2.60 26 78.8 33.6 −15 5 1.91 1.65 24 75.2 29.8 −20 −4 1.25 1.03 20 68 23.4 −30 −22 0.51 0.38 15 59 17.0 −40 −40 0.19 0.13 10 50 12.3 −50 −68 0.06 0.04 5 41 8.7 −60 −86 0.01 0 32 6.1 −70 −104 0.003
009 | Vol_VII-0015
Comparing the arctic region with the equatorial belt, it will
be seen from Fig. 2 Table II that the saturation vapor pressure
in the vicinity of the North Pole is about one-sixth in July, and
about one-four hundredth in January, of the saturation vapor pressure
near equator. Since the air normally is not quite saturated,
the contrasts of the actual amounts of water vapor will be somewhat
less. Nevertheless, the moisture content is expressed in ab–
solute amounts, the arctic region stands out as being excessively
dry during the cold season. This absolute dryness, together with
the low temperature, constitutes an environmental factor of great
importance.Although the arctic air is dry, on an absolute scale, it is
not so in terms of relative humidity. Let e denote the actual
vapor pressure and E the saturation vapor pressure corresponding
to the air temperature. The relative humidity is then defined as
100 e/E, i.e., the actual vapor pressure expressed as a percentage
of the maximum value at the temperature in question. The distribu–
tion of the relative humidity, as a function of latitude and a
010 | Vol_VII-0016
Fig. 4 mean for all meridians, is shown in Fig. 4. It will be seen that
the relative humidity in the arctic is normally about 10 per cent
higher than in middle latitudes, and about 5 per cent lower than
in the equatorial belt.Impurities. - Apart from the above-mentioned gaseous constituents,
the atmosphere contains a variety of impurities, such as dusts, soots
and salts.The main source of dust is the dry climatic regions (Fig. 1).
The coarser material is never carried far from its source, but minute
dust particles are readily kept soaring by the turbulent motion and
carried long distances from their place of origin by the general
air currents. Before dusty air from the arid regions arrives in
the arctic, it will normally have been cooled so much that conden–
sation has occurred; the precipitation of water from the clouds
washes out the dust to a very large extent, with the result that
the air in the arctic region is particularly free of dust. This
is especially true in winter when the rate of cooling of the north–
ward moving air masses is largest.
011 | Vol_VII-0017
The industrial regions and forest fires constitute the main
* In addition, soot may be supplied by volcanic eruptions.
source of soot*, but since these sources are far removed from the
arctic, the impurities will normally have been removed, either
through precipitation or sedimentation, before the air arrives in
the arctic.Observations show that the air normally contains considerable
amount of salts. Through the action of the winds, spray is whirled
up from the oceans, and when the spray droplets evaporate the salt
remains in the air. These minute salt particles constitute highly
effective nuclei of condensation, and are, therefore, washed out
of the air through the precipitation processes.The arctic air masses are, therefore, characterized by ex–
tremely low values of turbidity, and this influences the visual
range very greatly. In the arctic, the sky, when clear, is
characterized by the brilliance of stars during periods of darkness,
012 | Vol_VII-0018
and by intense blueness during periods of light or dusk. Distant
objects (e.g., mountain ranges) stand out with great clarity in
shape and detail.The purity of the arctic air is noticeable even in low and
middle latitudes when these regions are invaded by arctic air masses.
As has been shown by Bergeron [ 3 ] , the opalescent turbidity can
be used as a means of indentifying traveling air masses, and this
technique has been of importance in the development of the methods
of weather analysis and forecasting.Troposphere and Stratosphere . - Although the state of the atmosphere
is subject to incessant variations, the mean (or normal) state indi–
cates a division of the atmosphere into fairly well-defined layers.
This stratification of the atmosphere is not immediately apparent
in the distribution along the vertical of atmospheric pressure and
density, but it stands out clearly in the distribution of tempera–
ture.Fig. 5 Some typical examples of the distribution along the vertical
of the air temperature are shown in Fig. 5, which is reproduced
013 | Vol_VII-0019
from a recent publication of the Canadian Meteorological Service [ 27 ] .
Disregarding for the moment the conditions near the earth’s surface,
it will be seen that the temperature decreases with elevation at a
fairly regular rate of about 60°C per km. (10°F per 3,000 ft.) up to
about 8 km. (26,000 ft.) in winter and to about 10 km. (33,000 ft.)
in summer. At higher levels the temperature is either constant or
increases slightly with elevation.The lower part of the atmosphere, in which the temperature de–
creases with elevation, is called the troposphere , and the upper
part, in which the temperature is constant or increases with eleva–
tion, is called the stratosphere . The transition from the tropo–
sphere to the stratosphere, which usually is quite distinct, is
called the tropopause .The examples shown in Fig. 5 represent the conditions on the
fringe of the arctic. In the central part of the arctic region
still lower temperatures would be observed, particularly in the
lower half of the troposphere.
014 | Vol_VII-0020
Fig. 6 Fig. 7 The mean thermal structure of the atmosphere up to 20 km.
(62,000 ft.) above sea level is shown in Figs. 6 and 7 for winter
and summer respectively. These diagrams represent the mean con–
ditions for 18 meridional sections at intervals of 20 degrees
starting from Greenwich meridian. The observational material used
for the construction is that contained in “The Normal Weather Maps”
[ 47 ] . The northernmost parts of the diagrams are largely based
upon extrapolations and tests for consistency. Although this may
have led to errors in detail, there can be little doubt that the
diagrams represent the essential features of the thermal structure.Considering first the conditions in January, it will be seen
that the mean positions of tropopause, which is found at about
8 km. (26, 000 ft.) in the polar region, rises slowly southward to
about 50°N, and then rises at a rapid rate to about 25°N, where it
becomes horizontal at about 17 km. (56,000 ft.).It will be seen from Fig. 6 that there are five regions in the
atmosphere (below 20 km.) which are characterized by extreme tempera–
tures. The coldest region is found at about 17 km. (56,000 ft.)
015 | Vol_VII-0021
above sea level in the equatorial belt, where the mean temperature
is about −75°C (−105°F). The next coldest region is found in the
vicinity of the arctic tropopause, where the mean temperature is
about −63°C (−81°F). The third coldest region is found at the sur–
face over the arctic fields of snow and ice, where the mean tempera–
ture varies between −25 and −41°C (−13 and −42°F). This lower cap
of cold air is separated from the upper cold region by a layer of
relatively warmer and fairly uniform air with temperatures in the
vicinity of −26°C (−13°F) at about 2 km. (6500 ft.) above the ice.In contrast to these cold regions we find two warm regions,
one at low levels near the equator, and a second in the troposphere
in subpolar latitudes.In summer (Fig. 7) the conditions are largely the same as in
winter, except that the cold regions in the arctic are less distinct.
In all seasons, the temperature in the troposphere decreases north–
ward, whereas in the stratosphere the temperature decreases, on the
whole, from the arctic toward the equator.
016 | Vol_VII-0022
Fig. 8 The annual variation of temperature, as a mean for all meridians,
is shown in Fig. 8. It will be seen the maximum variation occurs
at low levels in the arctic. This variation decreases rapidly with
elevation and reaches a minimum of about 20°C (36°F) at about 3 km.
(10,000 ft.) above which level there is a slight increase up to
about 5-6 km. (16,000-20,000 ft.) and then a rapid decrease up to
10 km. (33,000 ft.) which is the mean summer position of the tropo–
pause. In the stratosphere the annual variation is relatively small.
Considering the conditions level for level, the annual variation of
temperature of the free atmosphere decreases from the pole to the
equator. The same is true of the conditions at the earth’s surface
if one considers the mean for all meridions It should be noted,
however, that the annual variation near the earth’s surface is
larger in Northern Russia, Siberia, and Canada than it is at the
pole (see p. ).At heights greater than those shown in Figs. 6-8, ordinary
observations are so sparse that the meridional structure and annual
017 | Vol_VII-0023
variation cannot be evaluated with much confidence. From observa–
tions of meteors and sound waves and from a few direct observations
by rockets and sounding balloons it is possible to piece togather
a picture of the broad features of the uppermost atmosphere, and
these may be summarized as follows. The stratosphere is almost
isothermal up to about 35 km. (21 miles); above this level the
temperature increases rapidly and reaches a maximum of about 75°C
(167°F) at a height of about 60 km. (37 miles) whereafter it de–
creases to about −25°C (−13°F) at about 80 km. (50 miles). This
warm layer is sometimes called the mesosphere.Above the mesosphere lies the ionosphere which extends up to
great heights and merges gradually with empty space. The ionosphere
is characterized by free electric charges. Some of the gaseous par–
ticles are broken down into ions and free electrons by absorption of
the ultraviolet radiation from the sun, which also causes a dissocia–
tion of oxygen and nitrogen molecules into their atomic forms and
causes very high temperature at extreme heights. The ionosphere
018 | Vol_VII-0024
is the abode of the aurora borealis; it is divided into several
layers that reflect radio waves in various wave lengths.
019 | Vol_VII-0025
INVERSIONS AND LAPSE RATES
Fig. 9 Although the temperature normally decreases with height in the
troposphere as a whole, the lower part of the arctic region forms
an exception (see Fig. 6). Here the temperature normally increases
from the earth’s surface up to a distance which rarely exceeds 2 km.
(6,000 ft.) and sometimes may be as low as 200 m. (600 ft.) or less.
Some examples are shown in Fig. 9.The rate at which the temperature decreases with elevation is
called the lapse rate . A layer through which the temperature in–
creases with elevation is called an inversion , and such layers are
characterized by counterlapse . The base of the inversion is the
level where the counterlapse commences, and the top of the inversion
is the level where the counterlapse changes into a lapse of tempera–
ture.It is convenient to compare the observed lapse or counterlapse
with the adiabatic lapse rate, which is the rate at which a unit of
air would cool if it were thermally isolated and lifted against the
gravitational force. The adiabatic lapse rate, which is a critical
020 | Vol_VII-0026
value for many processes, is expressed by the formula
Γa = g/Cp
where g is the acceleration of gravity and Cp the specific heat
of air at constant pressure. Substituting the numerical values for
g and Cp, it is found that Γa =1°C per 100 m. = 5.5°F per 1000 ft. for nonsaturated
air.Above the top of the inversion the lapse rate is normally about
1/2 to 2/3 of the adiabatic rate. Occasionally, the adiabatic rate
may be approached, but it is never exceeded by any appreciable
amount.In the inversion layer, the counterlapse may be very large;
numerical values as high as 5°C per 100 m. are quite common, and
close to the snow surface values as high as 1°C per meter are not
uncommon, particularly in calm and cloudless conditions in winter.In calm air or when the winds are light the base of the
inversion is found at the earth’s surface. However, when the wind
021 | Vol_VII-0027
Fig. 10 is sufficiently strong, friction along the earth’s surface causes
the lower layer to be mixed, and a normal lapse rate is established
in the lower layer while an inversion may be present at some distance
above the surface. These elevated inversions are usually less
intense than the ground inversions. Sverdrup [ 43 ] investigated
the occurrence of inversions by the aid of kites carrying instruments.
Since kites could be used only when the wind speed was sufficiently
high, his results (Fig. 10) apply to elevated inversions. It will
be seen that the inversion is lower in winter than in summer.Fig. 11 The intensity of the inversion increases with decreasing could
cover, and the most intense inversions occur after spells of calm
and clear weather. An example of the dependence of the inversion
on wind speed and cloud cover is shown in Fig. 11, which is reproduced
from a recent publication by the Canadian Meteorological Service
[ 27 ] .The inversions are most strongly developed over land and ice.
When the arctic air streams over open water of appreciably higher
temperature (e.g., in winter), the inversion is destroyed through
022 | Vol_VII-0028
heating of the surface layer. In such cases, an adiabatic, or
even superadiabatic, lapse rate develops above the water surface.
The same is true of arctic air that invades warm continents in
summer.From the foregoing discussion it follows that the central
arctic is characterized by a well - developed inversion layer, and
that along the fringe of the arctic extreme variations occur, with
changes from large counterlapses to the adiabatic or superadiabatic
lapses.The processes leading to the formation and maintenance of the
arctic winter inversions have been investigated by Petterssen [ 32 ]
and Wexler [ 53 ] . These involve the general circulation of the
atmosphere and the radiative and eddy flux of heat.The snow surface, being an efficient radiator, will lose heat
toward space, and the air in contact with the snow will cool faster
than the air aloft. The snow surface will, therefore, act as a cold
source relative to the overlying layer of air. Since the atmospheric
023 | Vol_VII-0029
pressure over the arctic is higher than over the adjacent oceans
(heat sources), the distribution of heat and cold sources is such
as to constitute a hindrance to the circulation, and a layer of
stagnant air develops over the arctic snow and ice fields. Since
the air is stagnant, it becomes subjected to continued cooling from
below. As the surface layer becomes very much colder then the over–
lying air, downward radiative flux of heat will tend to balance
the cooling of the ground. The maximum difference in temperature
between the top and the base of the inversion, which depends upon
the contents of moisture and carbon dioxide of the air, has been
determined by Wexler to be about 30 °C ( 54 °F), and this
value agrees well with observation.In summer the conditions are largely similar to those in winter,
except that the cold source is due mainly to the melting of snow,
while the air at higher levels is heated by radiation.If the wind is sufficiently strong, the radiative cooling of
the surface layer will be offset by the downward eddy flux of heat,
024 | Vol_VII-0030
and the inversions become weaker, or may disappear temporarily and
locally. If the sky is cloudy, the back - radiation from the clouds
will have a similar effect.The arctic inversions are of great importance in many ways,
notably in connection with propagation of sound and light.
025 | Vol_VII-0031
ACOUSTIC PHENOMENA
No one who has lived in the arctic can have failed to observe
the frequent occurrence of supernormal audibility and the wide
variation in the audible range. For example, Captain Perry [ 35 ] ,
on his third voyage, noted a case where conversation was carried on
over a distance of 1.2 miles, and Collinson [ 9 ] reported on a
case where spoken words were heard at a distance of 2 miles. The
most extraordinary case of abnormal sound effects in the arctic is,
perhaps, the one described by Wegener [ 52 ] . On the Danish Green–
land expedition, 1907-08, observers at Pustervig, on the northeast
coast of Greenland, heard a tone of deep pitch (estimated at about
30 c.p.s.) which lasted for several hours and appeared to emanate
from a closed fjord called Dove Bay. This sound was heard on several
occasions when the fjord was filled with cold stagnant air.These abnormal sound effects can readily be explained by
reference to the structure of the arctic atmosphere and the properties
of the snow and ice.The range at which sound can be heard depends upon the temperature
026 | Vol_VII-0032
of the air, the speed and direction of the wind, and the rate at
which sound energy is absorbed by the earth’s surface.1. Influence of Snow and Ice . - It is well known that soft
snow falling through the air absorbs sound energy very effectively.
The same is true of soft snow on the ground. On the other hand,
a hard crusted snow surface absorbs but little energy, and a smooth
ice surface is an almost ideal reflector of sound. The rate at
which sound energy is absorbed depends upon the pitch. Kaye and
Evans [ 22 ] measured the absorbtion coefficient of newly fallen
snow in England and found the values reproduced in Table III. ItTABLE III. Absorbtion Coefficient of Newly Fallen Snow . Snow depth
inchesFrequency (c.p.s.) 125 250 500 1000 4000 1 0.15 0.40 0.65 0.75 0.85 4 0.45 0.75 0.90 0.95 0.95
will be seen that for a pitch higher than 500 cycles per second, a
snow cover 4 inches, or more, deep absorbs almost all sound energy.
Although comparable figures for hard snow surfaces are not available,
027 | Vol_VII-0033
it is evident that the absorbtion coefficient decreases rapidly
with the hardness, and is almost negligible for a smooth ice sur–
face. The audible range will, therefore, be short over a soft snow
surface, relatively large over hard snow, and excessively large
over ice fields.2. Influence of air temperature . - One of the major causes of
the supernormal audible range in the arctic is due to the distribution
of temperature, and in particular to the inversion layers described
in the foregoing section. Let C denote the speed of propagation
of the sound, and T the absolute temperature of the air. In still
air, the velocity of sound is proportional to the square root of the
absolute temperature. We may, therefore, write
C = A√(T)
where A is a constant for any given composition of the air. The
minor variations in composition, discussed in a foregoing section,
are too small to have any noticeable effect on the speed of propa–
gation
028 | Vol_VII-0034
Although the air temperature may very vertically as well as
horizontally, the latter variation is usually negligible in com–
parison with the former, and as shall here be concerned to discuss
only the influence due to the variation along the vertical.We consider first the idealized case when the temperature is
uniform in all directions (isothermal conditions). The speed of the
sound would then be uniform, and the “sound front” would be a
spherical shell expanding with a constant speed.Fig. 12 Instead of the “sound front” it is more convenient to consider
the “sound beams” or “sound rays”. These are represented by lines
originating in the sound source and being everywhere perpendicular
to the sound front. The sound rays in an atmosphere of uniform
temperature are shown in Fig. 12A, where the sound source is at
the earth’s surface. The rays are straight lines through the source.
Since the energy of a sound impulse is distributed uniformly on a
spherical surface, it is evident that the sound intensity must be
inversely proportional to the square of the distance from the
source, or
029 | Vol_VII-0035
I = I1/R2
where I 1 is the intensity at unit distance from the source, and
I is the intensity at the distance R from the source. In the fol–
lowing, we shall refer to eq. (2) as the inverse square law.Let us now consider the case when the temperature decreases
along the vertical, as it normally does in middle and low latitudes.
The sound will travel faster in the horizontal than in the vertical
direction. The sound front will no longer be spherical, and the
sound rays will be curved upward as shown in Fig. 12B. The beams
that leave the source horizontally will lose contact with the earth’s
surface, and in the space below these beams, a sound shadow will be
found. This shadow refers to the beams, or the direct sound. A
certain amount of sound is, however, diffracted across the beams
into the shadow, but the intensity of this sound is small and it
decreases at rate which exceeds the inverse square law.The conditions represented in Fig. 12B being typical of middle
and low latitudes, it is evident that most people’s experience
030 | Vol_VII-0036
about sound from distant sources is based upon the rather faint
sound which is diffracted into the beam shadow. Above the beam
shadow, the beams are more concentrated in Fig. 12B than they are
in Fig. 12A, with the result the intensity of the sound is corre–
spondingly increased. It will, thus, be seen that when the tem–
perature decreases along the vertical, the sound tends to escape
upward, and but little energy is transmitted along the earth’s
surface.As was shown in the foregoing section, inversion layers are
almost always present in the arctic. We shall, therefore, consider
this case in some detail. Since the temperature increases upward
through the inversion layer, the sound will travel faster vertically
than horizontally; the wave front will now be elongated upward, and
the sound beams will be curved downward. Fig. 12C shows the rays
from a sound source ( ) at the earth’s surface when tempera–
ture distribution is as shown to the right of the beams. It can
easily be shown that a beam that leaves the source at certain
critical angle will become tangent to the top of the inversion
031 | Vol_VII-0037
layer where it splits, one branch (b) being curved downward and
the other branch (c) being curved upward. This critical angle
depends entirely upon the temperature difference between the top
and the base of the inversion, and is independent of the depth of
the inversion layer. The space between the beams b and c in
Fig. 12C is silent as far as direct sound is concerned.The beams that leave the source at angles less than the critical
value, will be refracted toward the earth’s surface. A considerable
portion of this sound is, again, reflected from the earth’s surface,
and this together with sound that is diffracted across the beams
will penetrate into the part of the shadow that is below the top
of the inversion. On the other hand, beams that leave the source
at angles greater than the critical value, will penetrate the in–
version and escape into space.Referring again to Fig. 12C, it is of interest to note that
the concentration of the beams is larger in the inversion layer and
less above this layer than in the radial case shown in Fig. 12A.
032 | Vol_VII-0038
From this it follows that the sound intensity below the top of the
inversion decreases more slowly than indicated by the inverse square
law; above the top of the inversion, the reverse is true.We shall next consider Fig. 12D which illustrates the con–
ditions when the sound source is above the top of the inversion.
The inversion layer will now act as a hindrance to the propagation
of sound toward the earth’s surface. Except where the sound source
is directly overhead, or nearly so, very little sound energy reaches
the earth’s surface. Thus, an aircraft flying above the top of
the inversion is not readily detected by acoustic means.From the foregoing discussion it follows that an inversion
layer acts as a duct for sound emanating from sources below its top,
and as a cushion against sound that emanates from sources above its
top. Neither the duct nor the cushion is perfect, and their
efficiency (in still air) depends upon the intensity of the inver–
sion.The sound intensity may become greatly supernormal when the
sound source is situated below an inversion in a fjord (or valley)
033 | Vol_VII-0039
surrounded by steep walls. If the fjord is frozen and the mountain
sides covered by hard snow, an almost ideal sound channel is estab–
lished, sound being reflected from the ice, the mountain sides and
the top of the inversion. If the fjord has a local contraction, a
basin is formed which, when the dimensions are suitable, may form
a resonant box. The case described by Wegener (loc. cit.) apparently
belonged to this category of sound effects.Although the mean state of the lower arctic atmosphere is
characterized by one inversion layer (see Fig. 6), multiple inver–
sions occur quite frequently, particularly over and near arctic
land masses (e.g. Greenland). The sound effects associated with
multiple inversions are extremely complex, and several zones of
shadow and zones of maximum intensity may occur, depending upon the
position of the source. Fig.12E shows, as an example, the sound
pattern of a source situated between two inversions. It will be
seen that the sound tends to become trapped between the top of the
lower and the base of the upper inversion, and that several shadow
zones may result.
034 | Vol_VII-0040
3. Influence of wind . - If V denotes the speed of the wind,
the velocity of sound can be expressed by the formula
C = A√(T) + V
which is the same as the velocity in still air plus the velocity of the
medium through which the sound travels. Now the former of these
velocities is of the order of 300 m/sec. (700 mph) while the latter
is of the order of 10 m/sec. (20 mph). The direct influence of the
wind is, therefore, very small if the wind is uniform in all direc–
tions.Owing to friction along the earth’s surface, the wind increases
with elevation up to about 500-1000 m. (i.e., 1500-3000 ft.). Al–
though the increase varies with the roughness of the ground, the
wind speed over a snow surface will normally be twice as large at
about 600 m. as is at 10 m. above the ground. Above this layer,
which is called the friction layer, the wind may increase or de–
crease with elevation depending upon the horizontal temperature
gradient.The variation along the vertical of the wind has a marked
035 | Vol_VII-0041
influence on the propagation of sound. To demonstrate the nature
of this influence, we consider Fig. 12F, in which it is assumed
that the temperature is uniform along the vertical, while the wind
distribution is as indicated to the left. The beams that go down–
wind will be curved toward the earth’s surface. A beam that leaves
the source at a certain critical angle, will just touch the level
where the wind becomes uniform, and at greater distance from the
source, a sound shadow will be found below this level. The beams
that go upwind will be curved away from the earth’s surface, above
which another sound shadow is found. The greatest concentration of
sound beams is found in the downwind direction in the layer where
the wind increases, and it is here that the supernormal audibility
is observed.In the arctic both the wind and the temperature will normally
increase with elevation through the friction layer, with the result
that both effects combine to give supernormal sound intensity down–
wind. In the upwind direction, the temperature effect is counter–
acted by the wind effect, and except when the wind is very light,
036 | Vol_VII-0042
the wind effect predominates.4. Sound ranging . - From the foregoing discussion it follows
that for any given source intensity the audible range depends upon
the curvature of the sound beams in the vertical plane, and this
curvature is determined by the distribution along the vertical of
temperature and wind. Provided that soundings of temperature and
wind are available, the path of the sound beams can be reconstructed
and the position of the sound source identified. A convenient
method of sound ranging has been developed by Bedient [ ] .For further information on propagation of sound in the atmosphere,
reference is made to the works of Wa e lchen [ 50 ] , Rothwell [ 36 ] ,
Whipple [ 55 ] , Gutenberg [ 15 ] , and Saby and Nyborg [ 37 ] .
037 | Vol_VII-0043
OPTICAL PHENOMENA
In addition to the aurora borealis, the abode of which is in
the ionosphere (see pp ), the sojourner in the arctic
will observe a number of optical phenomena of great beauty and in–
tensity. Some of these, such as the rainbow, the corona and the
halo, are not essentially different from those observed in middle
latitudes and will not be described here. The optical phenomena
which are most typical of the arctic and of some importance to the
arctic traveler are the mirages which are due to abnormal bending
of the light rays, and the ice blinks and the water sky which are
due to reflection of light from ice and water surfaces by the lower
face of a cloud layer.The mechanism of the formation of mirages is readily explained
by reference to the fact that light travels slightly faster in thin
air than it does in denser air. Thus, since the air density decreases
with elevation (except in very rare cases), a slant beam of light
will be curved downward, and this curvature depends upon the rate
at which the density decreases across the beam. In the following
038 | Vol_VII-0044
we shall be concerned to discuss the bending of light beams between
points on the surface. Since these beams are quasi-horizontal it
suffices to consider the lapse of density along the vertical.Using the equation of state and the hydrostatic relationship,
it is readily shown that the rate of decrease of density (p )
with height (z) is expressed by
-(∂p/∂z) = (p/RT2)((g/R) – Γ)
where p denotes pressure, T absolute temperature, Γ lapse rate
of temperature, R the gas constant, and g the acceleration of
gravity.Since g and R are physical constant and p varies but
little in any given place, it will be seen that the lapse rate of
density (and the refractive index) is determined almost exclusively
by the temperature conditions.Travelers in the arctic have noticed a marked annual variation
in the optical phenomena, and this can readily be explained by
reference to equation (1). Let us assume for the moment that the
039 | Vol_VII-0045
lapse rate of temperature is the same in winter as in summer.
Under typical arctic conditions the absolute temperature would be
about 275°A in summer and about 230°A in winter. It is then readily
seen that the refractive index is normally about 40 per cent greater
in winter than in summer. In addition to this effect of the annual
variation of temperature there is a large annual variation in the
lapse rate of temperature (see Fig. ), with the result that
the refractive index may vary several hundred per cent during the
annual cycle. In fact, the largest variations are due to the change
in lapse rate of temperature.As was shown in a foregoing section (p. ) the temperature
of the troposphere normally decreases with elevation such that
= 0.6°C per 100 meters (or 3.3°F per 1000 ft.), and this
together with the first term within the parentheses of eq. (1)
accounts for the normal refraction of light in the atmosphere. In
the arctic, however, the lapse rate may vary within very wide limits,
thus giving rise to abnormal bendings of the light beams.
040 | Vol_VII-0046
1. The superior mirage occurs in connection with temperature
inversions (p. ). In the inversion layer the temperature in–
creases with elevation, and the lapse rate of temperature (i.e., )
is negative. It will then be seen from formula (1) that the den–
sity decreases along the vertical at an abnormally fast rate, with
a consequent abnormal downward refraction of the light beam. An ob–
ject seen through the inversion layer will become distorted so that
it appears elongated in the vertical direction. For example, a
relatively flat strip of coast land may appear as an erect strip
and give the false impression of being a steep cliff; irregulari–
ties in the coast line will appear like columns, and the distor–
tions produce a picture which resembles architectural pseudo–
prostyle. In pronounced cases, the erect image is surmounted by
an inverted image, and in rare cases the inverted image is, again,
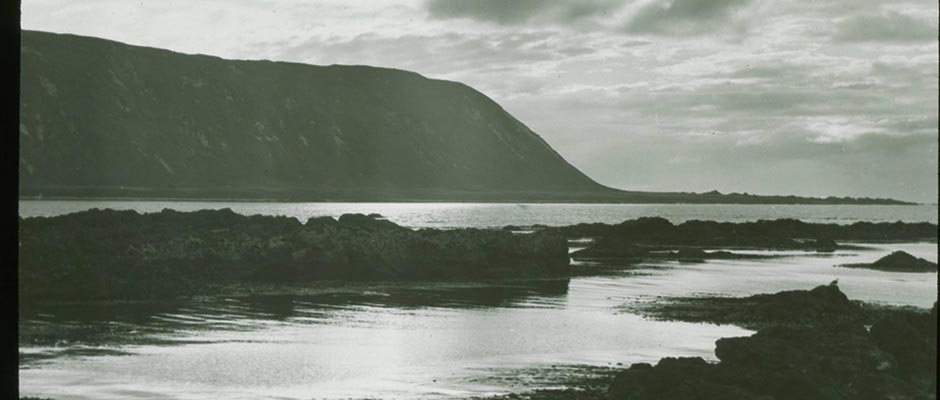
surmounted by second erect image.Fig. 13 An example of a superior mirage is shown in Fig. 13. The
upper picture shows the natural shape of Gundahl’s Knold while the
lower picture shows strong vertical distortion due to the presence
041 | Vol_VII-0047
of an intense inversion.The superior mirage may occur without inverted image and dis–
tortion, in which case objects which are actually below the obser–
ver’s true horizon will appear above his apparent horizon. This
phenomenon is called looming. This, together with the pronounced
purity of the arctic air (p. ), probably accounts for many
instances of erroneous estimates of distances and reports of dis–
covered land masses and mountains in places where none exist. In
1818 Captain John Ross saw snow-covered peaks in Lancaster Sound
(74°N, 85°W), at an estimated distance of thirty miles, which appeared
to bar his way into the Northwest Passage. Subsequent explorations
have made it evident that the peaks seen by Ross were those of
North Somerset Islands (73°N, 93°W) at a distance of about 200
miles. Pearly and his companions clearly saw on two occasions in
1906 an extensive mountainous snow-covered land northwest of Cape
Colgate (82°N, 91°W) in Grant Land at an estimated distance of 130
miles, and named it Crocker Land. In 1914 MacMilland and Green
042 | Vol_VII-0048
sighted Crocker Land and sledged 130 miles in its direction, seeing
the mountains once on the journey but never reaching them. The
exact location of Crocker Land is still a mystery, and it appears
certain that the sightings were caused by looming of unusual in–
tensity.The distance over which an object may loom depends upon the
height of the inversion and the difference in temperature between
the top and the base of the inversion. In calm and cold weather
the inversions are likely to be deep and intense; distances esti–
mated in such conditions are likely to be much in error.It is of interest to note that looming is a local phenomenon;
at some point closer to the loomed object than the observer, the
object will not be visible. The effect may be likened to the
“skipping” of radio waves which permits reception close to the
transmitting station and at considerable distance from it, but not
at intermediate distances. As a consequence of this, it is readily
seen that for an aircraft that sees a loomed sun, there must be
points both above and below the aircraft for which the sun will
043 | Vol_VII-0049
Fig. 14 have set, and twilight will prevail both above and below an
aircraft illuminated by the loomed sun. These conditions are shown
diagrammatically in Fig. 14.2. The inferior mirage forms when the temperature decreases
with elevation at an excessive rate. These mirage, which are
common occurrences is southern deserts, may be observed locally in
the arctic, particularly where cold air from the ice fields is
heated by streaming over open water, or where bare land adjacent
to ice, is heated in sunshine. The superheated layer is usually
quite shallow (4 to 10 ft.), and within it the lapse rate of tem–
perature is large and positive. It will be seen from formula (1)
above that the density decreases with elevation at a subnormal rate;
in extreme cases whenis greater than g/R, the lapse of[Math Formula]
density is reversed, and the light beams may be curved away from
the earth’s surface. In such cases, the true horizon disappears,
and an apparent horizon is formed below the true horizon leaving
a gap between the apparent horizon and the inferior mirage of objects
044 | Vol_VII-0050
Fig. 15 above the true horizon. An example of an inferior mirage is shown
in Fig. 15.As with the superior mirage, the inferior mirage results in
a change in the apparent distance of objects. In the case of in–
ferior mirage, the effect is that of disappearance over the apparent
horizon of previously seen objects which are known to be above the
true horizon. This phenomenon is called sinking.Fig. 16 Fig. 17 3. The Fata Morgana is a combination of superior and inferior
mirage occurring when a superheated layer is surmounted by a
single or multiple inversion. Two examples of these extraordinary
optical distortions are shown in Figs. 16 and 17. A most vivid
account of such deformations has been rendered by Koch [ 23 ] in
the description of his journey across Greenland on 12 April 1913.4. Optical haze , or shimmer, occurs in a layer of air next
to the ground within which the lapse rate of temperature is ex–
cessive. Within this layer small-scale convective currents develop
with the warmer lumps of air ascending and the colder descending.
045 | Vol_VII-0051
The differences in the refractive index of these lumps cause a
blurring of objects seen through the layer. Optical haze occurs
quite frequently in the arctic in the same meteorological condi–
tions as the inferior mirage; it makes it difficult to identify
details in the landscape and is annoying for telescopic observa–
tions, particularly range finding by the aid of coincidence range–
finder.5. Ice blink and water sky . - In the summer season (when the
sun is above the horizon at a small angle of elevation) light is
reflected and scattered between the ice surface and the base of
low layers of clouds. The whitish glare that is often seen on low
clouds is due to refection of light from distant ice fields. Some–
times, these reflections are quite intense and are thus called ice
blink. Conversely, if there are patches or lanes of open water in
the ice, dark patches or lanes will be seen on the base of cloud
layers. This is called water sky. Observations on water sky and
ice blink are extremely useful for navigation on the ice, for they
indicate, as if seen in a mirror, what lies beyond the horizon.
046 | Vol_VII-0052
AIR MASSES AND FRONTS
The concept of air masses, introduced by Bergeron [ 3 ] ,
is much used in modern meteorology and denotes a vast body of air
whose physical properties are more or less uniform in the horizontal
direction. The air, being almost transparent relative to high–
temperature radiation, absorbs only a small portion of the direct
solar radiation, and the earth’s surface, which is an efficient
absorber, takes up a large portion of this radiation, converts it
into sensible heat and gives it back to the atmosphere, partly
through low-temperature radiation but mostly through eddy motion,
or mixing. Consequently, the physical properties of the earth’s
surface constitute a predominant factor in the formation of the air
masses.The air masses typical of the arctic region in winter are
characterized by low temperature at all levels, extreme absolute
dryness and excessively stable stratification. Some examples of
typical winter conditions are shown in Table IV. It will be seen
that the relative humidity at high levels is very low; this condition
047 | Vol_VII-0053
TABLE IV. Typical Temperature (T) and Relative Humidity (R) of
Arctic Air Masses in WinterEureka Sound
(8 ft. above MSL)
Jan. 19, 1949.Fairbanks
(440 ft. above MSL)
Jan. 14, 1949International Falls
(1112 ft above MSL)
Jan. 28, 1949.Height T(°C) R (%) T(°C) R(%) T(°C) R(%) Station level −45.0 25 −32.8 42 −17.2 68 2,000 ft. −25.4 50 −18.1 68 −17.2 67 4,000 ft. −24.8 54 −17.5 75 −15.7 67 6,000 ft. −23.4 35 −17.0 67 −14.0 32 8,000 ft. −21.8 24 −20.6 53 −13.7 40 10,000 ft. −24.9 - −22.6 28 −14.0 31 15,000 ft. −35.1 - −31.4 - −19.3 32 20,000 ft. −44.7 - −40.5 - 29.3 -
048 | Vol_VII-0054
is due to the circumstance that the air, on account of radiative
cooling aloft, takes part in a sinking, or settling motion. As
a result of this prevailing sinking motion and relative dryness,
high clouds are extremely rare over the central arctic in winter
(see p. ).Fig. 18 The source region of arctic air masses in winter is shown in
Fig. 18. On the North American and on the Eurasian sides it borders
onto the source regions of polar continental air masses. These
latter air masses are in many respects similar to the arctic regions,
except that the air masses are more shallow and have less extreme
properties.It will be seen from Fig. 18 that warm air from the North
Atlantic (polar maritime air) normally invades the arctic in the
region between Iceland and Norway as far east as Novaya Zemlya.
Less frequently, warm air from the Pacific invades the arctic along
the west coast of Alaska. On the other hand arctic air invades the
midlatitude belt most frequently over the eastern parts of North
America and Siberia. On the whole, more arctic air is shed
049 | Vol_VII-0055
southwards than warm air northwards at low levels, the differences
being made up by an excess of northward transport of warm air at
greater heights in the troposphere.The southward flow of arctic air is by no means a steady one;
it appears to occur in outbursts of considerable strength, at in–
tervals of 3 to 10 days, the outburst being associated with intense
traveling cyclones. These outbreaks of arctic air may sometimes
reach as far south as 25°N, and are the main cause of cold spells
in low latitudes. The preferred regions for these outbreaks of
arctic air are the eastern part of North America and the western
part of the North Atlantic, and the eastern part of Siberia and the
adjoining part of the North Pacific.Fig. 19 In summer the arctic source region is less effective, owing
to the sun’s being above the horizon, and the contrast between the
arctic and neighboring air masses is less extreme. The source region
of arctic air masses in summer is shown in Fig. 19 in relation to
neighboring sources. Some examples of typical arctic air masses in
050 | Vol_VII-0056
summer are given in Table V. On the whole, the relative humidity
aloft is higher in summer than in winter, and, as a result, the
amount of high clouds reaches a maximum in the warm season.Fig. 20 Fig. 21 Fig. 22 The transition from the arctic to the neighboring air masses
is usually not continuous. The mean circulation of the atmosphere
is such that there is a tendency for the air masses from neighboring
source regions to be brought together along zones of convergence,
Along these zones of convergence, which are called fronts , or
frontal zones, more or less abrupt transition in wind, temperature,
humidity, and weather will be found. The mean positions of these
principal frontal zones are shown in Figs. 20 and 21 for winter
and summer respectively. It will be seen that, on the average,
the arctic front is not continuous around the pole; it is normally
absent in the preferred regions of outbreaks of arctic air. A
schematic meridional cross-section of the principal air mass sources
and frontal zones is shown in Fig. 22.
051 | Vol_VII-0057
TABLE V. Typical Temperature (T) and Relative Humidity (R) of
Arctic Air Masses in SummerEureka Sound
(8 ft. above MSL)
July 1, 1950.Fairbanks
(440 ft. above MSL)
July 20, 1946International Falls
(1112 ft. above MSL)
July 12, 1946.Height T(°C) R (%) T(°C) R(%) T(°C) R(%) Station level 7.2 61 14.0 88 17.0 70 2,000 ft. 3.5 62 10.2 88 17.6 59 4,000 ft. −0.3 64 5.3 92 12.5 59 6,000 ft. −4.2 59 1.8 92 10.5 22 8,000 ft. −7.9 63 −0.6 98 8.3 - 10,000 ft. −11.0 66 −2.9 100 5.3 - 15,000 ft. −18.3 86 −10.8 16 −2.0 20 20,000 ft. −28.1 62 −20.5 58 −11.6 -
052 | Vol_VII-0058
CYCLONES AND ANTICYCLONES
The frontal zones discussed in the foregoing section are
rarely stable. On account of the contrasts in energy stored along
frontal zones, perturbations (known as cyclones, depressions, or
lows) develop and travel along the frontal zones, generally from
the east to the west with a component toward the north. In the
areas between the cyclones, regions of high pressure, or anti–
cyclones, develop and travel, generally eastward with component
toward the south. Most of these traveling cyclones remain in the
sup-polar belt and affect the fringe of the arctic region; some
of them, however, move into and cross the arctic.Fig. 23 An example of such a chain of fronts, cyclones and anticyclones
around the arctic is shown in Fig. 23. It will be seen that, on
this occasion, the arctic front is well developed over North
America and over northern Siberia. The polar front, too, is well
developed, more or less in its normal position. A series of cy–
clones is associated with the frontal systems, with anticyclones
in between.
053 | Vol_VII-0059
Fig. 24 As compared with middle and low latitudes, the arctic region
is a relatively quiet area as far as traveling disturbances are
concerned. The mean meridional distribution of frequencies of
cyclogenesis (formation of cyclones), cyclones, anticyclogenesis
(formation of anticyclones), and anticyclones is shown in Fig. 24
as a mean for all longitudes.In summer most anticyclones form about 50°N and move southward
such that their mean position if about 38°N. There is, however,
a secondary maximum of anticyclogenesis at about 75°N and a rela–
tively large maximum north of this latitude. It will further be
seen that most cyclones form about in latitude 50°N and move such
that their mean latitude is about 60°N. It has been shown by
Petterssen [ 32 ] that this poleward tendency of cyclone move–
ment is due to the thermal structure of the atmosphere and the
rotation of the earth.In winter the frequency distribution is, in principle, the
same as in summer. In all seasons the arctic region as a whole
054 | Vol_VII-0060
is characterized by a low frequency of cyclones and a relatively
high frequency of anticyclones.The low frequency of cyclones is not typical of the entire
arctic region. As has been shown by Petterssen [ 32 ] , general
dynamical principles require that cyclonic circulation (vorticity)
must be produced in the cold sources above cold land and ice fields
and exported along isentropic surfaces downward to sea level along
the arctic coast. Hence all the bays of open water along the
fringe of the arctic will be characterized by cyclonic activity.
These areas of maximum cyclonic activity are also regions of
generally bad weather.Fig. 25 Fig. 26 Figures 25 and 26 show the geographical distribution of
cyclone centers in winter and summer, respectively. The following
regions in arctic and subarctic latitudes are characterized by high
frequency of cyclones: The Gulf of Alaska and the Aleutian Chain
(winter and summer), the Baffin Bay and Davis Strait (winter and
summer), the waters south and west of Iceland (winter and summer),
the Norwegian Sea (winter and summer), the Barentz Sea (mostly winter).
055 | Vol_VII-0061
Fig. 27 Fig. 28 The corresponding frequencies of anticyclones are shown in Figs.
27 and 28. It will be seen that winter anticyclones are quite fre–
quent over the central arctic, with a maximum over the north coast
of Alaska. In summer (Fig. 28) anticyclones are rare on the out–
skirts of the arctic, but quite frequent over the ice pack.
056 | Vol_VII-0062
ATMOSPHERIC PRESSURE
Until seventy years ago, all theoretical considerations concerning
the general atmospheric circulation postulated a zonal system of westerly
winds circulating about a low-pressure area centered at the North Pole.
Subsequent expeditionary data on winds and pressures within the Arctic,
however, failed to verify this simple concept. Furthermore, as early as
1888, Helmholtz [ 18 ] had deduced from hydrostatic considerations that
the prevailing low Arctic temperatures should produce a shallow surface
anticyclone in polar regions. As a result of the mounting evidence from
Arctic observations, together with the general acceptance of the Helmholtz
theory, it became popular during the next four decades to consider the
existence of a permanent polar anticyclone even though the details of the
Arctic pressure distribution remained essentially undetermined.
057 | Vol_VII-0063
However, from charts published in 1929 depicting the monthly
averages of temperature, pressure, and cloudiness, Baur [ 1 ] was able to
show that the centers of high atmospheric pressure tended to correspond
closely to the regions of minimum hemispherical temperature. He traced
the movement of the principal Arctic center of maximum pressure (and
minimum temperature) from a winter position in Eastern Siberia to a
position north of the Canadian Archipelago in spring, i.e., at a time
when the sub-Arctic continental regions become relatively warm in comparison
to the Arctic Ocean. He then made note of a continued easterly movement
of the centers to a position northeast of Greenland and Spitzbergen in
early summer. In early autumn Baur found a secondary maximum in pressure
over the Polar Sea which he ascribed to the effects of rapid cooling in
the Canadian Archipelago and adjoining ice pack, but on his series of
charts this center is soon superceded by the Siberian high and a weaker
counterpart over the Yukon Territory.
058 | Vol_VII-0064
The next published series of charts showing the distribution of
pressure over the Arctic was prepared by Sverdrup, Peterson and Loewe
[ 42 ] and drew heavily upon the analyses of Baur, Birkeland and Føyn
[ 1 ] . Dorsey [ 12 ] has more recently revised Sverdrup’s charts upon the
basis of modern observational data. Dorsey also has considered the charts
prepared by Dzerdzeyevski [ 13 ] in 1945 - a series which had made use of
the pressure data obtained near the pole by the Russian North pole Expedition.The charts prepared by Dorsey are apparently the most up-to-date and
figs 29-32 here are the ones presented here as Figures 29 to 32 . While the accuracy of
the pressure field indicated for the Arctic Ocean, Greenland, and the
Canadian Archipelago may be open to some question, it is, nevertheless,
probable that the charts do contain the essential characteristics of the
true pressure field at the surface. The prevailing wind directions usually
agree with the isobars and the locations of the principal cyclone tracks
and frontal systems are in accord with the resulting wind distribution.
059 | Vol_VII-0065
In winter (January, Figure 29 ), the Arctic pressure field is
dominated by the extensive anticyclonic system centered over the Asiatic
Continent and extending as a ridge toward the Chukchi Peninsula and two
very large low-pressure areas - one centered southwest of Iceland and
extending northeastward over the Barents Sea and northwestward over Davis
Strait, and a second centered over the Aleutians and occupying the entire
Bering Sea and Gulf of Alaska. A secondary anticyclone with a central
pressure in excess of 1020 mb is centered over the Mackenzie River Valley.In spring (April, Figure 30 ), high pressure exists over the greatest
part of the Arctic Ocean and it is during this season that pressures reach
their annual maxima over the Canadian Archipelago and northern Greenland.
Meanwhile, the Siberian anticyclone has so weakened in intensity that it
can no longer be discerned in the mean isobaric pattern. The Aleutian
low weakens somewhat during this season but retains approximately the same
position as in winter. The Icelandic low, on the other hand, is very much
less intense and occupies its southernmost position of the year (south
of Greenland).
060 | Vol_VII-0066
During summer (July, Figure 31 ), the pressure gradients at
their weakest over the Arctic. This is to be expected when one considers
that summer is also the season of minimum thermal contrast between polar
and temperate zones. It is during this season that the so-called
circumpolar belt of low pressure is located at its highest latitude. The
Polar Sea during this season is occupied by a true anticyclone as a result
of the contrast between the low surface temperatures over the cold sea
and the relatively higher temperatures which exist at the same time over
surrounding coastal and inland regions. (see Figure 45 .)In autumn (October, Figure 32 ), there is a return to a pressure
distribution which is more typical of winter conditions. The Icelandic
and Aleutian lows increase in intensity as the deep cyclonic disturbances
over the northern North Atlantic and North pacific become more frequent.
Meanwhile, the Siberian high has begun to make its appearance, although
a closed anticyclone still remains over the Arctic Ocean north of Greenland
and the Canadian Archipelago as pointed out in a previous paragraph.
061 | Vol_VII-0067
At this point it should, perhaps, be mentioned that the details
of the pressure distribution over interior Greenland have little meaning
as shown on the sea-level pressure charts. It is possible, on the basis
of theoretical considerations and actual pressure data, to construct an
idealized picture of the pressure field which would obtain over the region
were Greenland not in existence. However, such a picture has no physical
or meteorological significance. Greenland is not merely a positive
topographic feature but it is, in itself, an important air-mass source
because of the altitude and extent of the Ice Cap and because of the
abnormally steep horizontal (and vertical) temperature gradients which
are produced by the temperature contrasts between ice fields and coasts
[ 42 ] . It is because of these facts that there is found to be so little
connection between the pressure field as charted and the wind speeds and
prevailing directions which are recorded for various points over Greenland
or along its coastline.
062 | Vol_VII-0068
Pressure Fluctuations . - The pressure variabilities observed from
day to day at any Arctic location are directly related to the number
and intensity of migratory cyclones and anticyclones which pass near
enough to affect the area (see pages to ). The extreme ranges
occur during winter in connection with intense cyclonic activity and at
most Arctic meteorological stations both the absolute maximum pressures
and the absolute minimum pressures have been recorded during one of the
colder months. For example, the absolute maximum pressure for a Kara Sea
location occurred at Ostrov Domashnii on February 17, 1933 (1058.5 mb),
while the absolute minimum pressure for the same area occurred at Ostrov
Belyi on November 19, 1933 (950.1 mb) [ 45 ] . The average daily variability
of pressure shows a characteristic annual course with the maximum values
in winter (8 to 10 mb) and the minimum values in summer. In some Arctic
areas there appears to be an additional secondary maximum in April. The
monthly pressure variations also show the same general trend as the daily
variations, as is illustrated by the following typical Arctic data [ 43 ] :
063 | Vol_VII-0069
Monthly Pressure Variation (in mbs)
Yrs Location Rec Jan Feb Mar Apr May Jun Jul Aug Sep Oct Nov Dec Arctic Ocean
Fram and Maud5 52.9 53.0 41.0 40.5 32.6 28.1 32.9 27.5 42.8 41.0 44.1 49.4 Central Canadian
Archipelago15 42.7 45.7 39.6 35.5 30.8 26.8 26.1 27.7 33.2 34.1 37.6 42.0
Extreme pressure changes of as much as 50 mb in 24 hours have been recorded
at some stations on the coasts of the Arctic Ocean in connection with the
passage of an intense cyclone or anticyclone.The mean monthly pressure values in individual years and even the
annual pressures for different years may deviate considerably from long–
term averages [ 45 ] . For example, the mean annual pressure at Yugossky
Shar was 1031.1 mb in 1933 and 994.3 mb in 1914. These differences are
completely accounted for by differences in the frequencies of cyclonic
activity between the individual months or years.
064 | Vol_VII-0070
The preceding discussion applies only to true Arctic conditions
In lower latitudes around the periphery of the Arctic, the non-periodic
variations in pressure are of greater magnitude.Pressures in the Upper Atmosphere Pressures in the Upper Atmosphere . - When Helmholtz [ 19 ] deduced the
existence of a polar anticyclone upon the basis of hydrostatic considera–
tions, by the same reasoning he also concluded that low pressure must exit
aloft over the Arctic to compensate for high pressure at the surface. Modern
information concerning pressures aloft over the Arctic verify the basic
concept of Helmholz but the relations between the surface pressure and the
pressure aloft are not as simple as was at first believed. The Siberian
high in winter appears to be a relatively shallow phenomenon and is probably
superceded by relatively low pressures at a comparatively low altitude.
Details concerning the vertical structure of the atmosphere at low levels
over this region are lacking, however. The essentials of the vertical
distribution of pressure elsewhere within the Arctic can probably best be
described by examining the pressure field at the 700-mb level.
065 | Vol_VII-0071
Namias [ 30 ] has recently prepared upper - level charts illustrating
the height of the 700-mb surface over the Northern Hemisphere. His (slightly revised)
January and July charts are given as Figures and , with the altitudes
Figs. 33 and 34 here of the pressure surface represented by isolines plotted for 100-ft
intervals. The January chart (Figure ) shows the pressure field to have
a rather simple structure with two closed low-pressure centers - one over
the southeast portion of the Canadian Archipelago and a second in the
sub-Arctic over the Kamchatka Peninsula. The July chart (Figure 34 ),
on the other hand, shows much weaker pressure gradients than the winter
chart, and the pressures are higher as would be expected on the basis of
the higher surface temperatures. Three closed low-pressure areas are
shown within the Arctic during this season, the most important of which
is centered very nearly over the Pole. This is also an expected condition
when it is considered that the Arctic Ocean is essentially a “cold sources”
during warmer months in the Northern Hemisphere.
066 | Vol_VII-0072
SURFACE WIND
It is extremely difficult to generalize upon the surface wind
field in the Arctic because of several circumstances which are of
peculiar importance at high latitudes. In the first place, the
character of the wind regime at most coastal points and at many
inland locations is largely determined by local factors which are
not amenable to regional generalization. Secondly, the periodic
changes and spa e t ial deformations in the general wind field are no
less variable than are the highly irresolute Arctic pressure distri–
butions which produce the winds in the first place. (See page .)
The third, but not the least important, difficulty is occasioned by
the fact that the scanty observational data available for analysis
do not represent a homogeneous period of record at all points of
observation. For this reason it is often difficult to ascertain
whether the differences in the wind conditions between two weather
stations represent true regional differences in the circulation or
whether they merely indicate that the observations were recorded
during different years — a difficulty which is particularly serious
when wind observations obtained on shipboard within the Polar Sea are
067 | Vol_VII-0073
The General Wind Circulation . - The Arctic circulation is, of course,
dominated by the polar anticyclone which, during all seasons except
winter, is centered somewhere over the Arctic Ocean. So far as can
be determined from the scanty observational materials available, the
prevailing wind directions over the Arctic Ocean and surrounding
coasts appear to correspond to the mean pressure distribution. It is
apparent that easterly winds prevail over the well-explored portions
of the Arctic Ocean, over Iceland, the northern portions of Greenland,
and Alaska, and that northeasterly winds prevail in interior Alaska
and Greenland, all of which fits the prescribed mean pressure field.
(See Figs. 29 to 32 .)Wind conditions over the interior and coastal portions of Arctic
Eurasia, however, appear to be less well-defined. The Siberian anti–
cyclone dominates the interior and coastal circulations during winter,
but during other seasons the winds are regionally highly irregular.
Along the Siberian coasts of the Arctic Ocean in summer there appears
to exist a large onshore wind component resulting from summer heating
over the interior.
068 | Vol_VII-0074
In the more southerly portions of the Arctic, and particularly
in the peripheral maritime regions of frequent cyclone activity, the
surface winds are highly variable and do not exhibit a pronounced
“prevailing” direction. At several stations, for example, the
frequency data show that during the course of a year the winds tend
to blow almost as often from one direction as from any other. In
such regions the non-periodic features of the circulation far outweigh
any periodic or permanent characteristics.The preceding generalization of the Arctic surface circulation
appears to be about as complete a description as possible of the
large-scale aspects of Arctic winds. The remaining periodic and
regional differences in the surface circulation are the result of
local factors which will be described in greater detail.
069 | Vol_VII-0075
Surface Wind Speeds . - A large proportion of the description given
by polar explorers have stressed the prevalence of high winds and have
almost invariably given the impression that the Arctic is indeed a
stormy and inhospitable place. One fairly recent publication on
Arctic weather conditions, for example, presents a 3 1/2 page
discussion of winds and storms and, of this discussion, at least 3
pages describe extreme winds reported by various Arctic expeditions
since 1836. It is true that in some restricted areas within the
Arctic the almost continuous high winds are the most noticeable
feature of the climate. It is also true that excessive winds have at
one time or another been reported from nearly every Arctic observing
station. These circumstances, however, do not suffice to ascribe an
unusual severity to Arctic wind conditions.
070 | Vol_VII-0076
According to Sverdrup / [ 42 ] / , relatively low wind velocities are
characteristic of the Arctic Ocean and Canadian Archipelago. The annual
mean wind speed as recorded over the Polar Sea was only 10 mph during
the Fram Expedition from 1893 to 1896, and 9 mph during the Maud
Expedition of 1922 to 1924. Summarizing the observed conditions,
Sverdrup states, “It is remarkable that very high wind velocities are
so rare.” The highest wind speed observed on Fram was 40 mph,
and on the Maud Expedition, 34 mph; the latter, however, is an hourly
mean value. The Russian North Pole Expedition of 1937 / [ 5 ] ] / found
that high winds occasionally do occur near the North Pole since they
reported from the Pole on June 8 and 9 to the effect that gusts had
attained speeds of 60 feet per second (41 mph).The relative frequencies of high wind speeds at various Arctic
points can be judged from the data on the average monthly number of
days with winds of gale, force, which are presented in Table VI . Table VI here
071 | Vol_VII-0077
Table VI. Mean number of days with “gales”* Station Jan Feb Mar Apr May Jun Jul Aug Sep Oct Nov Dec Ann Yrs Rec Oceanic: 004 5 4 4 3 2 1 ** ** 2 3 5 4 33 .. 006 5 4 3 3 2 4 1 2 4 3 4 4 39 7 007 5 3 3 5 2 3 1 2 7 8 5 7 50 5-6 Alaska, Coastal and Insular: 100 2 1 ** 1 1 0 1 1 2 5 3 2 19 5 101 8 9 8 1 1 .. 1 4 5 11 18 14 .. 0-2 103 14 19 13 7 4 9 9 7 7 10 13 12 121 2 104 4 2 3 3 1 ** ** 1 1 2 1 4 21 10 106 1 2 4 4 7 6 4 6 3 6 4 2 50 6-7 Alaska, Inland: 155 0 2 2 0 0 0 0 0 1 0 1 1 7 1-3 156 1 0 ** ** ** ** 0 0 0 0 0 0 1 10 Canada, Coastal and Insular: 222 4 2 2 4 3 1 2 1 2 6 4 7 38 2-3 224 3 1 2 2 1 ** 1 1 1 1 4 3 17 2-3 225 8 8 7 5 4 3 3 3 4 5 8 8 66 5-6 228 3 4 5 4 3 1 1 3 5 8 5 7 50 3 Greenland, Iceland, Coastal and Insular: 301 1 1 1 ** 1 2 1 2 2 1 1 ** 12 5-6 302 4 4 1 1 3 2 3 3 4 2 2 ** 28 2-3 304 1 2 1 1 2 1 2 1 1 2 2 ** 15 10 305 10 11 10 6 8 2 5 3 6 10 7 5 82 3-4 306 2 2 1 1 ** 1 ** 1 1 3 1 1 14 5 308 10 6 9 10 6 4 6 3 8 10 8 6 84 2
* Wind Speed ≥ 32 mph. ** Less than 0.5 day.
072 | Vol_VII-0078
Table VI. Mean number of days with “gales”* (cont.) Station Jan Feb Mar Apr May Jun Jul Aug Sep Oct Nov Dec Ann Yrs Rec Greenland, Iceland, Coastal and Insular (cont.): 309 4 ** 2 ** ** ** ** 1 1 2 2 2 15 4-5 310 4 5 6 3 2 ** 1 ** 5 5 5 8 43 2-3 311 4 2 1 1 1 ** ** ** ** 1 2 1 11 2-3 312 4 2 2 1 2 2 1 1 2 2 2 2 22 6-7 313 21 22 24 17 9 5 5 5 8 15 15 20 167 3-4 314 4 1 2 3 ** 5 2 2 3 2 2 2 29 4-5 315 6 2 2 2 1 1 ** 1 ** 1 3 5 23 4-5 316 10 15 15 9 10 4 3 3 13 5 12 21 121 2 317 7 5 4 2 1 1 ** 1 3 2 4 5 36 10 318 4 5 1 3 1 1 1 1 1 2 3 2 22 8 319 9 7 6 6 1 2 1 1 3 3 6 10 54 2-3 320 12 10 8 7 4 4 3 4 6 9 10 8 84 10 321 19 17 19 15 12 11 4 8 8 10 12 19 153 4-5 330 2 2 1 1 1 1 ** 1 1 1 2 2 14 16 331 3 2 1 1 ** ** 0 ** ** 1 2 3 13 16 332 3 2 1 2 1 1 ** 1 2 2 1 1 17 9 334 3 2 2 1 ** ** 0 ** 1 2 2 2 15 14 335 1 1 1 ** ** 0 0 ** ** ** 1 1 5 15 337 ** 0 0 ** 0 0 0 0 0 0 ** ** 1 11 339 2 1 1 ** ** ** 0 ** 1 1 1 ** 9 10 340 0 0 1 0 0 0 0 0 1 0 0 0 2 1 Greenland, Iceland, Inland: 361 ** ** 0 ** 0 0 0 0 ** ** 0 ** 1 16
* Wind Speed ≥ 32 mph. ** Less than 0.5 day.
073 | Vol_VII-0079
Table VI. Mean number of days with “gales”* (cont.) Station Jan Feb Mar Apr May Jun Jul Aug Sep Oct Nov Dec Ann Yrs Rec Europe, Coastal and Insular: 400 110 9 7 5 3 3 2 2 4 6 8 11 69 10 401 11 8 7 9 3 3 2 2 6 6 11 11 79 1 406 7 7 6 4 3 2 1 2 3 4 6 7 52 19 408 5 5 4 3 2 1 1 2 2 3 5 5 38 31 412 2 2 2 1 0 ** 0 ** 1 1 2 2 13 28 414 2 2 2 1 ** ** ** 0 ** ** 1 2 1 9 26 415 4 4 4 2 3 2 2 1 2 3 5 4 36 18 417 6 3 3 6 2 2 0 1 3 4 5 4 37 .. 420 3 3 2 1 ** ** ** ** 1 2 2 3 17 26 421 ** 0 ** ** 0 0 0 ** ** 0 ** ** ** 8 423 0 0 0 ** 0 0 0 0 0 0 0 0 ** 7 425 2 1 2 1 2 2 1 1 2 2 1 1 19 18 426 ** ** ** 0 0 0 0 0 ** 0 ** 0 1 17 428 2 2 2 1 2 2 1 1 2 2 2 2 20 18 429 1 1 1 1 1 1 1 ** 1 1 1 1 8 18 Europe, Inland: 450 ** ** ** 1 0 1 0 0 ** ** ** 1 3 7 451 ** ** ** ** 1 ** 0 ** 1 1 1 ** 4 14 455 0 0 0 0 0 0 ** 0 0 0 0 0 ** 8 456 ** ** 0 ** ** ** ** 0 1 ** 0 0 1 7 Asia, Coastal and Insular: 500 14 8 11 11 7 11 10 10 8 9 13 14 126 7-8 502 9 8 6 8 6 6 6 5 4 3 8 8 76 4-5
* Wind Speed ≥ 32 mph. ** Less than 0.5 day.
074 | Vol_VII-0080
Table VI. Mean number of days with “gales”* (cont.) Station Jan Feb Mar Apr May Jun Jul Aug Sep Oct Nov Dec Ann Yrs Rec Asia, Coastal and Insular (cont.): 503 8 4 4 2 2 4 3 2 3 3 6 6 47 7-8 506 6 5 5 5 5 3 1 2 3 6 7 5 53 24 507 11 10 13 13 10 11 8 6 8 6 8 11 114 17 508 4 3 5 4 3 2 1 2 4 5 5 4 41 6 509 5 6 6 6 7 2 2 4 4 8 10 5 65 6-7 510 11 19 8 7 5 3 1 3 5 6 9 8 75 19 513 1 1 0 1 ** 2 3 2 2 2 1 2 18 4 515 ** ** 2 1 1 2 2 2 1 2 1 1 15 5 517 8 3 6 2 3 3 1 2 8 7 8 4 55 3 518 10 9 8 8 7 5 3 2 5 7 10 9 82 26 519 6 6 5 6 6 2 1 2 5 7 8 8 60 22 521 4 4 5 4 5 2 1 3 4 5 4 4 46 13 522 1 ** 1 1 1 1 ** 2 1 0 0 1 9 5 523 10 6 8 5 5 4 2 4 5 7 4 8 68 3 525 5 5 5 5 5 3 6 6 6 6 8 8 68 9 526 3 2 3 2 1 1 1 1 1 2 2 2 21 14 527 4 4 4 2 1 ** 2 1 2 2 4 3 29 12 531 1 ** 2 ** 0 1 0 0 0 2 2 3 11 4 Asia, Inland: 550 4 4 2 2 1 0 1 ** 1 1 2 3 19 5 551 6 6 2 2 2 0 2 4 0 1 5 6 35 1 553 5 6 7 5 3 2 1 2 3 4 5 4 48 18 554 7 10 8 11 10 7 6 7 6 7 12 9 100 4 556 ** ** ** ** ** 2 2 1 1 ** ** 0 7 17
* Wind Speed ≥ 32 mph. ** Less than 0.5 day.
075 | Vol_VII-0081
Table VI. Mean number of days with “gales”* (cont.) Station Jan Feb Mar Apr May Jun Jul Aug Sep Oct Nov Dec Ann Yrs Rec Asia, Inland (cont.): 558 0 0 ** 0 ** 1 1 1 ** 1 0 0 4 8 560 ** 2 3 2 2 2 2 1 2 1 2 1 20 8 561 1 1 1 1 1 ** ** ** ** ** ** ** 5 11 562 ** 2 3 1 3 2 ** 1 2 1 3 1 18 10 563 2 2 1 2 1 1 1 1 1 2 2 2 17 6 566 ** ** 1 ** 1 1 1 ** 1 1 1 0 7 13 568 ** ** 1 1 2 2 1 1 1 1 ** ** 10 18 571 0 0 0 0 0 0 0 1 0 4 0 1 6 1 572 1 1 1 ** ** 1 ** ** 1 ** 1 1 7 16 573 2 2 2 3 3 2 2 1 3 2 2 2 25 9 574 1 ** ** ** 1 ** 0 ** ** ** 1 ** 5 10 575 1 ** 0 0 0 0 0 ** ** ** ** ** 2 18 576 ** 1 1 2 1 2 1 1 ** ** 1 1 11 13
* Wind Speed ≥ 32 mph. ** Less than 0.5 day.
076 | Vol_VII-0082
Data from coastal stations along the Arctic Ocean indicate that
average wind speeds at most points are higher than over the ocean
areas, but even here the wind speeds are low except where strongly
influenced by local factors. In general, the average wind speeds at
coastal points are of the order of 10 to 15 mph except at more exposed
locations where averages of 15 to 20 mph are fairly common. (See
Table VII .) However, the coastal areas may also experience excessively Table VII here
high winds at times. For example, on February 8, 1909, Note: Possibility that this may be an incorrect date See Reference title, J.P.J. a temporary
weather station s at Winter Harbor, Melville Island, recorded a 1-hour
average wind speed of 86 mph and a speed of over 100 mph for a
20-minute period. The average speed for the 24-hour period was in
excess of 60 mph / [ 6 ] / .Wind speeds over inland areas at low elevations within the Arctic
are usually much lower than those over either the Polar Sea or its
coasts. The mean annual wind speed at Verkhoyansk, for example, is
only 3.2 mph and at Yakutsk, 3.9 mph.
077 | Vol_VII-0083
Table VII. Average specified wind speed (mph) Station Jan Feb Mar Apr May Jun Jul Aug Sep Oct Nov Dec Ann Yrs Rec Oceanic: 001 11 9 10 11 13 14 12 11 13 14 14 .. .. 1 002 11 9 8 8 11 12 12 11 11 10 9 10 10 1 004 21 21 18 17 13 14 12 14 16 18 19 18 17 .. 006 14 14 11 11 13 13 11 12 16 14 14 12 13 5-6 007 15 13 13 13 14 14 13 15 17 18 17 16 15 5-6 008 11 .. .. .. .. .. 8 11 7 8 9 10 .. 0-1 Alaska, Coastal and Insular: 100 10 10 11 12 11 11 13 13 14 15 12 10 12 3-17 101 15 18 18 11 11 12 13 15 15 17 22 19 16 1 103 22 24 21 17 15 16 18 15 17 17 22 20 19 1 104 9 9 9 9 7 7 8 8 9 9 9 9 8 18-30 106 4 5 6 6 6 5 4 4 4 5 5 5 5 8 Alaska, Inland: 155 6 8 8 8 7 7 8 7 7 7 7 6 7 3 156 3 4 5 6 7 6 6 6 5 5 4 4 5 8 Canada, Coastal and Insular: 206 12 11 10 13 14 12 9 13 12 15 15 14 13 6 207 3 4 2 3 4 4 3 3 3 4 3 4 3 4 209 5 4 3 3 5 3 2 2 1 3 3 3 3 6 211 4 4 4 4 6 8 9 8 7 7 7 3 5 4 216 8 8 7 7 7 7 8 9 10 10 10 8 8 8 221 15 15 14 14 14 12 8 13 15 17 15 16 14 8 222 3 3 2 3 3 2 3 4 4 4 3 2 3 1-2
078 | Vol_VII-0084
Table VII. Average specified wind speed (mph) (cont.) Station Jan Feb Mar Apr May Jun Jul Aug Sep Oct Nov Dec Ann Yrs Rec Canada Coastal and Insular (cont.): 223 11 11 11 13 12 12 10 11 12 13 15 13 12 15 224 11 7 9 9 11 8 9 8 9 9 11 10 9 5-6 227 18 18 17 17 14 13 13 13 15 18 19 18 16 15 228 15 15 14 14 13 12 11 13 16 17 17 15 14 12 Canada, Inland: 251 3 3 3 3 4 4 5 3 3 3 3 3 3 3-7 253 9 9 10 8 9 8 8 9 9 11 8 8 9 5 254 5 4 7 7 10 10 10 8 6 7 5 4 7 6-21 255 2 3 6 6 6 6 6 6 6 6 3 2 5 7 Greenland, Iceland, Coastal and Insular: 301 2 2 3 1 .. 6 3 2 4 6 2 2 .. 5 302 7 10 10 9 6 6 6 7 10 10 9 8 8 2 304 5 4 4 4 5 6 4 4 5 6 6 6 5 30 307 10 8 6 5 5 6 7 6 8 9 11 9 7 .. 308 5 5 5 4 3 3 3 3 3 4 4 4 4 12 314 14 14 13 11 9 9 8 9 4 11 12 12 11 30 317 6 6 5 3 3 3 3 3 3 4 5 5 4 30 318 4 4 3 2 2 2 1 1 2 2 3 2 2 30 320 13 12 12 11 8 10 8 7 9 10 11 11 10 23 330 12 11 10 9 6 6 5 6 8 9 10 10 8 16 331 14 14 13 12 11 11 9 9 10 12 12 13 12 4 338 9 10 9 9 9 8 7 7 8 8 9 9 7 15 340 6 6 4 4 4 4 3 3 4 4 5 5 5 19 Greenland, Iceland, Inland: 351 11 9 13 12 9 9 9 8 11 10 9 14 10 2
079 | Vol_VII-0085
Table VII. Average specified wind speed (mph) (cont.) Station Jan Feb Mar Apr May Jun Jul Aug Sep Oct Nov Dec Ann Yrs Rec Europe, Coastal and Insular: 400 16 15 12 12 11 10 8 9 13 15 15 17 13 10 401 20 17 14 15 13 11 8 10 13 15 18 18 14 1 407 10 10 9 7 5 6 5 4 5 7 8 9 7 10 408 22 21 21 19 16 16 13 14 17 19 21 21 18 28 412 17 16 16 13 11 11 10 10 13 13 14 16 13 28 415 10 9 9 8 9 10 9 7 8 9 10 9 9 10 417 18 17 15 15 16 16 14 14 15 15 16 17 16 .. 421 8 8 8 8 9 9 7 8 8 7 7 7 8 8 423 10 11 11 11 12 12 10 10 11 11 11 11 11 8 424 10 9 9 8 8 8 8 8 9 10 10 10 9 26 425 11 9 10 9 11 10 9 10 11 10 12 10 10 10 426 10 10 10 9 9 9 9 9 10 10 10 11 10 10 428 12 10 11 9 10 9 10 10 11 11 12 10 10 25 429 8 9 9 9 10 9 9 8 8 8 8 8 9 6 Europe, Inland: 451 3 2 3 3 5 8 4 2 2 1 2 3 3 10 452 10 11 11 10 11 13 11 10 11 11 9 9 11 25 453 8 6 7 6 7 7 6 5 6 7 6 7 7 10 454 14 13 14 14 13 13 13 13 12 13 14 13 13 11 455 6 7 7 7 8 8 6 6 7 7 6 6 7 8 456 4 5 6 8 9 8 7 7 9 6 5 4 7 8 457 7 7 8 6 7 6 5 5 6 7 7 7 7 36 458 6 6 7 6 7 7 7 6 6 6 6 6 6 30
080 | Vol_VII-0086
Table VII. Average specified wind speed (mph) (cont.) Station Jan Feb Mar Apr May Jun Jul Aug Sep Oct Nov Dec Ann Yrs Rec Asia, Coastal and Insular: 500 21 16 18 19 17 18 18 18 19 19 21 21 19 7-8 501 16 14 12 12 13 13 12 14 17 15 17 16 14 5-6 502 15 16 14 15 16 15 13 17 18 14 15 15 15 4-5 503 16 13 13 12 13 14 13 13 14 13 14 15 14 7-8 505 26 25 23 21 18 17 16 13 17 20 22 20 20 13 506 17 16 14 15 14 13 12 12 15 16 19 17 15 24 507 15 16 16 18 16 17 14 13 15 13 15 17 15 17 509 14 16 15 17 17 15 14 15 15 17 18 13 15 6-7 510 19 19 16 17 16 16 15 16 17 16 18 17 17 19 511 12 9 8 11 14 14 17 14 15 15 13 10 13 4 512 14 11 8 8 11 10 9 11 12 11 11 9 10 7 513 6 6 6 8 9 11 12 10 10 9 7 9 8 4 514 12 10 10 11 12 13 11 11 13 12 12 12 12 7 515 8 8 9 9 9 12 12 12 11 9 9 9 10 9 517 12 11 11 9 9 7 9 8 13 15 15 12 11 10 518 18 18 16 16 15 14 12 12 15 17 20 18 16 26 519 17 18 16 16 16 15 12 13 16 17 19 17 16 22 520 9 10 11 13 13 15 12 12 12 11 12 8 11 12 521 15 14 14 16 17 15 14 14 15 16 17 15 15 13 523 13 11 12 11 11 11 10 13 14 17 14 12 12 2 525 11 11 12 13 11 10 12 12 11 13 15 16 12 7 527 13 14 12 11 9 10 11 11 11 12 13 13 12 14 528 12 14 11 11 10 6 6 7 13 15 12 13 11 3 530 23 25 22 19 17 11 12 12 14 16 20 18 17 10 531 7 5 6 4 4 4 4 4 4 6 7 8 5 4
081 | Vol_VII-0087
Table VII. Average specified wind speed (mph) (cont.) Station Jan Feb Mar Apr May Jun Jul Aug Sep Oct Nov Dec Ann Yrs Rec Asia, Inland: 550 9 9 8 9 10 9 9 9 8 8 7 8 8 5 552 5 6 7 10 11 11 10 9 10 10 7 6 8 18 553 15 16 15 15 15 13 11 12 13 15 14 13 14 18 555 8 9 10 10 11 10 8 9 10 10 9 7 9 4 556 1 2 2 4 6 7 6 5 4 3 2 1 3 21 566 2 3 3 4 5 5 4 4 4 5 3 3 4 24 567 4 4 5 6 7 6 5 5 5 6 5 4 5 12 568 3 3 3 5 6 5 5 5 5 4 3 3 4 21 576 1 1 2 2 3 3 2 2 2 2 2 1 2 13
082 | Vol_VII-0088
In a discussion of the frequency distribution of various wind
speeds, Simpson / [ 39 ] / has pointed out that at a given locality the
frequency with which winds of different velocities occur is closely
associated with the type of pressure distribution characteristic of
the region, i.e., whether cyclonic or anticyclonic. He says:“In one type the relative frequency increases as the velocity
decreases right down to calms; this type is associated with
anticyclonic pressure conditions. In the other / [ type / ] the
frequency increases as the wind decreases down to a certain
velocity after which the frequency decreases as the wind
decreases and calms may have a very small frequency; this type
is associated with cyclonic pressure distribution.”This seems to be a reasonably useful method for classifying wind–
speed distributions at Arctic locations. It is not established,
however, that one is justified in assuming that a “cyclonic” type of
frequency distribution indicates a predominance of cyclonic curvature
to isobars over the region (or vice-versa).
083 | Vol_VII-0089
Sverdrup / [ 43 ] / has performed the Simpson type of analysis upon
the wind data obtained at several coastal points on the Arctic Ocean
as well as upon those recorded from the Maud over the Ocean proper.
He found the “cyclonic type” of velocity distribution most frequent
over the Polar Sea during all seasons, with a tendency toward an
“anticyclonic type” at coastal locations, particularly during winter.
Sverdrup / [ loc. cit. / ] also found a good agreement between the type of
wind-speed distribution and the annual variation of pressure, i.e.,
the higher the barometric pressure the more nearly the frequency
distribution approaches the “anticyclonic type.” A similar analysis
of data from inland Arctic locations has not been performed, but (from
the high frequency of calms and low wind speeds) it can be deduced
that the anticyclonic type would greatly predominate during the colder
months.
084 | Vol_VII-0090
Vertical Wind Distribution Within the Surface Layar . - It has already
been pointed out that the existence of a surface temperature inversion
is characteristic of the Arctic during all seasons except over areas
with a continental type of climate during the warmer months. The
altitude and magnitude of the surface inversion varies systematically
with season, remaining fairly uniform during colder months and
becoming more variable during warmer months. A consideration of these
variations from place to place and from season to season is of consid–
erable importance to conclusions regarding the variations of winds
within the surface layers of the atmosphere over the Arctic. It is
for this reason that the relationships between the vertical temperature
structure of the surface layer of air and the local wind conditions
will be discussed in some detail.
085 | Vol_VII-0091
It is a matter of common knowledge among meteorologists that
the atmospheric mixing rate (eddy conductivity) is small within a
surface inversion layer, and smallest when the temperature increase
within the inversion is greatest. A low inversion, therefore,
effectively “seals-off” the surface layer against frictional drag
by the atmospheric layer above the inversion. In other words, the
circulation below the surface inversion layer has a strong tendency
to act independently of the rest of the atmosphere. This circumstance
is one of the several reasons why it is so difficult to describe the
general Arctic surface circulation in broad regional terms. (See
page .)
086 | Vol_VII-0092
The wind velocity near the surface depends partly upon the
transport of kinetic energy from above (which serves to move
the surface layer of air) and partly upon friction at the ground
(which serves to slow down the movement of air near the surface).
Assuming the friction at the ground to be constant, the lowest wind
velocities at the surface occur when a sharp surface temperature
inversion is present because it is under these conditions that the
transport of kinetic energy from above is least. By identical
reasoning it can be pointed out that the highest velocities at the
surface will occur when the surface inversion is weakest or entirely
absent. In the presence of a strong surface inversion the ratio
between the wind speed at the surface and that, say at 1500 feet, is
large. When the inversion is weak or non-existent, the ratio is
small [ 43 ] . This circumstance is clearly indicated by the following
data which show the vertical distribution of wind velocity as related
to altitude of the base of the inversion, and which have been averaged
by Sverdrup for a number of Arctic points [ loc. Cit. / ] :
087 | Vol_VII-0093
Altitude of Base
of InversionZero to
330 feet330 to 660
feet660 to 980
feetGreater than
980 feetAltitude of wind
Measurement (ft)Wind speed
(mph)Wind Speed
(mph)Wind Speed
(mph)Wind Speed
(mph)1970 23.7 25.3 29.1 28.4 1640 24.2 26.2 30.6 28.2 1310 25.1 25.9 30.2 27.3 980 25.9 26.9 29.5 27.5 660 25.9 25.9 25.9 24.2 330 22.1 20.1 22.8 21.3 20 10.5 13.2 13.4 15.7
Over the pack-ice, Sverdrup found large ratios in winter
between the velocities at 1,600 feet and those on the surface, the
maximum ratio thus coinciding with the presence of a low and sharp
temperature inversion which is characteristic of this season. During
spring and autumn he found the ratio to be small because in these
seasons the inversion lies higher and is less pronounced. A secondary
maximum in the ratio was found to occur in summer over the pack-ice
but not at the coast. The reason for the difference here is that over
the pack-ice in summer the surface temperature cannot depart much from
freezing, whereas the temperatures can rise well above freezing at the
coast with a consequent destruction of the surface inversion. (See
page .)
088 | Vol_VII-0094
Details of the vertical structure of the surface wind field are
similar over the interior Arctic. The existence of exceedingly
strong surface temperature inversions during winter accounts for the
prevalence of calms at interior stations during this season, even
though winter is the period during which the arctic circulation reaches
its greatest intensity. Calms are much less frequent everywhere during
the warmer months when the inversion is either weak or absent.Sverdrup / [ loc. cit. / ] has also shown that under inversion conditions
there is a clockwise turning of the wind with altitude. The lower
(or stronger) the temperature inversion, the greater the degree of
turning. When the base of the inversion is at an altitude of less than
330 feet his data show an average deviation of 26 degrees between the
direction of the wind at the surface and the direction observed at
330 feet. When the base of the inversion is at an altitude greater
than 1,000 feed, the average turning is only 4 degrees.
089 | Vol_VII-0095
It should, perhaps, be pointed out here that the velocity
profiles described in this subsection are typical of conditions
found over more-or-less level surfaces and do not apply to conditions
as they occur within a “fallwind” or “katabatic” flow. This latter
phenomenon will be described in a subsequent section.Local Influences on Surface Winds . - No one can examine detailed
Arctic wind data from coastal and inland points without being
impressed by the fact that local surface wind speed and direction are
largely determined by exposure of the station (and wind instruments)
and by the location of the area with respect to land and water bodies
and to the regional orography. As an example of the influence of
exposure, Sverdrup [ 42 ] cites one case where a series of observations
made between 1900 and 1902 at a station on Kllesmere Island showed an
average wind speed of 11.2 mph, whereas a series of observations made
in the same area during the interval 1899 to 1900 gave an average
wind speed of only 2.1 mph. The reason for this marked difference
is that the winter lodgings were located in a more sheltered location
during the first year of observations than was the case during the
succeeding years. figs. 35 and 36 here
090 | Vol_VII-0096
At many coastal points, particularly along the costs of
Greenland and Iceland, the direction and speed of the surface winds
are so local in character that they may bear little or no relation–
ship to winds in the offing. In Iceland, the numerous fjords
indenting the west, north, and east sides of the island contribute
their quota of gorge and channel winds. Similarly, at many places
along coastal Greenland sheltering bluffs or the trend of fjords
largely determine the local wind directions. For example, there are
very few northerly and northwesterly winds at Godhavn, a fact which
is due to the location of the observing station on the shore below
the southerly bluffs of Disko Island. In the same manner, the wholly
different frequencies of north, northeast, and east winds at Godhavn
and Jakobshavn, stations quite near each other, are entirely the
result of different topographic influences. In contrast, at Jakobshavn
and Holsteinsborg, the latter a station much farther from Jakobshavn
than Godhavn, the distribution of wind directions is quite similar
because of a similarity in topographic features / [ 42 ] / .
091 | Vol_VII-0097
Regional Influences on Surface Winds . - All expeditions to the Ice
Cap region of Greenland have commented on the fact that the surface
winds ordinarily are directed from the interior toward the coast.
This wind regime is merely a large-scale example of a “gravitational”
or “katabatic” wind system. These downslope winds result from the
presence of the cold layer of stable air which forms over the Ice Cap
and which subsequently flows down the slopes of the Ice Cap under the
influence of gravity. The speed of the flow depends first upon the
steepness of the slope; secondly, upon the temperature (density)
contrast between the stable surface air and the warmer air above;
and, lastly, upon the pressure gradient between the inland ice and the
coast. Near the summits of the Ice Cap the winds are more variable,
since their direction and speed depend more upon the magnitude and
direction of the pressure gradient then upon the activity of the cold
air. These katabatic or downslope winds, while they are particularly
characteristic of the Greenland climate, are not limited to this
region. They are an important climatic feature in other Arctic regions
092 | Vol_VII-0098
of diverse topography, such as along the coasts of northern Norway, Spitzbergen,
at Wrangle Island, and in parts of Alaska. Winds of this character
can occur in any part of the Arctic where there is sufficient area
at high elevation to allow the accumulation and downslope flow of
air which is very cold relative to air in the free atmosphere at the
same elevation. Williwaws , also known as Takus or kniks , are a form
of this katabatic wind that occurs along parts of the Alaskan coast.
They are most frequently encountered below along precipitous coastlines.
In many instances the cold air supply which initiates the fallwind
is of limited supply and, for this reason, williwaws are often of
short duration since they cease as soon as the cold air is exhausted.
093 | Vol_VII-0099
The depth of the katabatic wind is seldom more than five or
six hundred feet, even along the Greenland Ice Cap. These winds
are strongest and deepest when the temperature contrast between the
coast and the interior is greatest. For this reason they tend to
present a maximum frequency in the morning hours and a minimum in
the afternoon, although there are local exceptions to this general
rule, particularly nearer the centers of origin of the winds (as in
the interior of the Ice Cap). They are also somewhat stronger on
clear days than on cloudy days when interior temperatures are above
average. In contrast to the vertical distribution of wind speeds in
other types of Arctic wind systems (see page ), the maximum wind
speeds are found near the surface, i.e., winds are stronger below the
surface inversion than above.
094 | Vol_VII-0100
Another regional factor affecting the wind regime along Arctic
coasts is exactly opposite in both cause and effect to the fallwinds
just described. In this case the wind is directed inland from a
relatively cool ocean toward a heated continental interior. This
phase of a monsoonal (seasonal reversal of circulation) wind regime
occurs during summer, as would be expected, and is well-developed on
a fairly large scale in portions of Siberia and Alaska. This component
of the surface wind is seldom very great and at no times do the wind
speeds approach the extreme values found in the katabatic flow. Thermal
lows develop during the warmest months in the interiors of Siberia and
Alaska, replacing winter anticyclones in each case. This substitution
results in a tendency toward a reversal of the circulation between
winter and summer. Actually there are few localities where a complete
180-degree reversal of the circulation takes place between the seasons.
In most cases the effect is merely one of several factors which
influence the circulation and may only serve to deviate the wind
slightly from the direction which would prevail were there no marked
temperature contrasts between land and sea.
095 | Vol_VII-0101
Diurnal Variation of Wind . - The land- and sea-breeze effect is
seldom as well-developed in Arctic regions as in more southerly
latitudes — largely because there is no important diurnal variation
in surface heating and cooling. Nevertheless there is a tendency
toward a diurnal reversal in wind direction along Arctic coasts
during warmer months, particularly when pressure gradients are weak.
For example, in some parts of Greenland there is a tendency during
summer for winds to blow inward along the fjords during daytime and
outward during the night [ 42 ] .The wind speed at most Arctic stations also shows a diurnal
variation, both inland and at the coast. At locations surrounded
by moderate elevations the chan g es in wind speed are directly related
to changes in stability, i.e., velocities are least during night hours
when stability is greatest and greatest during afternoon hours when
surface heating is at a maximum. Along the Arctic coast, Sverdrup
[ 43 ] found that the maximum wind speeds occur generally between 1200h
and 1400h and the minima between 0400h and 0600h. The diurnal variation
over the pack-ice is similar but of smaller magnitude, as would be
expected from the smaller diurnal range in stability. (See Fig 37 .) fig. 37 here
096 | Vol_VII-0102
A diurnal period in the wind is also noticeable at higher
altitudes and on slopes (as along the Greenland Ice Cap) but in
these cases the phase is reversed, i.e., the minimum wind speeds
occur during the afternoon and the maximum speeds during night or
early morning hours. This type of diurnal variation in the case of
slope stations is related to the nighttime augmentation of the
katabatic-type flow through radiational cooling in the interior. At
locations on mountain ridges or peaks, a similar diurnal variation
takes place, but in these cases the cause is the lessened frictional
drag at the higher wind levels, lowered by increased stability at
the surface.
097 | Vol_VII-0103
Annual Variation of wind speed . - Most of the factors involved in the
annual variation of winds over the Arctic have, of necessity, been
discussed in preceding paragraphs. All that remains is to describe
the more important factors affecting the seasonal variations of wind
speed as they apply to various types of Arctic topographies.Wind speeds nearly everywhere along Arctic coasts and over the
polar sea are lowest during summer. At this time pressure gradients
are weakest because of the weakening of thermal contrasts between
high and middle latitudes and between continents and seas. However,
at locations within the continental interiors, winter is the period of
low wind speeds for the reasons that have already been pointed out on
page . The maximum wind speeds at interior stations tend to occur
in late spring or early summer (see data for Yakutsk and Verkhoyansk
in Table VII ), but, again, there are local exceptions. Elsewhere the
maximum wind speeds tend to occur during late autumn or winter at
times of maximum cyclonic activity.
098 | Vol_VII-0104
UPPER-AIR WINDS
It was pointed out in the section on upper-air pressures that the
Arctic anticyclones are relatively shallow phenomena, and hence there
is a tendency for the direction of the pressure gradient aloft to reverse
itself at comparatively low altitudes. (Compare Figures 29 to 32 and
33 to 34 .) Pilot balloon observations over the Arctic Basin have, in
all cases, confirmed this tendency toward reversal. Sverdrup [ 43 ] has
shown that the predominance of easterly winds at the surface is confined
largely to the levels below 10,000 feet, and that they are replaced by
prevailing westerly winds at higher altitudes above the region of his
observations. This general turning of the wind to a westerly direction
is dynamically in accordance with the observed fact that the average
temperature within the lower atmospheric layer s of the west winds decreases toward the
north from the region represented by the upper-air soundings. It is
admitted, however, that the average wind aloft over other portions of
the Arctic may be from directions other than westerly. (See Fig. 39 .)
099 | Vol_VII-0105
Variation of Wind with Altitude . — Some aspects of the vertical
distribution of winds in the lower layers of the Arctic atmosphere have
already been discussed in the section on surface winds. It was pointed
out that there exists a strong tendency for a clockwise turning of the
wind direction from the ground upward through a sharp surface temperature
inversion. The data show, however, that this turning is largely confined
to the lowest five or six hundred feet of the atmosphere. In the region
of Sverdrup’s observations [ 43 ] , it is found that for surface wind
directions of east, southeast, or south, a much less rapid clockwise
turning of the wind continues above the surface inversion layer. For
all other surface winds, the direction of turning is counterclockwise.
A very rapid turning between 26,000 and 30,000 feet is noted by Sverdrup
in the data which correspond to surface wind directions from southwest
(through west) to northeast. He concludes that this accelerated turning
marks the transition from a tropospheric to a stratospheric circulation.
100 | Vol_VII-0106
These results, however, cannot in any way be taken as representative
of average conditions over the entire Arctic. The degree and direction
of turning is locally dependent upon the average direction and magnitude
of the pressure gradient at all altitudes above the area represented by
vertical soundings. These qualities of the pressure gradients aloft in
the Arctic will be shown to be more complex than is the case in the region
of the lower-latitude westerlies.The wind speeds over the Arctic normally increase from the surface
upward to a level at or below the base of the stratosphere (tropopause)
above which they may decrease in intensity. The tendency for the height
of maximum wind speed to occur at or near the tropopause is clearly
illustrated by the following data from the Maud pilot balloon ascents [ 43 ] :Altitude of
Tropopause
(feet)26,200 29,500 32,800 36,100 39,400 42,600 45,900 Altitude of
Wind Maximum
(feet)26,200 28,500 30,500 32,800 34,800 37,100 39,400
Observations obtained during the Canadian Wordie Expedition of 1937 to northwest
Greenland and the Canadian Arctic [ 8 ] indicate further that the height
of the level of maximum wind speed and the height of the tropopause both
101 | Vol_VII-0107
vary directly with surface pressure — a condition which is merely
another reflection of the well-know meteorological fact that the
stratosphere is lower over cyclone centers than over anticyclones. The
expeditionary data show that the altitude of the level of maximum wind
speed varies from about 26,000 feet to 37,000 feet, averaging about
10,000 feet lower in winter than in summer. The latter finding, again,
is in line with present knowledge concerning the annual variation of
the tropopause height. (See pages to .)In contrast to conditions in the westerlies, where the wind speeds
tend to increase with altitude throughout the troposphere, the easterly
winds of the Arctic Basin are strongest near the ground and, on the
average, decrease to their minima between 10,000 and 13,000 feet. As a
measure of the great degree of independence between the surface anti–
cyclonic circulation and the westerly circulation at higher altitudes,
Sverdrup [ 43 ] noted that, in many cases, the transition from easterly
to westerly winds was very sharp, almost as if the pilot balloon had
passed through a marked front. It thus appears that a characteristic
boundary surface is present over the Arctic, and that it exists at an
average altitude of between 10,000 and 13,000 feet.
102 | Vol_VII-0108
This systematic change with altitude of the average wind is well
illustrated by the following data from the Maud Expedition [ 43 ] :Level (feet) 0 3,300 6,600 13,100 19,700 Wind resultant
from:s88° E. s36° E. s16° E. s66° W. s89° W. Resultant velocity
(mph)2.0 4.0 3.4 4.3 6.0
Regional and Seasonal Differences in Upper Winds . — The January and
July distributions of streamlines and the mean vector winds over Arctic
and temperate latitudes at the 10,000- and 20,000-foot levels are shown
by Figures 38 to 41 . In addition, the several available wind roses
which apply to the 40,000-foot level are entered on the 20,000-foot figs. 38 to 41 here
charts.These charts show that much of the westerly zonal flow characteristic
of the wind field at lower latitudes is lost within the Arctic where
closed circulations exist in the mean flow — circulations which are
assymmetrical with respect to the pole. This circumstance is to be
interpreted as meaning that the upper-air wind field is considerably
more complex over the Arctic than over temperate regions.
103 | Vol_VII-0109
The average upper winds north of the Arctic Circle are weaker than
are the midlatitude westerlies. At 10,000 fact, for example, the resultant
winds in the Arctic average about 20 knots compared to averages of 25 to 30
knots in midlatitudes. In the lower latitudes the westerly winds increase
with height throughout the troposphere, with average velocities at 40,000
feet probably exceeding 100 knots in some areas in winter. In the Arctic
the increase in the wind velocity with height is less rapid and, as has
already been shown, winds reach their maximum velocity (of about 30 knots) at
around 30,000 feet.The mean wind velocities show little seasonal variation at the higher
altitudes. For this reason the differences between the mean upper winds
over the Arctic and those over midlatitudes are small in summer and large
in winter. However, in this connection, it should be pointed out that the
“mean wind” values, whether scaled from upper-level pressure charts or
computed from upper-air soundings, do not have the same meaning as those
for “average wind speed.” The former are vector quantities and the fact
the mean wind is of low velocity may merely signify that the wind directions
and speeds are highly variable from day to day and tend to cancel one another.
104 | Vol_VII-0110
A more representative picture of the regional differences in the upper
winds is obtained through an examination of the frequency distributions
of wind directions and speeds at individual weather stations. This is
at least true within the limits of reliability of the observational
samples and the adequacy of areal coverage.figs. 42 and 43 here
Unfortunately, upper-air wind data over the Arctic are very scanty
and probably not too representative. A large fraction of the data has
been obtained from pilot balloon soundings which must, of necessity, have
been carried out during intervals of favorable weather. In portions of
the Arctic, winds from one direction tend to bring the clearest skins and,
as a consequence, the winds-aloft data obtained during such situations may
extend to high altitudes. Winds from other quadrants may more often be
associated with low cloudiness, blowing snow, or other visibility-reducing
factors and observations will be limited in number and altitude. For
these reasons, the upper-air data obtained from pilot balloon soundings
tend to be heavily weighted by “fair weather” situations. These facts
should be kept in mind when making seasonal and regional comparisons of
the wind-rose data shown on Figures 38 to 43 .
105 | Vol_VII-0111
The most outstanding feature of the upper-air winds over the Arctic,
as shown by the wind roses, is their extreme day-to-day variability. It
is for this reason that the mean flow picture described in the preceding
paragraphs has a minimum of practical significance. Aerial reconnaissance
over the Arctic Basin has shown that the Arctic is subject to the incursion
of well-developed cyclones and migratory anticyclones, and is not a region
of continuously weak circulation as might be inferred from the streamline
pattern which describes the mean flow.Nevertheless, the maximum wind speeds observed in the Arctic seldom
equal those which are commonly observed in the lower-latitude westerlies.
North of the 70th parallel, wind speeds exceeding 100 knots are rare at
any altitude although the U. S. Air Force reconnaissance flights over
the Arctic have recorded 65-knot winds at the Pole at an altitude of
15,000 feet and 80-knot winds within 5 degrees of the Pole at approxi–
mately the same altitude (January 9, 1949) [ 49 ] .The greatest variability in the winds occurs nearly everwhere in
the Arctic during summer when the upper-level circulation is weakest.
Conversely, the winds exhibit their maximum directional constancy during
winter.
106 | Vol_VII-0112
Because of the great regional and seasonal variabilities in the
upper-wind frequencies over the Arctic, not further attempt will be made
here to describe the detail that is shown by the various station wind
roses. It should be noted that most of the summarized data apply to the
land areas, and even here they represent only the relatively lower altitudes.
These latter two limitations introduce the further complication of orographic
distortion of the pattern of wind frequencies. This distortion will be most
noticeable in the wind roses presented for stations in Greenland and Alaska,
where the elevated Ice Cap and interior high mountains, respectively, affect
the regional wind fields well above the 10,000-foot level.
107 | Vol_VII-0113
AIR TEMPERATURE
It has been shown previously that during most of the year the
Arctic is covered by a shallow layer of cold air which, because of
its great stability, is effectively isolated from the atmosphere
above. As a result, the air temperature is largely determined by
to local temperature of the ice, land, or snow surface. Over the
ice pack of the Arctic Ocean the local temperature of the ice is
primarily dependent upon the loss or gain of heat by radiation, upon
conduction of heat from the atmosphere, and upon the transport of
heat through the ice from the warm water below. Variations in
temperature caused by the transport of air from other regions occur
in every season, but the temperature at the ice surface is very
conservative and always tends to return to the equilibrium temperature
locally appropriate to the season. This tendency is particularly
pronounced over the Arctic Ocean in summer when the ice is melting.
During this season the air temperature seldom deviates far from the
freezing point, even near the coast where temperatures over the land
may be considerably higher.
108 | Vol_VII-0114
Over the land areas of the Arctic conditions are somewhat
different. During the colder months the cold layer may become
thicker than over the ocean; particularly at the bases of mountain
ranges where the surface “pool” of cold air is augmented by cold
air drainage from higher elevations. At times of strong winds the
surface air may become mixed to considerable altitudes, and, because
the transport of heat downward from the upper layers may be relatively
large, the temperature of the surface becomes a less dominating factor
than over the Arctic Ocean. During summer months the air temperature
over land may rise considerably above freezing because of the general
absence of a moderating snow cover and the effects of extended insolation
received during the long summer days of the Arctic.
109 | Vol_VII-0115
A very common misconception of the Arctic is that it is a
region of eternal ice and snow and an area of continual intense
cold. Greenland is a land possessing these qualities over much of
its surface, but the analogy has been incorrectly drawn when
Greenland is taken as typical of all Arctic regions. Greenland
consists almost entirely of a high plateau with occasional peaks
extending above 10,000 feet. Because of the high elevation and
relatively heavy precipitation, it is largely covered by ice. In
general, however, most Arctic lands possess neither of these
characteristics, and over much of the area the scanty snows melt
rapidly with the approach of summer.
110 | Vol_VII-0116
Moreover, the North Pole is not the coldest part of the
Northern Hemisphere. On the basis of separate considerations of
loss of heat by radiation from the ice and the amount of heat
conducted through the ice from below, (Sverdrup [ 43 ] ) has computed
that the most probable absolute minimum temperature over the pack-ice
is between the limits −58° and −62° F. It should be pointed out,
however, that the computations are based upon ice thicknesses
observed by Sverdrup and would not apply where the ice characteristics
depart markedly from those observed by him. On the Maud Expedition
(1918-1925) Sverdrup nowhere encountered temperatures below −46° F.
over the pack-ice, although Mohn [ 28 ] reports a minimum of −62° F.
recorded by the Fram , March 1894, at latitude 79°48′ N., longitude
135° E.Even though it is to be expected that coastal stations would
exhibit lower minima than should occur over the ocean areas, there
are several Arctic coastal stations that have never recorded temperatures
below −52° F. (Herschel Island, for example). This evidence indicates
that it is unlikely that temperatures near the Pole ever fall very
much below −60° F.
111 | Vol_VII-0117
In contrast to conditions over the Arctic Ocean, temperatures
over the continental portions of the Arctic may fall below −80° F.
during winter, and even regions well beyond the confines of the Arctic
may experience temperatures well below −60° F. The lowest official
temperature on record for North America, −81° F., occurred at Snag
Airport, Yukon Territory, February 3, 1947. There are points in the
United States (as at Havre, Montana) that have recorded temperatures
as low as −68° F. — eight degrees lower than is probably near the
Pole.The lowest temperature ever observed at the surface of the earth
is −93.6° F. (−69.8° C.), recorded prior to 1920 at Verkhoyansk,
Siberia, well over 1,500 miles from the geographic pole [ 54 ] . For
many years this station enjoyed the distinction of recording the
coldest winter weather of the globe, and the Verkhoyansk region came
to be known as the “Cold Pole of the Earth.” We now have reason to
believe, however, that temperatures at high elevations within the Ant–
arctic Continent are probably lower than any at the surface in the
Northern Hemisphere and that the true “Cold Pole” will be found some–
where near the South Pole.
112 | Vol_VII-0118
In 1929 a meteorological station was inaugurated in the Oimekon
River district of Siberia, some 400 miles southeast of Verkhoyansk
and, from the brief climate record available, it is noted that the
winter temperatures have consistently averaged lower than those recorded
at Verkhoyansk during the same period. It is quite possible, therefore,
that this station may establish a new record low temperature for the
Northern Hemisphere.
113 | Vol_VII-0119
It has been pointed out that the summer temperature in the pack–
ice never deviates much from the freezing point. In coastal waters
above-freezing summer temperatures are, therefore, found only within
ice-free areas, but even here the air temperature must remain near
freezing because the surface temperature of the water never rises
much above 32° and the air temperature seldom differs greatly from the
water temperature. Sverdrup’s observations show that warm air from
inland is often transported considerable distances from the coast,
but it is cooled so effectively in the lower layers by contact with
the ice or cold water that a strong temperature inversion is almost
immediately formed. During summer along the immediate coast relatively
high temperatures may be observed for short periods at times of
offshore winds, but when the wind reverses the temperature s almost
immediately falls to near 32°, confirming the conception that an abrupt
change in temperature at sea level takes place when one departs from
the coast.figs. 44 and 45 here
114 | Vol_VII-0120
During the three summer months the mean maximum temperatures over
the Arctic pack-ice, as recorded on the Fram and Maud , are as follows:June July August Fram 37.0° F. 37.0° F. 36.3° F. Maud 37.0° F. 37.2° F. 36.5° F.
The absolute maximum observed on the Fram expedition was 39.2° F.
(June 1896) and on the Maud expedition, 38.3° F. (June 1923). tables VIII to XIII hereIn contrast to summer conditions over the pack-ice, most coastal
stations regularly record temperatures above 50° F., and at some
stations temperatures as high as 85° F. have been observed. Even
higher temperatures are recorded at inland stations which are removed
from the moderating effects of water bodies. A maximum temperature of
100° F. has been recorded above the Arctic Circle, and there are a few
inland Arctic stations at lower altitudes that have not recorded
temperatures above 90°.
115 | Vol_VII-0121
Table VIII . Absolute maximum temperature (°F.) ✓ Station Jan Feb Mar Apr May Jun Jul Aug Sep Oct Nov Dec Ann Yrs Rec Oceanic: 002 .. .. .. .. 36 39 38 37 34 .. .. .. 39 1-3 003 .. .. .. .. .. 38 38 37 35 .. .. .. 38 1-3 004 38 39 44 40 49 54 59 59 49 48 41 40 59 7 006 35 29 29 22 33 40 43 42 41 33 31 32 43 5-6 007 31 29 24 27 32 41 46 49 41 33 31 32 49 5-6 008 14 32 .. .. 28 34 36 33 27 2 10 21 .. 0-1 Alaska, Coastal and Insular: 100 33 35 33 42 45 65 78 73 59 42 39 34 78 25-30 101 31 32 21 35 45 59 57 55 53 43 27 32 59 1 102 32 34 40 47 64 81 82 75 65 57 38 33 82 12-18 103 25 39 35 35 43 55 63 63 57 45 29 39 63 2 104 42 45 44 60 66 79 84 80 66 58 50 40 84 33-35 105 33 33 37 45 50 64 71 68 62 53 54 42 71 4-8 106 56 55 56 63 71 92 81 82 73 63 62 53 92 22-25 Alaska, Inland: 150 39 35 37 47 81 81 85 75 57 47 41 37 85 3-4 151 27 19 13 37 45 67 83 67 57 37 29 21 83 1-2 152 35 34 49 59 75 88 89 86 72 51 34 36 89 5-7 153 40 41 50 60 85 100 93 87 79 61 40 37 100 22-27 154 47 51 53 59 76 90 79 84 76 62 60 49 90 16-18 155 40 43 53 64 82 90 89 90 78 67 42 46 90 35-37 156 41 47 56 65 86 95 99 90 80 67 54 58 99 35 157 41 45 56 68 85 92 95 87 79 68 48 42 95 30-35 Canada, Coastal and Insular: 204 14 21 26 32 50 60 61 52 54 40 34 21 54 4-5
116 | Vol_VII-0122
Table VIII . Absolute maximum temperature (°F.) (cont.) ✓ Station Jan Feb Mar Apr May Jun Jul Aug Sep Oct Nov Dec Ann Yrs Rec Canada, Coastal and Insular (cont.): 211 28 36 27 34 51 63 75 64 56 44 23 34 75 10 213 9 26 40 26 41 60 68 63 49 37 32 15 68 6-8 214 23 38 23 25 39 48 65 62 51 41 31 17 65 5 216 10 11 20 33 47 72 78 71 58 42 24 14 78 15 221 12 4 15 31 39 63 75 68 55 39 28 14 75 16 222 26 30 22 27 43 61 77 70 55 39 31 27 77 5 223 30 31 34 39 44 65 73 67 55 41 32 29 73 8-10 225 34 24 25 38 44 60 70 67 55 42 36 34 70 4 226 48 53 43 42 55 69 70 66 62 56 52 36 70 7-8 227 34 33 35 36 42 58 63 58 49 40 34 32 63 5-8 228 39 31 41 62 87 88 96 87 84 62 45 34 96 30 Canada, Inland: 250 44 49 45 53 77 85 87 88 71 55 44 46 86 8 252 15 24 40 57 74 83 84 80 68 52 33 21 84 44 253 41 50 48 59 79 84 82 83 80 59 46 47 83 6 254 11 22 32 52 72 85 84 80 69 47 27 20 84 13 255 34 38 46 55 74 79 81 81 72 59 37 26 84 9 256 37 47 52 68 86 94 92 92 81 73 43 35 94 32 258 23 28 40 61 76 83 86 84 74 63 36 22 86 17 259 32 33 38 60 76 81 84 82 67 63 38 24 84 11 260 37 36 40 60 70 82 82 86 67 63 41 37 86 … 262 25 31 42 62 78 82 88 83 75 63 40 33 88 29 263 31 35 49 66 81 85 87 85 78 67 44 33 87 32
117 | Vol_VII-0123
Table VIII . Absolute maximum temperature (°F.) (cont.) ✓ Station Jan Feb Mar Apr May Jun Jul Aug Sep Oct Nov Dec Ann Yrs Rec Greenland and Iceland, Coastal and Insular: 302 37 37 35 37 41 59 59 55 45 41 39 35 59 2-3 304 50 50 48 50 55 63 68 64 61 51 52 47 68 30 305 55 49 53 47 63 71 71 61 53 51 59 55 71 4-5 306 45 50 48 44 56 61 64 59 59 63 48 49 64 5 307 34 41 36 45 53 66 69 59 50 47 35 38 69 5 308 48 41 47 45 49 60 63 54 62 47 52 40 63 12 309 53 47 50 48 57 63 63 62 60 51 47 47 63 13 310 45 41 45 41 49 61 63 65 49 39 39 39 65 2-3 311 41 40 43 50 56 65 74 59 52 44 38 38 74 6 312 49 51 49 51 67 73 71 71 63 57 59 47 73 6-7 313 55 51 45 43 55 69 63 59 61 57 47 49 69 4-5 314 61 51 58 62 64 69 76 71 69 65 56 55 76 30 315 43 45 45 57 61 71 69 63 71 53 45 41 71 4-5 316 29 45 37 39 47 65 61 55 61 31 35 39 65 1 317 46 50 46 49 61 69 73 68 66 55 56 49 73 10 318 54 58 60 59 68 72 74 71 69 67 64 60 74 30 319 49 47 49 53 57 69 65 63 61 59 55 49 69 1-2 320 52 48 44 50 62 68 64 62 62 58 57 54 68 10 321 39 51 43 55 61 63 65 63 59 55 45 43 65 4-5 331 49 50 51 59 63 66 72 67 63 58 52 52 72 14 334 49 50 49 56 64 70 75 79 65 59 53 50 79 56 337 48 47 53 65 70 83 71 67 62 58 49 48 83 4 Greenland and Iceland, Inland: 351 6 −9 4 10 16 23 27 22 17 8 −2 −3 27 1 361 45 50 49 66 67 75 83 74 70 60 51 48 83 16
118 | Vol_VII-0124
Table VIII . Absolute maximum temperature (°F.) (cont.) ✓ Station Jan Feb Mar Apr May Jun Jul Aug Sep Oct Nov Dec Ann Yrs Rec Europe, Coastal and Insular: 400 35 32 33 33 41 50 51 53 45 53 45 39 53 10 401 33 31 32 31 32 46 53 45 41 35 33 31 53 1 406 45 50 48 60 73 83 86 83 68 56 50 47 86 49 407 42 42 41 50 68 81 80 74 70 54 45 44 81 10 408 42 41 46 56 69 78 76 77 61 53 44 42 78 55 412 49 49 51 64 74 80 85 79 71 65 52 51 85 55 414 44 46 46 57 66 79 82 76 67 57 50 46 82 55 415 45 41 46 58 83 86 90 85 67 56 44 42 90 38 417 35 34 34 36 54 61 67 68 54 46 38 36 68 6 420 48 50 55 70 76 84 87 81 74 66 55 51 87 55 421 50 54 64 70 84 98 91 86 75 68 55 50 98 50 424 47 43 53 67 77 84 88 64 74 59 49 46 88 44 425 41 42 50 64 81 88 90 94 73 63 51 44 94 44 426 42 43 55 72 86 94 97 93 85 69 56 46 97 157 428 41 39 54 67 83 90 94 89 77 65 60 39 94 95 429 37 36 44 69 80 88 87 86 74 59 45 38 88 33 Europe, Inland: 450 45 46 51 60 75 86 90 84 75 59 45 44 90 46 451 42 43 46 57 78 85 90 85 69 57 46 44 90 44 453 41 41 45 53 73 83 87 83 77 56 42 42 87 10 454 51 53 57 70 79 87 95 86 84 67 58 56 95 20 455 54 54 59 72 82 90 97 88 79 70 56 49 97 53 456 43 45 52 59 66 77 82 84 79 66 61 46 84 44 457 44 46 52 78 84 90 95 88 74 66 51 45 95 44 458 42 43 51 74 82 84 89 87 72 58 46 45 89 27
119 | Vol_VII-0125
Table VIII . Absolute maximum temperature (°F.) (cont.) ✓ Station Jan Feb Mar Apr May Jun Jul Aug Sep Oct Nov Dec Ann Yrs Rec Asia, Coastal and Insular: 500 35 35 33 39 52 49 62 59 56 42 39 35 62 7-8 501 30 31 20 28 34 50 71 71 58 33 31 33 71 5-6 502 27 25 15 29 37 52 66 58 58 32 33 29 66 4-5 503 28 24 30 26 36 48 67 63 56 35 31 29 67 7-8 504 15 9 12 25 40 69 66 64 43 32 17 22 69 4 505 34 35 34 41 56 71 76 73 65 46 41 37 76 38 506 34 32 34 37 45 74 79 67 63 50 43 35 79 24 507 41 42 40 41 55 56 66 68 55 53 42 43 68 17 508 34 32 29 33 35 66 74 62 57 38 33 33 74 5 509 29 28 33 33 38 80 79 72 62 42 33 33 80 6-7 510 31 32 27 32 45 67 73 69 56 40 32 33 73 19 511 26 6 −1 24 38 60 69 72 52 31 14 5 72 2 512 25 13 22 36 74 75 91 81 68 45 25 18 91 7 513 −7 11 21 30 68 85 84 80 68 35 21 12 85 7 514 17 7 14 21 50 60 68 72 54 38 18 22 72 11 515 4 −1 12 27 64 85 89 87 67 41 17 10 89 12 516 26 16 18 27 42 60 64 63 49 37 26 30 64 3 517 22 29 30 33 49 63 65 62 47 38 35 32 65 10 518 35 33 34 40 53 78 78 77 68 50 38 36 78 26 519 33 31 34 40 49 74 80 76 66 47 37 33 80 22 520 33 34 38 48 70 82 85 81 68 57 49 35 85 33 521 32 29 33 36 34 72 73 78 59 48 35 33 78 4 522 11 22 31 36 60 77 88 84 58 38 34 19 88 11 523 28 13 24 34 52 61 75 66 51 36 24 38 75 3
120 | Vol_VII-0126
Table VIII . Absolute maximum temperature (°F.) (cont.) ✓ Station Jan Feb Mar Apr May Jun Jul Aug Sep Oct Nov Dec Ann Yrs Rec Asia, Coastal and Insular: (cont.) 524 33 31 30 32 38 63 75 77 58 50 36 30 77 4 525 43 39 35 38 45 59 67 58 55 44 43 36 67 7 526 34 35 38 40 65 77 82 80 67 53 38 32 82 12 527 34 35 35 42 46 70 75 71 62 46 41 34 75 15 529 37 35 37 39 46 64 73 61 58 50 44 40 73 4 530 35 31 30 37 52 66 74 69 55 47 36 34 74 7 531 35 36 35 47 54 68 77 68 59 53 33 28 77 4 Asia, Inland; 550 26 26 35 44 53 76 85 83 68 40 43 31 85 4-5 551 −3 16 18 35 48 81 84 78 69 39 15 19 84 3 552 24 14 28 43 58 85 86 83 67 48 23 23 86 18 553 30 28 34 38 52 79 85 77 66 47 34 35 85 14 554 27 24 31 41 50 76 83 84 66 48 32 29 84 17 556 2 14 38 52 71 94 93 88 72 48 33 32 94 33 558 8 17 30 42 74 94 92 85 67 51 24 9 94 13 559 −11 −10 30 37 64 91 86 87 66 49 20 6 91 3 560 30 32 46 58 77 84 86 84 76 64 39 36 86 10 561 32 33 44 61 82 88 92 87 81 63 38 35 92 9 562 32 32 41 60 81 85 90 85 77 62 38 35 92 9 563 29 33 49 54 71 84 91 86 74 56 38 32 91 46 565 24 34 53 62 72 95 103 88 83 62 32 24 103 13 566 26 35 48 57 85 92 95 92 80 59 39 30 95 23 567 21 30 41 60 78 93 96 93 78 64 34 22 96 25 568 16 15 40 55 82 90 100 92 78 58 35 26 100 33
121 | Vol_VII-0127
Table VIII . Absolute maximum temperature (°F.) (cont.) ✓ Station Jan Feb Mar Apr May Jun Jul Aug Sep Oct Nov Dec Ann Yrs Rec Asia, Inland (cont.): 570 10 23 40 59 70 86 99 89 77 59 26 5 99 17 571 14 .. 14 32 54 .. .. 72 68 52 23 14 .. 0-1 572 37 35 38 46 58 82 84 80 70 47 40 34 84 21 573 37 35 47 76 89 90 95 91 81 60 44 37 95 21 574 37 41 52 69 86 95 96 91 79 66 47 37 96 37 576 28 31 51 60 79 91 100 96 79 58 35 32 100 25
122 | Vol_VII-0128
Table IX . Absolute minimum temperature (°F.) ✓ Station Jan Feb Mar Apr May Jun Jul Aug Sep Oct Nov Dec Ann Yrs Rec Oceanic: 002 −59 −58 −62 .. .. .. .. .. .. .. .. −50 −62 3 003 −46 −46 −43 .. .. .. .. .. .. .. .. −41 −46 2 004 0 −2 −1 5 15 23 31 30 23 11 8 −1 −2 7 006 −52 −53 −50 −40 −16 13 24 17 0 −24 −32 −43 −53 5-6 007 −41 −37 −39 −26 −2 13 24 24 13 −6 −28 −39 −41 5-6 008 −48 −12 .. .. 2 18 28 18 −11 −32 −32 −32 .. 0-1 Alaska, Coastal and Insular: 100 −52 −56 −52 −42 −18 8 22 20 4 −25 −43 −55 −56 25-30 101 −25 −37 −31 −17 −5 22 28 30 28 2 −11 −29 −37 1 102 −55 −50 −58 −29 −15 20 30 26 18 −17 −37 −49 −58 12-18 103 −31 −39 −37 −21 −11 24 34 32 22 0 −13 −25 −39 2 104 −47 −41 −38 −30 −6 20 28 23 16 −4 −26 −42 −47 34-35 105 −27 −31 −31 −18 3 25 30 32 21 15 0 −25 −31 4-9 106 −33 −32 −19 −15 20 29 34 31 19 −6 −18 −36 −36 22-25 Alaska, Inland: 150 −50 −58 −58 −32 −14 31 39 23 15 −28 −50 −52 −58 3-5 151 −53 −63 −53 −37 −17 24 32 26 14 −21 −53 −51 −63 1-2 152 −62 −55 −47 −39 −4 32 32 21 −2 −12 −48 −58 −62 5-8 153 −67 −70 −50 −41 −3 25 25 22 7 −30 −61 −71 −71 23-27 154 −46 −40 −34 −25 3 28 30 30 18 −5 −27 −40 −46 17-18 155 −76 −68 −57 −40 −4 23 29 18 3 −27 −55 −68 −76 36-40 156 −66 −54 −44 −25 4 32 34 28 12 −28 −38 −59 −66 11 157 −75 −74 −56 −38 2 23 25 16 2 −28 −54 −69 −75 32-36
123 | Vol_VII-0129
Table IX . Absolute maximum temperature (°F.) (cont.) ✓ Station Jan Feb Mar Apr May Jun Jul Aug Sep Oct Nov Dec Ann Yrs Rec Canada, Coastal and Insular: 204 −49 −45 −43 −37 −19 12 29 22 5 −9 −31 −41 −49 4-5 211 −51 −57 −49 −37 −14 11 22 24 9 −12 −42 −41 −57 10 213 −56 −56 −55 −43 −22 16 28 27 13 −13 −41 −50 −56 6-8 214 −41 −47 −45 −28 −12 15 27 25 16 −5 −25 −40 −47 5 216 −45 −44 −40 −33 −9 21 34 30 18 −9 −29 −39 −45 15 221 −47 −46 −39 −28 −7 20 33 34 21 −2 −30 −38 −46 16 222 −57 −52 −51 −35 −20 13 30 28 8 −13 −32 −43 −57 5 223 −40 −42 −32 −26 −8 10 25 26 20 4 −21 −34 −42 8-10 225 −40 −43 −39 −29 −9 19 31 30 20 −6 −32 −36 −43 4 226 −46 −46 −45 −32 −15 24 30 31 20 2 −22 −42 −46 7-8 227 −30 −32 −22 −14 2 16 27 27 14 −2 −10 −18 −32 5-8 228 −57 −52 −52 −26 −14 13 22 25 15 −17 −53 −47 −57 30 Canada, Inland: 250 −56 −56 −50 −44 −14 20 30 29 12 −22 −50 −54 −56 8 252 −52 −45 −34 −9 21 32 36 30 18 −1 −30 −43 −52 44 253 −60 −57 −31 −14 19 28 29 17 20 1 −43 −54 −60 6 254 −54 −51 −44 −28 8 31 35 27 15 −13 −41 −52 −54 13 255 −44 −42 −29 −5 22 34 37 30 23 7 −29 −37 −44 9 256 −65 −64 −50 −45 −11 22 26 18 4 −27 −47 −64 −65 32 258 −49 −44 −34 −14 22 33 39 32 24 2 −24 −41 −49 17 259 −46 −44 −37 −16 15 28 41 35 25 3 −25 −42 −46 11 260 −53 −55 −40 −23 4 31 44 38 19 3 −30 −41 −55 … 262 −51 −46 −40 −18 16 28 34 28 20 0 −25 −45 −51 29 263 −54 −50 −36 −9 19 28 35 30 19 3 −28 −45 −54 32
124 | Vol_VII-0130
Table IX . Absolute maximum temperature (°F.) (cont.) ✓ Station Jan Feb Mar Apr May Jun Jul Aug Sep Oct Nov Dec Ann Yrs Rec Greenland and Iceland, Coastal and Insular: 302 −33 −39 −35 −23 −9 22 30 24 6 −11 −29 −37 −39 2-3 304 −37 −40 −38 −26 8 10 24 24 14 0 −17 −4 −40 30 305 −9 −21 −11 1 8 28 33 30 26 16 −3 −3 −21 4-5 306 −20 −24 −17 −15 2 25 35 36 24 10 4 −6 −24 5 307 −39 −48 −41 −36 −10 21 27 23 4 −23 −31 −36 −48 5 308 −37 −38 −42 −30 0 22 28 26 10 −13 −27 −38 −42 12 309 −28 −27 −24 −14 1 24 31 34 20 11 −1 −11 −28 13 310 −15 −25 −21 −9 4 24 32 34 26 18 −3 0 −25 2-3 311 −28 −35 −32 −16 10 30 35 35 25 −1 −10 −22 −35 23 312 −35 −37 −37 −17 4 30 32 24 12 −13 −35 −33 −37 6-7 313 −9 −21 −17 −3 8 28 33 30 26 18 −1 1 −21 4-5 314 −10 −16 −10 −5 10 22 29 30 22 11 2 −9 −16 30 315 4 −11 2 10 18 24 28 30 28 18 14 6 −11 4-5 316 0 −7 −7 1 3 24 22 28 28 14 6 2 −7 1 317 −4 −10 −8 −1 13 25 29 28 25 10 3 −4 −10 10 318 −12 −16 −12 −5 14 28 33 31 16 9 0 −7 −16 30 319 0 −7 4 12 26 30 30 34 26 10 6 −3 −7 1-2 320 5 10 6 8 20 28 30 31 29 23 15 8 5 10 321 8 1 4 14 14 24 30 28 28 24 14 12 1 4-5 331 6 8 8 13 24 32 39 34 27 18 10 10 6 14 334 −23 −13 −22 −11 10 20 27 27 23 12 1 −5 −23 51 337 9 12 14 25 23 31 38 35 31 22 15 15 9 4 Greenland and Iceland, Inland: 351 −84 −84 −85 −74 −46 −22 −19 −31 −42 −79 −74 −83 −85 1 361 −36 −14 −20 −11 3 21 27 26 10 1 −13 −22 −36 16
125 | Vol_VII-0131
Table IX . Absolute minimum temperature (°F.) (cont.) ✓ Station Jan Feb Mar Apr May Jun Jul Aug Sep Oct Nov Dec Ann Yrs Rec Europe, Coastal and Insular: 400 −38 −39 −39 −29 −4 15 30 22 2 −19 −38 −33 −39 10 401 −35 −45 −35 −33 −5 17 24 21 −8 −27 −34 −32 −45 1 406 1 −2 −3 9 15 27 33 31 26 14 7 2 −3 49 407 −5 −5 −1 5 20 30 36 36 29 16 8 −5 −14 10 408 −8 −11 −2 6 14 25 30 30 24 8 6 −3 −11 55 412 3 −4 3 11 20 31 35 36 30 10 5 −4 −4 55 414 0 −1 3 6 17 23 34 30 24 8 3 2 −1 55 415 −45 −36 −38 −18 3 27 30 29 17 −10 −23 −39 −45 27 417 −23 −29 −33 −21 −4 15 30 25 17 3 −5 −23 −33 6 420 3 2 8 14 25 33 38 36 30 19 12 0 0 55 421 −31 −26 −20 0 18 28 37 35 25 5 −9 −24 −31 50 424 −23 −21 −16 12 25 34 42 32 28 14 −5 −18 −23 44 425 −41 −41 −32 −16 10 26 30 24 16 −5 −24 −34 −41 44 426 −28 −38 −19 1 22 33 43 37 28 9 1 −39 −39 37 428 −49 −41 −35 −18 8 26 34 33 20 −5 −22 −45 −49 37 429 −47 −43 −47 −25 4 23 28 25 13 −14 −45 −52 −52 38 Europe, Inland: 450 −50 −50 −44 −25 −7 22 30 25 9 −18 −33 −44 −50 46 451 −59 −59 −46 −34 −6 23 27 19 3 −27 −43 −52 −59 44 453 −43 −43 −34 −23 0 25 30 28 16 −9 −21 −37 −43 10 454 −8 −15 −10 6 14 31 35 35 27 9 1 −10 −15 20 455 −26 −27 −24 −6 14 28 34 33 23 0 −16 −29 −29 53 456 −45 −49 −36 −17 0 23 28 25 19 −8 −29 −40 −49 44 457 −37 −35 −25 2 18 29 38 32 20 6 −12 −35 −37 44 458 −36 −37 −25 −12 10 25 33 31 20 2 −13 −32 −37 27
126 | Vol_VII-0132
Table IX . Absolute minimum temperature (°F.) (cont.) ✓ Station Jan Feb Mar Apr May Jun Jul Aug Sep Oct Nov Dec Ann Yrs Rec Asia, Coastal and Insular: 500 −33 −30 −31 −26 −3 13 23 26 11 −4 −20 −29 −33 7-8 501 −55 −46 −48 −39 −15 15 25 24 16 −17 −48 −46 −55 5-6 502 −53 −50 −49 −41 −13 11 28 26 14 −23 −37 −45 −53 4-5 503 −50 −45 −44 −43 −14 10 26 23 2 −21 −39 −46 −50 7-8 504 −46 −44 −43 −35 −18 19 27 25 16 −5 −24 −41 −46 4 505 −42 −39 −47 −25 −10 1 14 30 9 0 −29 −32 −47 37 506 −45 −40 −43 −30 −11 13 24 22 18 4 −22 −37 −45 24 507 −38 −39 −41 −28 −10 13 25 27 7 −12 −23 −41 −41 17 508 −52 −54 −43 −32 −10 11 26 28 14 −6 −38 −43 −54 5 509 −60 −49 −45 −32 −10 12 28 27 14 −20 −40 −46 −60 6-7 510 −52 −55 −46 −35 −13 6 27 26 11 −18 −39 −49 −55 19 511 −54 −64 −54 −35 −17 9 31 29 10 −21 −40 −57 −64 2 512 −54 −57 −47 −30 −14 18 29 27 18 −27 −49 −50 −57 7 513 −63 −60 −52 −39 −19 20 31 27 −1 −34 −50 −58 −63 5 514 −54 −48 −42 −37 −15 11 26 24 12 −16 −40 −46 −54 11 515 −63 −61 −55 −49 −22 11 30 23 2 −30 −47 −58 −63 12 516 −46 −41 −42 −25 −10 22 28 28 19 −12 −30 −40 −46 3 517 −43 −43 −50 −34 −13 14 23 24 6 −10 −28 −34 −50 10 518 −47 −46 −44 −33 −12 5 25 24 14 −7 −28 −43 −47 26 519 −50 −58 −47 −32 −15 10 23 25 18 −16 −39 −51 −58 22 520 −63 −65 −53 −28 −14 20 33 30 15 −18 −53 −61 −65 18 521 −55 −50 −49 −33 −20 11 30 28 20 −19 −37 −52 −55 4 522 −60 −60 −55 −37 −24 27 33 27 12 −24 −52 −55 −60 7 523 −44 −46 −42 −31 −19 10 28 28 10 −22 −29 −33 −46 3
127 | Vol_VII-0133
Table IX . Absolute minimum temperature (°F.) (cont.) ✓ Station Jan Feb Mar Apr May Jun Jul Aug Sep Oct Nov Dec Ann Yrs Rec Asia, Coastal and Insular (cont): 524 −43 −39 −39 −29 −24 19 27 27 23 −1 −27 −35 −43 4 525 −48 −48 −43 −22 −13 17 27 27 20 −12 −36 −39 −48 7 526 −59 −52 −52 −23 −3 28 35 25 8 −21 −39 −50 −59 12 527 −50 −48 −43 −39 −10 21 35 30 14 −9 −34 −49 −50 15 528 −39 −48 −35 −27 −12 14 29 29 23 1 −20 −28 −48 3 529 −24 −38 −31 −26 −8 23 32 36 26 12 −3 −38 −38 4 530 −38 −37 −40 −21 −5 16 31 28 16 0 −24 −31 −40 7 531 −53 −58 −25 −16 5 18 32 27 17 −22 −37 −49 −58 4 Asia, Inland: 550 −72 −65 −54 −37 −14 19 34 29 8 −30 −60 −57 −72 4-5 551 −61 −66 −60 −42 −18 8 32 31 7 −29 −49 −56 −66 3 552 −72 −75 −61 −43 −10 17 30 25 −4 −36 −59 −72 −75 12 553 −63 −62 −52 −39 −17 11 31 22 4 −24 −53 −55 −63 14 554 −70 −67 −56 −39 −25 8 31 29 −4 −29 −54 −64 −70 17 556 −90 −94 −77 −66 −30 19 28 18 2 −48 −72 −84 −94 33 558 −71 −72 −61 −42 −16 22 33 24 9 −30 −53 −72 −72 9 559 −66 −67 −54 −41 0 28 35 20 7 −30 −46 −55 −67 3 560 −55 −44 −48 −17 1 25 38 32 18 12 −41 −57 −57 10 561 −49 −41 −39 −14 5 29 34 30 20 −21 −42 −52 −52 9 562 −60 −56 −47 −27 −9 22 39 28 13 −20 −57 −67 −67 18 563 −75 −78 −63 −39 −16 20 29 22 5 −46 −68 −78 −78 13 565 −75 −70 −56 −37 −11 17 31 21 2 −39 −60 −74 −75 13 566 −76 −72 −50 −31 3 28 36 28 13 −26 −59 −69 −76 23 567 −76 −68 −58 −34 −9 28 32 21 −3 −32 −60 −72 −76 11
128 | Vol_VII-0134
Table IX . Absolute minimum temperature (°F.) (cont.) ✓ Station Jan Feb Mar Apr May Jun Jul Aug Sep Oct Nov Dec Ann Yrs Rec Asia, Inland (cont): 568 −81 −84 −56 −39 −1 24 36 27 13 −31 −64 −76 −84 33 570 −76 −76 −56 −31 −3 26 34 26 11 −34 −60 −73 −76 17 571 −51 −56 −54 −34 .. .. .. .. .. 3 −56 −54 .. 0-1 572 −75 −72 −57 −40 −14 23 27 22 4 −34 −61 −65 −75 17 573 −51 −36 −40 −8 6 30 39 32 21 −4 −40 −49 −51 16 574 −65 −58 −46 −20 4 30 39 32 8 −16 −49 −60 −65 34 576 −66 −63 −49 −30 −5 23 31 23 4 −29 −49 −59 −66 26 577 −72 −66 −54 −32 7 26 30 22 7 −33 −53 −72 −72 9
129 | Vol_VII-0135
Table X . Mean temperature (°F.) ✓ Station Jan Feb Mar Apr May Jun Jul Aug Sep Oct Nov Dec Ann Yrs Rec Oceanic: 001 −19 −24 −23 −9 11 24 29 26 17 4 −5 .. … 0-1 002 −32 −32 −23 −9 12 29 32 29 16 −7 −20 −26 −3 2-3 003 −27 −22 −23 −7 10 29 32 31 21 6 −12 −21 1 2 004 23 22 21 25 30 36 41 42 38 32 27 24 30 11 005 15 12 12 18 28 35 40 39 35 29 21 19 25 .. 006 −14 −13 −18 −8 14 29 34 32 26 13 −2 −13 7 5-6 007 −9 −8 −15 −1 17 30 33 33 31 19 3 −5 11 5-6 008 −16 8 .. .. 14 28 32 30 10 −5 −12 −7 … 0-1 Alaska, Coastal, and Insular: 100 −17 −17 −15 0 20 35 40 39 31 17 0 −12 10 26-31 101 −1 −7 −11 13 24 35 42 42 38 27 8 1 23 1 102 −10 −6 −1 14 30 44 53 51 41 24 6 −4 20 13-19 103 −4 −2 −5 12 26 36 46 44 39 30 11 5 5 2 104 3 6 9 20 34 46 50 50 42 29 16 8 26 34-36 105 1 2 7 20 30 39 46 48 43 32 26 11 25 4-8 106 12 19 24 35 45 54 57 56 48 36 22 13 35 23-26 Alaska, Inland: 150 −2 −2 −4 16 36 52 59 48 39 22 2 −5 20 3-5 151 −23 −45 −15 −4 20 42 52 43 37 9 −9 −16 13 1-2 152 −11 −7 0 21 40 57 56 52 41 22 0 −7 22 7-8 153 −21 −16 0 22 43 58 61 55 42 21 −6 −20 20 21-27 154 7 9 12 27 40 53 54 53 45 31 17 8 30 17-19 155 −12 −4 6 25 44 57 58 53 41 24 1 −10 24 34-41
130 | Vol_VII-0136
Table X . Mean temperature (°F.) (cont.) ✓ Station Jan Feb Mar Apr May Jun Jul Aug Sep Oct Nov Dec Ann Yrs Rec Alaska, Inland: (cont.) 156 −11 −1 10 29 47 58 60 55 44 27 3 −7 26 36-38 157 −13 −4 8 27 45 56 59 54 42 25 4 −11 24 30-34 Canada, Coastal and Insular: 200 −34 −37 −28 −11 16 32 37 35 15 −9 −22 −27 −3 8 201 −37 −43 −24 −12 16 33 37 34 15 −9 −26 −30 −4 3 202 −34 −20 −26 −11 13 34 37 33 20 −2 −15 −23 1 5 203 −36 −26 −30 −13 11 33 40 34 15 −2 −15 −26 −1 2 204 −21 −23 −14 −2 17 34 41 38 28 12 −5 −18 7 5 205 −26 −26 −23 −9 17 37 41 38 26 5 −7 −23 4 3 206 −15 −14 −12 2 24 37 49 40 28 15 −3 −16 11 3 207 −32 −32 −24 −3 16 34 39 35 23 1 −12 −22 2 3 209 −32 −30 −21 −4 16 34 38 35 22 7 −8 −26 3 5 210 −18 −26 −18 −5 16 32 41 36 26 9 −9 −17 6 5 211 −20 −27 −17 −4 20 36 43 41 30 14 −6 −17 8 10 213 −26 −29 −21 −2 20 36 42 41 32 15 −5 −21 7 18 214 −14 −16 −12 −2 20 33 39 39 32 21 3 −9 11 5 215 −19 −14 −10 2 20 36 44 42 32 15 −4 −15 11 9 216 −19 −19 −16 0 22 38 50 46 36 18 −6 −16 11 13 217 −23 −25 −22 −5 14 37 49 44 33 11 −11 −23 7 13 219 −24 −25 −18 2 23 30 40 35 28 13 −7 21 7 4 220 −20 −25 −9 8 28 36 42 42 36 21 3 −10 13 2 221 −27 −25 −16 2 21 37 49 47 38 22 −2 −17 11 18 222 −25 −20 −14 2 19 35 46 46 32 18 1 −17 10 8
131 | Vol_VII-0137
Table X . Mean temperature (°F.) (cont.) ✓ Station Jan Feb Mar Apr May Jun Jul Aug Sep Oct Nov Dec Ann Yrs Rec Canada, Coastal and Insular: (cont.) 223 −14 −14 −4 9 25 35 42 42 35 25 9 −6 15 14 224 −15 −12 −3 11 28 38 46 44 36 25 12 −4 17 22 225 −11 −19 −10 6 24 36 45 43 34 24 12 −5 15 3 226 −16 −16 −7 8 25 37 45 44 37 25 11 −8 15 12 227 −1 −2 8 16 27 33 38 39 35 29 21 7 21 15 228 −19 −17 −6 14 30 43 54 52 42 27 6 −11 18 30 Canada, Inland: 250 −19 −16 −10 9 31 49 56 50 38 20 −4 −17 16 20 251 −21 −15 −7 10 34 53 58 53 39 19 −7 −16 17 28 252 −21 −12 4 29 46 57 60 55 42 26 1 −14 23 41 253 8 13 22 33 46 55 56 54 46 36 14 7 32 6 254 −24 −19 −10 14 38 54 59 56 40 21 −6 −20 17 31 255 −4 3 16 33 46 55 58 55 46 34 7 −4 29 9 256 −19 −13 −2 19 41 55 59 54 42 25 −1 −15 20 30 257 −19 −13 −2 19 41 55 59 54 42 25 −1 −15 20 31 258 −18 −11 1 26 45 56 62 57 46 29 4 −12 24 42 259 −16 −10 0 23 40 50 59 57 46 32 9 −7 24 45 260 −13 −13 1 21 38 54 61 58 45 34 8 −9 24 .. 261 −17 −10 −2 21 41 52 60 54 45 31 10 −9 23 24 262 −16 −9 3 26 45 54 60 56 45 30 10 −9 25 25 263 −13 −5 8 31 48 56 61 57 46 32 10 −6 27 30 Greenland, Iceland, Coastal and Insular: 300 −33 −36 −30 −11 15 33 38 35 17 −7 −19 −24 −2 ..
132 | Vol_VII-0138
Table X . Mean temperature (°F.) (cont.) ✓ Station Jan Feb Mar Apr May Jun Jul Aug Sep Oct Nov Dec Ann Yrs Rec Greenland, Iceland, Coastal and Insular: (cont.) 301 −11 −12 −7 5 .. 35 39 38 28 13 2 −11 … 5 302 −7 −12 −10 −1 22 35 41 38 27 15 5 −9 12 3-4 303 −7 −17 −8 −3 19 34 40 36 25 6 −5 −6 9 2 304 −4 −6 −1 10 27 37 43 42 35 25 16 6 19 30 305 19 14 18 23 33 40 45 43 38 32 25 23 30 4-5 306 7 8 13 20 33 42 49 46 37 29 22 18 27 5 307 −4 −6 −7 3 21 35 39 38 30 13 6 0 14 15 308 1 −2 2 10 24 35 40 38 32 19 9 4 18 5 309 11 7 12 20 33 42 46 45 39 29 23 18 27 13 310 13 3 6 13 27 38 42 42 36 27 20 17 24 2-3 311 3 3 10 19 36 44 48 48 39 27 18 9 25 23 312 4 2 4 16 36 49 50 46 37 24 13 8 24 6-7 313 18 12 12 20 32 41 44 43 38 30 25 21 28 4-5 314 16 16 21 27 37 42 47 46 40 31 24 19 31 30 315 23 21 24 28 35 41 45 45 40 33 27 27 25 4-5 316 13 16 18 22 27 38 42 39 40 22 21 20 26 1 317 18 16 19 25 34 41 45 43 38 30 23 20 29 36 318 19 20 24 32 41 46 50 48 42 35 27 22 34 30 319 25 24 27 31 39 45 45 46 40 33 27 25 35 1-2 320 22 23 26 31 37 41 43 42 39 35 29 25 33 37 321 25 24 27 30 36 41 44 44 41 35 30 27 34 4-5 330 34 35 35 36 43 49 52 51 45 38 35 35 41 17 331 32 33 35 39 44 49 52 51 46 39 35 33 41 14
133 | Vol_VII-0139
Table X . Mean temperature (°F.) (cont.) ✓ Station Jan Feb Mar Apr May Jun Jul Aug Sep Oct Nov Dec Ann Yrs Rec Greenland, Iceland, Coastal and Insular: (cont.) 334 28 27 26 26 35 42 45 45 42 36 31 29 35 21 336 30 30 31 36 43 49 52 51 46 37 33 33 39 10 337 32 33 36 40 45 49 52 51 48 40 36 35 41 11 340 33 33 33 36 42 48 51 50 46 39 36 34 40 18 Greenland, Iceland, Inland: 350 −24 −33 .. .. .. .. .. .. 1 −17 −28 −24 … 0-1 351 −42 −53 −40 −24 −5 4 12 1 −8 −32 −46 −37 −22 1 361 22 24 24 29 36 45 50 46 40 33 25 25 33 17 Europe, Coastal and Insular: 400 1 2 7 2 18 30 34 33 28 18 8 2 14 10 401 −4 −5 −10 −1 16 29 33 32 23 13 3 −2 10 1 403 3 1 2 7 23 35 42 41 32 21 11 7 19 19 404 11 4 5 16 27 35 40 39 32 24 14 12 21 15 405 4 −7 −5 9 21 32 38 37 28 16 10 8 16 15 406 26 24 26 30 37 44 50 51 44 36 29 26 35 50 407 24 22 24 29 39 47 54 53 44 36 31 28 36 10 408 21 20 23 28 35 42 48 48 44 34 28 24 33 20 409 33 32 33 38 43 50 54 54 50 43 38 33 42 60 410 34 33 33 36 41 46 50 51 47 42 38 35 41 60 411 30 29 30 35 42 50 55 54 47 40 34 31 40 60 412 29 28 20 36 42 50 55 54 48 40 34 29 39 60 413 30 28 29 33 39 46 50 51 46 39 33 30 38 60 414 26 25 26 32 39 47 52 51 44 36 30 27 36 60
134 | Vol_VII-0140
Table X . Mean temperature (°F.) (cont.) ✓ Station Jan Feb Mar Apr May Jun Jul Aug Sep Oct Nov Dec Ann Yrs Rec Europe, Coastal and Insular: (cont.) 415 11 11 17 29 38 48 55 51 43 31 20 13 31 35 416 17 15 18 25 32 40 47 47 42 33 26 20 30 21 417 13 9 6 16 28 36 45 48 41 32 25 18 26 6 418 −1 1 6 19 31 42 54 50 41 28 13 5 24 17 419 12 11 18 28 37 47 53 51 44 32 21 14 31 60 420 32 31 32 38 44 51 55 55 50 42 36 32 41 60 421 21 20 26 35 45 55 60 58 50 39 31 23 39 26 423 11 10 16 28 40 53 58 55 45 34 23 14 32 33 424 21 20 25 34 46 57 62 60 51 42 32 25 40 92 425 12 12 18 30 41 51 58 54 45 34 24 16 33 35 426 18 18 25 37 49 58 64 60 51 41 30 22 39 35 428 8 10 17 30 41 53 60 55 46 34 21 12 32 35 429 6 7 15 28 38 50 57 52 43 31 19 10 30 40 Europe, Inland: 450 5 6 12 24 36 49 54 50 41 27 16 8 27 22 451 4 5 12 25 37 49 55 51 42 28 14 5 27 60 453 12 7 16 27 40 52 58 53 42 30 22 18 31 30 454 26 28 32 39 46 52 58 55 48 40 32 28 40 20 455 20 21 27 37 48 59 61 58 49 39 30 22 40 29 456 9 9 17 29 41 51 55 51 43 31 22 12 31 20 457 16 15 24 35 47 56 63 58 49 37 28 21 37 20 459 3 8 19 33 46 56 62 56 45 31 18 7 32 35 460 −1 4 13 27 26 49 58 53 43 29 14 4 28 35
135 | Vol_VII-0141
Table X . Mean temperature (°F.) (cont.) ✓ Station Jan Feb Mar Apr May Jun Jul Aug Sep Oct Nov Dec Ann Yrs Rec Asia, Coastal and Insular: 500 3 2 −5 5 19 30 35 36 32 24 13 5 17 7-8 501 −15 −12 −19 −4 17 31 38 37 32 15 −3 −11 9 5-6 502 −19 −14 −19 −6 15 32 40 37 32 13 −6 −14 8 4-5 503 −17 −13 −19 −7 15 30 35 34 29 14 −2 −12 7 7-8 505 13 8 5 15 25 35 44 44 38 29 23 15 24 17 506 8 3 0 12 23 34 43 43 39 30 23 13 23 24 507 6 2 −3 10 24 34 42 43 36 27 19 9 21 17 508 −5 −7 −11 2 19 31 39 41 36 23 11 0 15 5 509 −12 −11 −12 2 20 28 48 46 37 20 2 −10 14 6-7 510 −10 −7 −12 2 19 33 40 41 35 20 3 −7 13 19 511 −30 −34 −29 −8 13 32 42 42 32 5 −16 −29 2 2 512 −20 −18 −20 −1 24 39 48 47 36 14 −10 −16 10 7 514 −22 −23 −20 −7 15 33 37 37 32 15 −7 −18 6 11 515 −34 −32 −23 −8 19 40 52 43 33 10 −14 −27 5 12 517 −11 −13 −10 1 17 33 37 35 29 18 4 −5 11 10 518 5 0 −1 12 24 35 44 45 40 29 20 8 22 26 519 −1 −4 −5 10 23 35 43 44 39 26 14 1 19 22 520 −14 −8 0 13 28 45 57 52 41 24 2 −7 19 33 521 −7 −9 −7 9 23 38 51 50 40 24 7 −7 18 13 522 −39 −33 −16 3 28 51 54 48 35 10 −10 27 9 10 523 −20 −15 −10 −4 18 34 39 37 30 17 −1 −8 10 3 524 −14 −18 −12 14 18 34 40 41 36 21 3 −9 12 4 525 −5 −8 −3 8 22 35 42 40 35 24 10 1 17 7
136 | Vol_VII-0142
Table X . Mean temperature (°F.) (cont.) ✓ Station Jan Feb Mar Apr May Jun Jul Aug Sep Oct Nov Dec Ann Yrs Rec Asia, Coastal and Insular: (cont.) 526 −11 −9 1 15 33 49 56 52 41 22 3 −8 20 16 527 −10 −6 −4 5 25 41 51 49 39 23 5 −7 17 23 529 6 3 6 18 29 39 45 44 38 28 16 11 24 4 530 1 −3 1 13 25 38 45 43 37 26 13 5 20 7 531 −5 −6 11 22 33 44 51 53 45 26 5 −5 23 4 Asia, Inland: 550 −22 −13 −14 5 22 42 54 48 38 13 −11 −18 12 4-5 551 −28 −22 −20 −5 22 39 54 48 35 13 −12 −16 9 3 553 −14 −10 −9 4 21 40 54 49 39 20 −3 −13 15 14 556 −58 −48 −24 9 36 56 60 52 36 6 −34 −51 3 38 557 −49 −34 −20 7 29 50 53 50 38 9 −22 40 6 3 559 −40 −32 −17 −9 34 55 58 50 39 14 −18 −34 10 10 560 −10 −4 6 22 35 50 60 53 42 28 4 −8 23 9-10 563 −18 −10 2 15 31 48 61 55 41 20 −4 −17 19 46 565 −33 −21 −3 21 41 60 67 58 42 21 −11 −31 18 13 566 −32 −19 −1 23 43 60 67 58 44 23 −6 −26 20 25 567 −38 −24 −4 18 40 59 65 58 42 17 −15 −35 15 25 568 −46 −33 −9 17 41 60 66 59 43 17 −20 −40 13 77 569 −21 −19 −13 5 21 42 47 42 33 12 −12 −14 10 1 570 −44 −31 −8 25 41 58 65 58 44 19 −11 −34 15 17 572 −20 −14 −10 5 28 50 57 50 37 17 −4 −15 15 25 576 −23 −14 1 21 39 56 63 55 41 21 −3 −18 20 33 577 −14 −9 3 24 43 57 62 55 40 23 1 −20 22 9
137 | Vol_VII-0143
Table XI . Mean daily maximum temperature (°F.) ✓ Station Jan Feb Mar Apr May Jun Jul Aug Sep Oct Nov Dec Ann Yrs Rec Oceanic: 004 27 27 25 28 32 38 43 44 39 33 28 26 33 7 006 −5 −6 −13 −1 18 32 36 35 29 19 4 −5 12 5-6 007 1 0 −8 4 20 32 35 36 33 22 8 3 15 5-6 Alaska, Coastal and Insular: 100 −11 −11 −7 8 25 40 47 44 35 22 6 −5 16 25-29 101 5 −1 −6 20 30 39 46 45 42 31 13 6 28 1 102 −1 0 4 23 36 50 58 56 46 30 12 3 26 8-12 103 2 5 2 19 31 41 50 49 43 34 17 13 29 2 104 11 13 17 27 41 53 56 55 48 35 21 14 32 33-35 105 7 9 9 22 33 42 48 48 43 35 25 12 27 6-7 106 19 27 33 44 54 62 65 64 57 44 30 20 .. 22-25 Alaska, Inland: 150 6 6 8 26 45 62 69 57 46 29 11 2 28 3-4 151 −16 −18 −7 8 28 50 63 51 39 17 −2 −11 21 1-2 152 −2 1 14 35 51 70 67 63 51 30 8 1 32 6-7 153 −11 −6 13 35 56 70 72 66 52 28 2 −11 30 19-21 154 16 17 22 36 50 63 63 61 53 38 24 15 38 16-18 155 −4 5 18 36 56 70 71 65 51 31 8 −2 34 33-38 156 −2 5 22 42 58 70 71 64 53 35 12 0 36 11 157 −6 6 21 40 58 70 72 67 52 34 11 −3 35 26-32 Canada, Coastal and Insular: 204 −13 −16 −6 8 25 39 48 42 32 16 0 −12 14 7 205 −20 −19 −16 −1 24 43 48 43 32 10 −1 −18 10 3 206 −9 −7 −6 9 30 43 56 45 32 19 4 −11 17 3
138 | Vol_VII-0144
Table XI . Mean daily maximum temperature (°F.) (cont.) ✓ Station Jan Feb Mar Apr May Jun Jul Aug Sep Oct Nov Dec Ann Yrs Rec Canada, Coastal and Insular (cont.): 210 −12 −20 −10 2 22 37 47 41 30 14 −3 −11 11 5 211 −13 −20 −9 5 27 41 51 47 34 20 −1 −10 14 10 212 −11 −14 −3 8 28 40 47 43 36 20 6 −5 16 3-4 213 −19 −22 −13 7 28 42 48 46 35 20 1 −14 13 18 214 −6 −9 −4 6 27 38 46 46 36 26 9 −2 18 5 215 −13 −8 −3 9 26 42 51 47 36 20 2 −10 17 9 216 −12 −12 −8 9 30 45 58 52 42 23 1 −9 18 13 217 −15 −17 −14 4 27 43 57 50 36 17 −4 −17 14 13 221 −21 −19 −9 9 27 43 57 53 42 27 5 −11 17 18 222 −17 −12 −5 12 27 41 54 53 37 24 8 −10 18 8 223 −8 −8 3 16 30 40 49 48 39 29 15 0 21 14 224 −8 −5 5 19 34 44 53 50 41 30 17 2 23 22 225 −5 −12 −1 14 30 42 51 49 39 29 16 4 21 3 226 −9 −9 2 17 32 42 52 49 42 30 17 −2 22 12 227 5 4 14 21 31 37 42 43 38 32 24 12 25 15 228 −11 −8 4 24 38 52 65 62 49 34 13 −3 26 30 Canada, Inland: 250 −11 −9 −2 19 40 59 66 59 44 25 3 −10 24 20 251 −13 −6 4 22 44 64 68 63 46 25 0 −8 26 28 252 −14 −4 16 41 59 70 73 67 52 33 7 −8 33 41 253 15 23 31 43 58 67 67 65 55 42 21 15 42 6 254 −14 −10 3 27 50 67 72 70 49 29 2 −11 28 31 255 5 15 29 44 59 67 70 67 56 41 14 4 39 9 256 −12 −4 9 31 53 68 71 65 51 31 5 −8 30 30
139 | Vol_VII-0145
Table XI . Mean daily maximum temperature (°F.) (cont.) ✓ Station Jan Feb Mar Apr May Jun Jul Aug Sep Oct Nov Dec Ann Yrs Rec Canada, Inland (cont.): 257 −12 −4 9 31 53 68 71 65 51 31 5 −8 30 31 258 −10 0 13 38 56 68 74 68 56 36 11 −4 34 42 259 −6 1 12 34 50 60 70 67 55 40 17 2 34 45 260 −5 −4 12 32 46 63 69 66 50 39 15 −1 32 … 261 −11 −3 7 31 51 62 70 65 52 36 15 −4 31 24 262 −8 1 15 38 56 67 74 69 55 38 18 0 35 26 263 −1 10 24 45 61 70 75 71 59 43 21 5 40 30 Greenland and Iceland, Coastal and Insular: 302 1 −4 −2 9 28 41 46 43 33 23 13 −1 19 3-4 304 2 0 7 18 34 43 49 48 40 29 21 11 25 30 305 24 19 23 28 37 46 50 49 42 35 29 29 35 4-5 306 13 16 18 26 38 46 54 50 41 32 26 22 32 5 307 26 28 27 32 41 59 61 56 46 39 28 27 39 5 308 12 12 14 22 33 43 49 45 39 25 19 15 27 12 309 16 14 18 26 39 48 51 50 42 33 28 23 32 13 310 18 9 12 20 31 43 47 46 39 31 24 21 29 2-3 311 26 15 24 26 40 49 50 50 44 32 26 18 38 2-3 312 11 10 13 24 45 57 58 55 44 30 21 14 32 6-7 313 22 18 17 25 37 47 50 48 42 34 28 25 33 4-5 314 21 21 27 34 44 50 55 53 45 35 29 24 36 30 315 27 26 30 35 42 47 51 50 45 37 31 29 38 4-5 316 18 23 23 29 32 45 49 47 45 26 26 25 32 1 317 25 26 30 36 44 50 55 52 46 35 31 28 38 10 318 25 27 32 39 48 54 57 55 48 40 33 28 40 30
140 | Vol_VII-0146
Table XI . Mean daily maximum temperature (°F.) (cont.) ✓ Station Jan Feb Mar Apr May Jun Jul Aug Sep Oct Nov Dec Ann Yrs Rec Greenland and Iceland, Coastal and Insular (cont.): 319 31 30 33 36 45 53 52 52 45 38 32 31 41 1-2 320 31 33 32 41 46 50 52 52 48 42 36 33 41 10 321 29 28 31 34 40 47 50 50 46 39 33 31 38 4-5 331 38 38 40 44 49 54 57 56 51 44 39 38 46 14 334 33 32 31 35 40 47 49 50 46 40 36 34 39 21 337 36 38 42 46 51 57 57 57 54 47 41 38 47 4 Greenland and Iceland, Inland: 361 29 31 30 36 42 54 58 54 47 39 31 29 40 15 Europe, Coastal and Insular: 400 10 5 1 8 22 34 38 37 30 22 14 9 19 10 401 6 2 −4 5 20 32 36 36 27 18 10 6 16 1 406 26 25 28 34 40 49 55 54 46 37 31 27 37 20 407 39 36 39 44 56 67 74 67 57 47 42 41 51 10 408 23 23 26 31 38 44 51 51 46 36 30 26 35 20 412 30 30 33 39 46 52 58 58 51 41 35 30 42 20 414 26 26 30 35 43 51 57 56 47 37 31 27 39 20 415 12 11 23 35 43 52 57 55 47 34 22 14 34 18 420 32 33 36 42 48 53 60 59 52 44 37 33 44 20 421 28 28 35 43 54 65 69 66 58 45 37 29 46 26 423 19 18 25 36 48 62 66 63 52 39 29 21 40 33 424 26 26 32 43 55 63 71 66 57 45 37 31 46 20 425 13 13 24 37 47 55 62 59 50 38 25 16 36 18 426 19 20 28 42 55 63 68 64 54 44 31 22 42 18 428 9 11 22 36 47 57 64 59 49 36 23 12 35 18 429 7 8 20 33 44 53 61 57 47 33 19 8 33 18
141 | Vol_VII-0147
Table XI . Mean daily maximum temperature (°F.) (cont.) ✓ Station Jan Feb Mar Apr May Jun Jul Aug Sep Oct Nov Dec Ann Yrs Rec Europe, Inland: 450 14 15 23 35 44 57 62 59 48 33 24 17 36 22 451 5 8 23 33 43 55 63 59 48 32 17 8 33 20 454 29 32 37 44 52 57 63 61 53 44 35 30 45 20 455 27 29 36 46 59 70 71 66 58 46 36 29 48 29 456 17 19 27 39 50 60 64 59 51 37 28 20 39 20 457 22 22 32 44 56 65 72 66 55 42 33 26 45 20 458 19 18 29 40 51 62 70 64 54 39 29 23 41 20 Asia, Coastal and Insular: 500 11 9 1 10 23 33 40 40 35 28 18 11 22 7-8 501 −4 −3 −12 3 21 35 43 41 36 20 3 −3 15 5-6 502 −8 −5 −14 1 19 35 45 42 35 18 1 −6 14 4-5 503 −8 −5 13 0 19 33 40 37 32 18 3 −6 13 7-8 505 19 14 11 20 29 39 49 49 41 33 37 20 29 17 506 15 9 7 18 27 37 49 48 42 33 27 18 28 24 507 12 8 4 16 28 39 48 48 39 31 24 15 26 17 508 4 1 −4 10 24 33 44 45 38 27 17 7 20 5 509 −3 −1 −5 10 25 41 55 51 41 25 9 −2 20 6-7 510 0 2 −4 9 24 36 45 45 38 24 10 1 19 19 511 −28 −30 −23 1 20 37 47 47 35 10 −11 −22 7 2 513 −42 −29 −10 3 25 47 54 47 35 10 −17 −25 8 4 514 −16 −17 −13 −1 21 36 43 41 34 19 −4 −12 11 6 515 −35 −32 −21 −2 24 43 55 45 36 10 −14 −28 7 8 517 −4 −7 −2 8 22 37 42 40 32 21 7 1 16 11
142 | Vol_VII-0148
Table XI . Mean daily maximum temperature (°F.) (cont.) ✓ Station Jan Feb Mar Apr May Jun Jul Aug Sep Oct Nov Dec Ann Yrs Rec Asia, Coastal and Insular (cont.): 518 12 7 6 19 28 39 51 50 43 32 25 14 27 26 519 8 4 2 17 28 40 51 49 42 30 20 8 25 22 522 −39 −31 −10 11 34 54 58 51 38 11 −10 −24 12 5 523 −13 −8 −4 4 25 39 46 42 33 23 6 −2 16 3 525 2 0 4 14 27 38 47 45 29 28 16 8 22 7 526 −10 −7 6 21 37 53 61 57 47 26 5 −5 24 10 527 −9 −5 1 10 31 44 55 52 41 25 5 −5 20 9 531 1 1 17 30 38 49 55 57 50 32 10 0 28 4 Asia, Inland: 551 .. −9 −19 5 31 47 59 46 41 18 0 .. .. 0-1 553 −5 0 −1 13 27 45 61 55 44 24 4 −5 22 18 554 −18 −17 −3 9 24 45 63 57 41 18 −1 −14 17 4 556 −58 −40 −10 19 43 61 66 58 44 12 −30 −51 10 15 558 −42 −29 −8 12 35 57 62 53 41 15 −16 −34 12 12 559 −39 −28 −7 19 42 62 67 56 44 16 −13 −33 15 8 560 −3 4 15 30 42 57 67 59 49 31 9 −1 30 9 562 −9 1 16 29 44 57 67 63 51 31 9 −5 29 18 563 −19 −6 10 21 38 53 66 61 46 24 −3 −17 23 13 566 −26 −10 12 33 50 67 75 66 51 28 0 −24 27 11 567 −37 −18 6 25 45 63 69 53 47 22 −11 −35 20 11 568 −45 −28 1 26 50 68 73 67 50 22 −15 −38 19 17 570 −39 −22 −5 31 47 66 71 65 51 24 −6 −40 21 9 572 −17 −10 −2 12 33 55 63 60 43 20 1 −13 20 14 573 −2 9 23 39 56 66 71 67 56 37 18 4 37 15
143 | Vol_VII-0149
Table XI . Mean daily maximum temperature (°F.) (cont.) ✓ Station Jan Feb Mar Apr May Jun Jul Aug Sep Oct Nov Dec Ann Yrs Rec Asia, Inland (cont.): 574 −5 6 23 38 52 66 73 69 55 35 15 −2 35 18 575 −14 0 22 38 53 69 74 69 53 33 11 −9 33 17 576 −20 −6 14 32 47 65 72 66 51 29 4 −15 28 18
144 | Vol_VII-0150
Table XII . Mean daily minimum temperature (°F.) ✓ Station Jan Feb Mar Apr May Jun Jul Aug Sep Oct Nov Dec Ann Yrs Rec Oceanic: 004 22 22 20 24 27 33 38 39 35 29 24 22 28 7 006 −23 −25 −25 −15 10 27 31 30 22 4 −10 −22 1 5-6 007 −13 −16 −21 −7 12 27 30 31 28 16 −3 −12 6 5-6 Alaska, Coastal and Insular: 100 −23 −24 −22 −8 14 29 34 33 27 12 −6 −18 4 25-28 101 −7 −13 −16 7 19 30 38 38 35 23 4 −5 19 1 102 −14 −14 −15 7 25 38 46 46 37 21 2 −9 14 8-11 103 −9 −9 −12 4 22 27 41 40 36 26 6 −2 19 2 104 −4 −2 1 12 28 38 44 44 36 24 10 1 20 34-35 105 −7 −3 1 17 26 35 43 43 39 30 21 6 21 2-6 106 5 9 13 27 36 44 49 47 39 29 16 6 27 23-25 Alaska, Inland: 150 −10 −11 −15 5 27 42 49 40 32 15 −6 −12 11 3-4 151 −30 −31 −24 −16 13 34 42 35 26 2 −16 −22 5 1-2 152 −21 −17 −12 5 28 43 45 41 31 16 −9 −17 11 6-8 153 −27 −26 −12 8 32 47 51 45 33 13 −12 −28 10 19-21 154 −1 0 3 18 31 43 46 45 38 24 11 0 21 16-18 155 −21 −13 −6 12 32 44 46 42 32 17 −6 −16 14 34-40 156 −21 −17 −6 20 35 46 48 44 34 20 −4 −15 15 11 157 −23 −14 −6 12 31 43 46 41 31 17 −4 −19 13 27-33 Canada, Coastal and Insular: 204 −30 −30 −23 −12 8 28 35 34 25 8 −11 −24 1 5 205 −33 −33 −30 −18 9 31 35 33 19 0 −12 −29 −2 3
145 | Vol_VII-0151
Table XII . Mean daily minimum temperature (°F.) (cont.) ✓ Jan Feb Mar Apr May Jun Jul Aug Sep Oct Nov Dec Ann Yrs Rec. Canada, Coastal and Insular (cont.) : 206 −21 −22 −18 −6 18 32 41 36 24 12 −10 −21 5 3 210 −25 −33 −25 −13 9 28 35 32 21 3 −15 −23 0 5 211 −27 −34 −26 −13 12 30 36 35 26 9 −12 −23 1 10 212 −25 −30 −18 −9 15 30 36 34 29 11 −4 −18 4 3-4 213 −32 −35 −29 −11 12 30 36 36 28 10 −11 −27 1 16 214 −21 −24 −20 −11 12 28 33 33 28 16 −4 −15 5 5 215 −25 −20 −18 −5 15 30 37 36 28 11 −10 −21 5 9 216 −26 −27 −23 −8 15 32 42 40 31 12 −13 −22 4 13 217 −31 −33 −31 −14 6 31 41 38 28 5 −17 −30 −1 13 221 −33 −31 −23 −6 15 32 40 41 33 17 −9 −24 4 18 222 −33 −28 −23 −9 11 28 38 39 27 11 −7 −24 3 8 223 −19 −21 −12 2 20 30 35 36 31 23 4 −11 10 14 224 −21 −19 −10 3 22 33 38 37 32 21 6 −10 11 22 225 −18 −25 −19 −3 18 32 38 37 30 19 7 −13 9 3 226 −23 −24 −15 −1 18 31 39 39 32 20 −6 −15 9 12 227 −7 −7 3 11 24 30 33 34 32 26 17 3 17 15 228 −27 −25 −16 4 22 34 43 43 35 20 −2 −19 9 30 Canada, Inland: 250 −27 −24 −19 −2 23 40 47 42 32 16 −10 −24 8 20 251 −30 −23 −18 −1 24 42 49 43 32 13 −13 −23 8 28 252 −28 −20 −8 16 34 43 46 42 32 19 −4 −20 13 41 253 1 4 12 24 34 43 45 43 38 29 7 −1 23 6 254 −33 −29 −22 0 27 42 47 41 31 14 −14 −29 6 31
146 | Vol_VII-0152
Table XII . Mean daily minimum temperature (°F.) (cont.) ✓ Station Jan Feb Mar Apr May Jun Jul Aug Sep Oct Nov Dec Ann Yrs Rec. Canada, Inland (cont.): 255 −14 9 2 22 34 44 47 43 36 26 0 −12 18 9 256 −27 −22 −14 7 29 42 47 43 33 18 −7 −22 11 30 257 −27 −22 −14 7 28 42 47 42 33 18 −7 −22 10 31 258 −27 −21 −11 14 33 45 50 46 36 21 −3 −20 14 42 259 −25 −21 −12 11 29 40 49 47 37 24 2 −16 14 45 260 −22 −23 −9 9 29 44 52 50 39 29 2 −17 15 … 261 −23 −16 −11 12 31 43 51 44 38 26 5 −15 15 24 262 −25 −20 −9 14 32 42 47 43 34 22 3 −17 14 26 263 −24 −19 −8 17 34 42 47 43 32 22 0 −17 14 30 Greenland and Iceland, Coastal and Insular: 302 −16 −21 −19 −10 16 30 36 33 21 8 −3 −17 5 3-4 304 −10 −12 −9 1 21 31 36 36 31 21 12 1 13 30 305 15 9 13 19 28 35 39 38 24 28 21 18 25 4-5 306 −3 −3 7 13 27 36 43 42 34 26 19 14 22 5 307 −33 −41 −32 −29 −1 24 29 26 12 −10 −19 −30 −9 5 308 −3 −5 −4 6 21 31 35 33 29 15 6 1 14 12 309 6 1 5 13 27 37 41 41 35 25 19 13 22 13 310 8 −2 −1 7 22 33 37 38 34 24 17 13 19 2-3 311 6 2 9 15 31 42 46 44 36 26 17 10 24 6 312 −3 −6 −5 8 26 40 41 38 30 17 6 −1 16 6-7 313 13 7 8 16 27 35 39 38 34 27 21 17 23 4-5 314 11 10 15 21 30 35 39 39 35 27 20 15 25 30 315 19 15 18 22 29 35 38 39 35 29 24 22 27 4-5
147 | Vol_VII-0153
Table XII . Mean daily minimum temperature (°F.) (cont.) ✓ Station Jan Feb Mar Apr May Jun Jul Aug Sep Oct Nov Dec Ann Yrs Rec Greenland and Iceland, Coastal and Insular (cont.): 316 8 10 12 15 22 33 36 34 34 17 16 14 21 1 317 14 14 17 20 30 36 39 38 34 26 21 18 26 10 318 14 13 17 25 34 39 42 41 36 29 22 16 27 30 319 19 19 21 26 33 38 39 40 35 28 22 19 29 1-2 320 21 22 22 29 34 36 37 39 37 33 27 24 30 10 321 22 21 23 26 31 36 38 38 36 31 26 24 29 4-5 331 27 29 30 34 39 44 48 46 41 35 31 29 36 14 334 23 22 21 25 31 37 40 41 37 32 27 24 30 21 336 25 25 26 31 38 43 47 46 41 32 29 28 34 10 337 26 29 31 35 39 43 46 46 43 36 32 29 36 4 340 32 33 29 35 40 47 49 49 44 38 36 33 39 4 Greenland and Iceland, Inland: 361 16 18 17 22 30 36 41 38 32 27 19 17 26 19 Europe, Coastal and Insular: 400 −6 −10 −14 −5 14 27 31 31 24 14 2 −5 9 10 401 −11 −13 −18 −9 11 26 30 29 19 7 −4 −9 5 1 406 21 20 23 27 33 41 46 46 40 32 26 22 31 20 407 3 3 6 13 26 32 41 39 32 22 14 8 23 10 408 18 17 20 25 32 39 45 45 41 31 26 21 30 20 412 24 24 25 30 38 44 51 50 43 35 30 25 35 20 414 22 20 22 27 35 42 47 46 40 31 27 23 32 20 415 4 1 8 21 31 40 46 44 37 27 14 10 23 18 420 27 28 29 34 40 45 51 51 45 37 32 28 37 20 421 13 12 17 26 35 45 51 49 42 33 24 16 30 26 423 4 2 7 19 32 44 50 47 39 28 17 6 25 33 424 17 15 22 31 41 49 57 54 47 36 30 22 35 20
148 | Vol_VII-0154
Table XII . Mean daily minimum temperature ( ° F.) (cont.) ✓ Station Jan Feb Mar Apr May Jun Jul Aug Sep Oct Nov Dec Ann Yrs Rec Europe, Coastal and Insular (cont.): 425 5 3 9 22 33 41 48 46 38 29 18 10 25 35 426 12 12 18 30 42 51 56 53 45 37 26 17 33 18 428 1 0 8 23 35 44 51 48 41 30 16 4 25 18 429 −1 −1 6 20 31 40 47 45 37 26 13 2 22 25 Europe, Inland: 450 −4 −4 1 13 28 40 45 42 33 21 8 −1 19 22 451 −6 −9 0 14 29 40 45 41 34 20 7 −3 18 20 454 23 24 26 33 40 46 52 50 43 35 29 25 36 20 455 12 12 17 27 37 48 51 49 42 32 23 15 30 29 456 0 −1 6 19 31 41 45 43 35 25 15 3 23 20 457 10 9 17 27 37 47 53 50 42 33 24 16 30 20 458 6 5 13 24 34 44 51 48 40 29 21 12 27 20 Asia, Coastal and Insular: 500 −3 −6 −12 −2 15 27 32 33 29 19 8 0 11 7-8 501 −20 −20 −27 −12 10 28 33 33 29 9 −10 −18 3 5-6 502 −25 −22 −28 −15 9 28 36 34 28 8 −13 −21 2 4-5 503 −23 −21 −26 −14 9 27 32 31 26 8 −9 −19 2 7-8 504 −28 −29 −26 −13 9 29 33 33 28 10 −14 −24 1 4 505 −2 −1 −1 6 19 30 29 40 34 23 10 2 17 30 506 1 −3 −8 4 19 30 37 39 36 27 18 6 17 24 507 −2 −5 −10 2 19 30 37 38 33 23 12 2 15 17 508 −14 −17 −21 −7 13 28 35 37 32 18 3 −9 8 5 509 −20 −19 −21 −7 14 31 40 40 32 14 −5 −19 7 6-7 510 −17 −14 −19 − 5 14 29 36 37 32 15 −4 −14 8 19
149 | Vol_VII-0155
Table XII . Mean daily minimum temperature (°F.) (cont.) ✓ Station Jan Feb Mar Apr May Jun Jul Aug Sep Oct Nov Dec Ann Yrs Rec Asia, Coastal and Insular, (cont.) 511 −33 −39 −36 −16 6 26 38 36 30 0 −21 −35 −4 2 512 −24 −26 −28 −9 14 32 41 41 32 7 −17 −26 3 7 513 −48 −37 −25 −14 12 36 42 37 26 0 −23 −32 −2 4 514 −29 −30 −26 −13 9 32 33 33 29 11 −14 −24 1 11 515 −40 −40 −31 −19 10 34 42 35 27 3 −18 −33 −2 14 517 −18 −20 −17 −6 11 29 32 32 26 13 −3 −11 6 11 518 −2 −8 −9 4 19 31 37 39 35 23 15 0 15 26 519 −9 −11 −13 2 13 31 37 39 35 20 6 −7 12 22 520 −21 −18 −8 5 22 38 49 46 37 20 −5 −17 12 18 521 −13 −13 −15 −1 16 30 41 43 36 24 0 −12 10 3 522 −43 −32 −26 −12 13 39 44 40 30 4 −16 −37 0 10 523 −27 −22 −17 −12 12 29 33 32 27 12 −7 −15 4 3 524 −20 −20 −18 −5 10 30 35 36 31 17 −1 −13 7 4 525 −12 −15 −9 2 17 31 37 36 32 20 5 −6 11 7 526 −19 −14 −7 6 26 38 44 43 32 15 −7 −18 12 5 527 −18 −15 −11 −5 18 34 46 43 32 18 1 −13 11 9 529 0 −5 −2 12 23 34 41 39 35 24 11 5 18 4 530 −6 −9 −7 6 19 32 38 37 31 21 8 −2 14 7 531 −16 −20 −1 10 24 38 45 45 36 16 −6 −15 13 4 Asia, Inland: 551 ... −17 −36 −12 15 39 48 37 31 2 −14 −26 … 0-1 552 −45 −40 −25 −6 17 38 46 42 29 6 −27 −39 0 12 553 −23 −18 −17 −5 14 35 46 42 34 14 −11 −21 7 18
150 | Vol_VII-0156
Table XII . Mean daily minimum temperature ( ° F.) (cont.) ✓ Station Jan Feb Mar Apr May Jun Jul Aug Sep Oct Nov Dec Ann Yrs Rec Asia, Inland (cont.) 554 −29 −26 −17 −4 15 35 48 44 33 10 −13 −24 6 12 556 −65 −56 −39 −12 22 43 47 39 27 −4 −40 −58 −8 14 558 −49 −40 −29 −11 18 43 48 41 30 5 −23 −40 −1 9 559 −45 −39 −25 −2 27 47 48 38 27 4 −26 −34 2 3 560 −17 −12 −3 14 29 44 53 48 37 22 0 −15 17 10 561 −14 −7 0 19 47 47 56 51 41 24 5 −10 23 9 562 −20 −12 0 14 31 46 54 51 40 24 0 −15 18 18 563 −28 −19 −7 2 23 41 52 47 36 16 −13 −26 10 13 565 −65 −60 −49 −28 3 27 34 27 14 −23 −53 −63 −20 13 566 −28 −27 −11 11 31 47 55 49 37 16 −12 −34 11 9 567 −45 −32 −18 2 28 46 52 46 34 10 −22 −43 5 11 568 −54 −40 −20 6 32 48 54 48 34 11 −24 −46 4 17 570 −51 −41 −22 8 32 46 50 43 33 14 −18 −48 4 7 571 −6 −20 −36 −15 .. .. .. .. .. 18 −23 −31 .. 0-1 572 −29 −34 −19 −8 19 40 47 41 33 9 −10 −22 6 12 573 −13 −3 7 23 40 50 55 51 41 26 8 −6 23 13 574 −17 −11 2 18 34 49 55 51 39 26 5 −13 20 18 575 −28 −22 −6 15 32 45 51 48 35 20 −3 −22 14 17 576 −33 −26 −12 7 28 41 48 43 34 14 −11 −26 9 18
151 | Vol_VII-0157
Table XIII. Mean number of days with minimum temperature ≤ 32° F. ✓ Station Jan Feb Mar Apr May Jun Jul Aug Sep Oct Nov Dec Ann Yrs Rec Oceanic: 003 31 28 31 30 31 30 25 19 29 31 30 31 346 1-2 004 28 29 30 27 26 13 * 1 9 22 26 29 238 .. 006 31 28 31 30 31 27 20 27 27 31 30 31 343 5-6 007 31 28 31 30 31 29 23 22 24 31 30 31 340 5-6 Alaska, Coastal and Insular: 100 31 28 31 30 30 23 13 16 27 31 30 31 321 22 101 31 28 31 30 30 21 1 1 9 29 30 31 272 1-2 102 31 28 31 30 25 6 * * 6 28 30 31 246 8-12 103 31 28 31 30 29 20 0 1 7 27 30 31 265 2 104 31 28 31 29 22 5 1 2 11 25 29 31 245 33 105 31 28 31 30 30 11 0 0 2 23 28 31 245 2-6 106 31 28 29 24 9 * 0 * 6 19 29 31 200 23 Alaska, Inland: 150 31 28 31 30 21 2 0 4 17 28 30 31 253 3-4 151 31 28 31 30 31 16 1 12 28 31 30 31 300 1-2 152 31 28 31 30 19 1 * 3 18 30 30 31 252 5-8 153 31 28 31 29 16 1 0 2 15 30 30 31 244 23 154 31 28 31 28 18 1 * * 7 25 27 31 227 17 155 31 28 31 29 15 1 1 4 14 29 30 31 244 31-36 156 31 28 31 28 13 1 0 1 14 28 28 30 233 5-6 157 31 28 31 29 18 3 1 6 16 28 30 31 252 5-6
* Less than 0.5 day.
152 | Vol_VII-0158
Table XIII. Mean number of days with minimum temperature ≤ 32° F. (cont.) ✓ Station Jan Feb Mar Apr May Jun Jul Aug Sep Oct Nov Dec Ann Yrs Rec Canada, Coastal and Insular: 222 30 28 31 30 31 24 1 2 23 31 30 31 292 2 224 30 28 31 30 29 15 1 0 18 31 30 31 273 1 Canada, Inland: 256 30 28 31 28 10 0 0 0 9 26 30 31 224 1-2 Greenland, Iceland, Coastal and Insular: 306 31 28 30 30 22 5 0 0 11 27 30 31 245 5 314 31 28 30 28 21 8 1 1 8 26 29 31 240 31 317 30 28 30 28 20 9 3 4 14 26 28 29 249 30 318 30 27 29 24 11 2 0 * 6 21 27 30 206 28 331 25 20 17 15 5 1 0 * 3 11 12 17 126 3-4 Europe, Coastal and Insular: 400 31 28 31 30 31 28 22 23 29 31 30 31 345 10 407 30 27 30 25 11 1 0 0 2 19 28 30 203 10 415 31 28 30 25 18 4 0 * 5 21 27 31 220 13 425 31 28 31 25 13 2 * 1 5 18 27 30 212 18 426 30 28 29 18 4 0 0 0 1 8 22 28 169 18 428 31 28 31 24 11 2 0 0 2 16 28 31 203 18 429 31 28 31 24 18 5 * 1 7 21 30 31 225 13 Europe, Inland: 451 31 28 31 28 19 3 * 3 11 25 29 31 239 55 453 31 28 31 27 17 3 * 3 13 22 27 30 232 10 Asia, Coastal and Insular: 500 31 28 31 30 31 29 18 11 22 31 30 31 323 7-8 501 31 28 31 30 31 23 13 15 21 31 30 31 315 5-6 503 31 28 31 30 31 28 20 25 27 31 30 31 343 7-8
* Less than 0.5 day.
153 | Vol_VII-0159
Table XIII. Mean number of days with minimum temperature ≤ 32° F. (cont.) ✓ Station Jan Feb Mar Apr May Jun Jul Aug Sep Oct Nov Dec Ann Yrs Rec Asia, Coastal and Insular (cont.): 507 31 28 31 30 30 19 2 1 13 30 30 31 275 17 508 31 28 31 30 31 27 9 2 15 31 30 31 295 6 509 31 28 31 30 31 17 2 1 15 30 30 31 276 6-7 510 31 28 31 30 30 24 6 6 15 31 30 31 292 19 511 31 28 31 30 31 23 2 8 18 31 30 31 294 5 512 31 28 31 30 29 17 5 1 10 31 30 31 274 4 513 31 28 31 29 25 12 1 6 22 31 30 31 279 6 514 31 28 31 30 31 25 15 13 23 31 30 31 319 8 515 31 28 31 30 31 13 1 9 24 31 30 31 291 7 518 31 28 31 30 31 20 5 3 8 24 30 31 271 26 519 31 28 31 30 30 20 5 2 9 27 30 31 275 22 521 31 28 31 30 29 23 5 2 12 28 30 31 280 3 522 31 28 31 30 30 3 0 2 20 31 30 31 267 4 523 31 28 31 30 30 21 11 14 24 31 30 31 312 3 525 31 28 31 30 30 19 1 2 15 29 30 31 277 7 526 31 28 30 28 23 3 0 1 14 26 30 31 245 12 527 31 28 31 30 30 10 0 0 13 29 30 31 263 12 531 31 28 31 28 26 4 * 1 8 29 30 31 247 4 Asia, Inland: 551 31 28 31 30 29 0 0 0 12 31 30 31 253 1 552 31 28 31 30 29 7 0 2 20 31 30 31 270 14 553 31 28 31 30 29 10 * 2 9 30 30 31 261 18
* Less than 0.5 day.
154 | Vol_VII-0160
Table XIII. Mean number of days with minimum temperature ≤ 32° F. (cont.) ✓ Station Jan Feb Mar Apr May Jun Jul Aug Sep Oct Nov Dec Ann Yrs Rec Asia, Inland (cont.): 554 31 28 31 30 29 8 * 1 12 29 30 31 260 17 556 31 28 31 25 7 * 0 0 3 27 30 31 214 34 558 31 28 31 30 25 1 0 2 20 31 30 31 260 9 559 31 28 31 30 16 1 0 4 20 30 30 31 252 3 560 31 28 31 27 18 2 0 0 8 27 30 31 233 10 561 31 28 31 26 13 * 0 * 4 24 30 31 219 9 562 31 28 31 28 15 1 0 * 5 21 30 31 221 11 563 31 28 31 30 23 3 0 1 9 29 30 31 245 9 565 31 28 30 17 2 0 0 0 1 19 30 31 189 .. 566 31 28 31 29 13 * 0 1 1 28 30 31 223 23 567 31 28 31 30 21 1 * 1 13 30 30 31 247 12 568 31 28 31 31 30 15 1 0 1 12 30 30 238 33 570 31 28 31 29 16 0 0 3 14 30 30 31 243 7 571 31 28 31 30 .. .. .. .. .. 29 30 31 .. 0-1 572 31 28 31 30 28 3 0 3 18 30 30 31 263 14 573 31 28 31 25 8 0 0 0 4 23 29 31 211 9 574 31 28 31 26 13 * 0 0 5 23 30 31 219 11 575 31 28 31 28 15 1 0 * 10 28 30 31 233 18 576 31 28 31 30 21 2 * 2 14 30 30 31 250 13
* Less than 0.5 day.
155 | Vol_VII-0161
Temperatures at moderate elevations in the Arctic differ
markedly from those recorded at lowland locations, primarily because
of the existence of the surface temperature inversion described in
previous sections. Temperatures at moderate elevations tend to
average considerably higher than those at lowland locations except
at inland points during summer when the surface inversion is non–
existent. At the highest Arctic elevations, however, temperatures
average lower than at most lowland locations, the differences being
most pronounced during the summer months. For example, over the
northern portion of the Greenland Ice Cap above 7,000 feet, July
temperatures may average between zero and 10° F. with extreme minima
as low as −20°. In winter, temperatures below −70° are probably
common. The lowest Greenland temperature on record, −84.6° F., was
obtained by the Wegener Expedition [ 54 ] at the Eismitte station
(70°54′ N.; 40°42′ W.; elevation 9,842 feet).
156 | Vol_VII-0162
Annual Variation of Temperature . - An examination of the annual
temperature curves for various locations reveals the existence of
three well-defined types, i.e., 1) maritime, 2) coastal, and 3)
continental.(1) Maritime . - The very small temperature variation during
June, July, and August produces a flat curve in the graph of the
monthly mean temperatures (see Fig. Table X ). There is a similar tendency
toward a flat curve during the winter months without pronounced
monthly minima in the mean temperature. There is a definite tendency,
however, for the seasonal minima to occur in late winter or early
spring. (Over the Polar Sea the average winter temperature is of
the order of −30° F.)(2) Coastal . - The coastal climate closely resembles the maritime,
the year consisting primarily of a long, cold winter and a short,
cool summer. There is a tendency toward a delayed seasonal maximum in
July or August. The mean summer temperature, while higher than over
the Arctic Ocean, remains below 50° F. The coldest month of the year
on the average is February, but in individual years the seasonal minima
may be delayed until March.
157 | Vol_VII-0163
(3) Arctic Continental . - The interior arctic climate is
characterized by very low winter temperatures with a pronounced
winter minimum in January or February. Summer temperatures are
relatively very high and show pronounced monthly maxima in July with
a tendency toward higher temperatures in June than in August. The
annual ranges of mean temperature for individual localities may
exceed 100°. (The absolute range in temperature at Verkhoyansk is
188°.)From the preceding discussion it is evident that the annual
range in temperature (difference in temperature between warmest and
coldest month) is directly related to topography and the degree of
maritime influence. Stations at high elevation exhibit a smaller
annual range in temperature than do low-level stations in the vicinity.
Maritime locations similarly show a smaller range in temperature than
do continental locations at the same latitude. In fact, as shown by
Fig. 46 , there is a close relation between the magnitude of the annual
range in mean temperature and distance from the seacoast.
158 | Vol_VII-0164
Non-Periodic Changes in Temperature . - The day-to-day variations in
temperature depend primarily upon the nearness of the region to the
major storm tracks and the temperature contracts between air masses
associated with passing frontal systems. Dynamic heating effects in
the lee of mountain ranges and the local effects of differences in
surface cover (water or ice versus land) are secondary causes of such
non-periodic variations. In general the magnitude of the interdiurnal
temperature variations throughout the Arctic is at a maximum in winter
and at a minimum in summer. The variations are at a minimum over the
open Arctic Ocean, where air-mass contrasts are lacking and dynamic
heating effects are exceptional. The variations are particularly
large in peripheral continental areas and in Alaska and coastal
Greenland, where considerable dynamic heating (chinook or foehn
effects) can occur in leeward locations during periods of strong
circulation.
159 | Vol_VII-0165
Diurnal Variation of Temperature . - The daily range in temperature
throughout the Arctic reflects the general characteristics of the
climatic picture. District insolational differences between day and
night, a dry-land cover, clear skies, low humidity, and an absence of
wind coupled with the presence of a shallow temperature inversion, are
all conducive to a large diurnal variation of temperature. Conversely,
long periods of daylight or darkness, snow, ice or water surface,
cloudy skies, and high surface winds coupled with a deep temperature fig. 47 here
inversion (or no inversion), are all conducive to a small diurnal range
in temperature. In the period of winter darkness there are almost no
daily fluctuations in temperature on land; over the Arctic Ocean in
summer fluctuations are negligible since the temperature remains close
to freezing. In most maritime and coastal Arctic regions the
combination of circumstances, is such as to produce the maximum variation
in April. At this time there exists only a thin layer of cold air
below the inversion level, and it is only this layer that shares in
the daily temperature fluctuations. At the same time, the increased
insolation has begun to exert its diurnal effect. At inland locations
160 | Vol_VII-0166
farther south in the Arctic there is a tendency toward a secondary
maximum of variation in summer, after the land is free from snow and
the surface inversion has completely disappeared.
161 | Vol_VII-0167
Geographic Distribution of Temperature . - It is beyond the scope of
the present chapter to discuss in detail the regional and geographical
differences in temperature over the Arctic. Much of the geographical
distribution can be inferred from what has already been discussed;
additional generalized information will be found in the figures,
while more detailed local information is presented in the tables.The general features of the Arctic temperature distribution are,
of course, determined by the general circulation of the atmosphere
in its relation to latitude, season, and the distribution of land
and sea. Of more specialized interest are the details of the circu–
lation in relation to major ocean currents and to important orographic
features.
162 | Vol_VII-0168
It is clear from the isothermal chart for January (see Figure 44 )
that the deviations of the trend of isotherms from parallelism with
the latitude circles is closely related to the location of the
principal land and water masses. It can be noted that the low
temperature isotherms bend Equatorward over the continental land masses
and Greenland and bend Poleward over the Bering and Norweigian Seas
and Davis Strait where there is significant Poleward transport of
warm water. The effects of the Gulf Stream system can be noted in
the relatively high temperatures over European Arctic lands. The
effects of the transport of warm water through Bering Straits
similarly can be noted by comparing the higher temperatures along the
north coasts of Alaska and Siberia near the Straits with the relatively
low temperatures that exist at the same time farther westward along
the coasts of the East Siberian Sea and eastward over the Beaufort Sea
region.
163 | Vol_VII-0169
A good example of the influence of a major topographic feature
on the temperature distribution is given by the steep temperature
gradient that can be noted along the southern Alaska coast on the
January isothermal chart. Here the mountain ranges close to the
coast act effectively as barriers between the stable Arctic air masses
to the north and east and the relatively warm maritime air over the
Gulf of Alaska. Those Arctic air masses which do arrive at the coast
after moving southward over the barrier have had much of their Arctic
“sting” removed through dynamical heating resulting from descent to
sea level pressures.In contrast to the winter situation, the isotherms on the summer
chart (see Fig. 45 ) are arranged more nearly parallel to the latitude
circles and the temperature gradients are less steep. If the low
temperatures found at higher altitudes on the Greenland Ice Cap and
elsewhere are disregarded, and only sea level temperature are considered,
it may be seen that in this season the cold pole of the Northern
Hemisphere actually exists over the Polar Sea.
164 | Vol_VII-0170
PRECIPITATION, SNOWFALL, THUNDERSTORMS
Before entering into a detailed discussion of precipitation
characteristics of Arctic regions, it should be pointed out that observa–
tions regarding precipitation are, perhaps, the most unsatisfactory of
all Arctic meteorological records. During snowstorms it is often difficult
to determine whether snow is falling or is being whirled up from the surface.
The “dry” Arctic snow usually begins to drift at wind speeds of from 10 to
12 mph, and with high wind speeds the air is as thick with snow as would be
expected during a heavy snowstorm in extra-Arctic regions. Under these
circumstances, either driven snow will be blown into the recording gauge
or newly fallen snow will be blown out of the gauge. Over the Greenland
Ice Cap, observational difficulties are even more extreme because the
heavier precipitation is almost i nvariably associated with strong winds.
Nor can the accretion of snow cover be used as a measure of the actual
amounts of precipitation because of excessive drifting of surface snow
and concurrent ablation through evaporation or melting. The observational
difficulties known to exist in the Arctic caused the earlier permanent
meteorological stations to give up all attempts at direct measurement of
precipitation [ 42 ] .
165 | Vol_VII-0171
Another complication arises in attempting to record the number of days
with measureable precipitation. Because of the exceedingly small moisture
concentration possible at very low temperatures (see Table II ), the falling
snow during cold weather is very “fine” and there are many occasions when
precipitation is so slight as to defy measurement. The records for one
April at Goose Fjord, Ellesmere Island, for example, indicated that, while
precipitation fell on 11 days during the month, the precipitation amounts
for the 11 days totaled only 0.2 mm (less than 0.01 inch). At North
American Arctic stations a day with precipitation is considered as a
24-hour period during which 0.01 inch or more of rain or snow (melted) is
collected. Elsewhere a value of 0.1 mm is usually considered the limiting
amount, although some stations have recorded all days when precipitation
occurred, regardless of amount. These limitations of the data should be
kept in mind when attempting to make regional comparisons.
166 | Vol_VII-0172
Precipitation over most of the Arctic is very light and the annual
amounts are so small that the region would be described as desert or
semi-desert were it located in southerly latitudes. Available data
indicate that over much of the Polar Basin the annual precipitation
amounts average less than 10 inches, while over the Siberian-American
portion of the Arctic Ocean and the whole northern part of the Canadian
Archipelago, the amounts are generally of the order of 4 inches or less
[ 42 ] . The greatest portion of the annual precipitation falls in the
summer and as rain; snow, however, appears in every month, and sleet,
occasionally. Farther southward, near the regions of most frequent
frontal activity around the peripheral portions of the Arctic, the annual
precipitation amounts are more respectable. Some points in Greenland and
the European Arctic, for example, present an annual precipitation in excess
of 40 inches.
167 | Vol_VII-0173
Form of Precipitation . - Snow is the most frequent form of precipitation
but, as mentioned previously, it does not always account for the major
part of the measured quantity of precipitation. Over much of the Polar
Basin snow may be expected during all months of the year, and in the far
north the number of days with snow may exceed the number of days with rain
even during June. During July and August rain is normally the most
frequent form of precipitation in these regions, but by September snow
again predominates. On the other hand, many high latitude stations have
recorded rain during winter. During January 1937, for example, Domashnii
Ostrov (at approximately 80° N.) recorded 4 days with liquid precipitation
[ 45 ] . Strictly speaking, the precipitation in nearly all of these
instances is more properly described as drizzle than as rain. The situa–
tions occur with temperatures which are unseasonably high but not always
above freezing. On February 10, 1939, for example, drizzle was observed
at Yugorsky Shar (on the Kara Sea) although the maximum temperature for
the date was −4° F. [ 45 ] .
168 | Vol_VII-0174
Along the immediate coasts in the more southerly latitudes and in
some insular locations, rain is by far most frequent form of
precipitation, and even in January and February sleet or rain is common.Days with precipitation occurring simultaneously in the forms of
rain and snow are comparatively rare over the true Arctic. Such days,
when they do occur, are characterized by unstable weather conditions and
are observed primarily in the transitional seasons of spring and autumn.
However, in the far north such occurrences are most frequent in summer,
while in the more southerly portions of the Arctic they are most frequent
in winter.Sleet, which is precipitation in the form of small grains of ice and
which occurs when rain falls through a significant layer of air below 32° F.,
is of frequent occurrence along portions of the coasts of the Arctic Ocean.
It occurs most frequently during winter although it may be observed during
any month except July and August. The phenomenon appears to be particularly
prevalent in the coastal Kara Sea area. Ostrov Nedeneniia, for example,
records an average of 104 days a year with sleet, Gyao-Youro, 74 days, and
Russkii Ostrov and Mys Chelyuskin, each 66 days [ 45 ] .
169 | Vol_VII-0175
Rime, a deposit of granular ice which is caused by the impingement
and freezing (without shattering) of sub-cooled for droplets on solid
surfaces and objects exposed to fog-laden winds, is observed over most
northern Arctic coastal regions throughout the year. In some locations
the phenomenon may occur on as many as 60 days per year (as at Tikaya
Bukhta) but averages of 15 to 20 days are probably more typical. Upon
occasion the rough deposit of ice may accumulate to rather impressive
amounts; Wiese [ 56 ] recorded 3 cm (1.2 inches) of accumulated rime
during a 24-hour period in March at a point along the coast of Novoya
Zemlya.
170 | Vol_VII-0176
Hoarfrost is another form of precipitation of importance in the
Arctic, particularly in region where the total precipitation is low.
It is caused through direct condensation of atmospheric water vapor on
solid objects which are below freezing or on snow or ice surfaces. It
differs from rime in having a crystalline rather than a granular structure.
It also has a considerably lesser rate of accumulation. According to
measurements on the Maud Expedition, hoarfrost accounted for 15 percent
of the total precipitation collected over the Polar Sea. In general, the
amount of hoarfrost increases with increasing wind speed providing the
relative humidity of the air (with respect to ice) is greater than 100
percent. Over the Arctic pack-ice, however, the probability that hoarfrost
will occur decreases with increasing wind speed in agreement with the fact
that the humidity over the ice tends to decrease at higher wind velocities
[ 43 ] . The probability of hoarfrost increased regularly with decreasing
temperature but the rate of accretion also decreases because of lessened
water vapor, and at very low temperatures the amount become too small to
measure.
171 | Vol_VII-0177
Conditions are particularly favorable for hoarfrost formation over
the Greenland Ice Cap. Since the strong winds over the inland ice bring
large volumes of supersaturated air into surface contact, all conditions
are favorable for an increase in the deposit of crystals on the ice.
However, calculations by Sverdrup indicate that the total annual amounts
do not exceed 1.25 inches of water a year - a finding that does not permit
the conclusion that frost formation on the interior Ice Cap furnishes the
principal part of the ice accretion.Still another form of precipitation fairly common in the Arctic is
one which is variously referred to as glaze, glaze ice, freezing rain or
simply as “ice storm”. It occurs when rain (or drizzle) falls on objects
or surfaces which are below freezing. The raindrops shatter on impact and
immediately freeze, forming a layer of clear ice on all objects exposed to
the rain. Glaze differs from rime and hoarfrost in presenting a clear,
glassy appearance instead of a rough and opaque granular or crystalline
structure. It becomes a phenomenon of considerable practical concern when
the deposits on telephone lines, antenna e , poles, or other structural objects
are heavy enough to cause structural failure.
172 | Vol_VII-0178
Glaze is formed most frequently with surface air temperatures
between the limits of about 23° and 32° F. Under such conditions
temperatures a short distance over the surface are frequently above
freezing (see pages ) , a requisite for rainfall formation. At air
temperatures much above 32° F. there is little opportunity for surface
freezing; at temperatures much below 20° the precipitation is almost
invariably snow although there are exceptions. (See page .)
Glaze occurs most frequently during spring and autumn except in the far
northern portions of the Arctic where summer is the season of maximum
frequency. At most coastal stations on the Polar Sea the number of days
with glaze is usually less than 10 but in some years a few localities
may record as many as 45 such days [ 45 ] .
173 | Vol_VII-0179
From the standpoint of aviation activities in the Arctic, the
formation of rime, hoarfrost, and glaze is of considerable practical
concern. Any amount of frost or glassy ice on wings or stabilizers
of aircraft, however small it may be, should be removed before take-off
is attempted. A take-off into a fog of sub-cooled water droplets
(rime-forming condition) or into a rain at sub-zero temperatures (glaze
situation) can be particularly dangerous. Several cases of severe
prop-icing have been reported when running-up the engines in sub-cooled
fog, and severe wing icing has occurred not only during take-offs and
landings but even during taxiing for take-offs [ 33 ] . The rapidity with
which glaze ice or rime can accumulate on aircraft should never by
underestimated by those flying under Arctic conditions.
174 | Vol_VII-0180
Annual Variation of Precipitation . - Data from the Arctic Ocean indicate
that the probability of precipitation has a double annual period with
maxim in spring and autumn, a principal minimum in winter and a secondary
minimum in summer. This march of precipitation probability corresponds
to the annual variation of cloudiness at the coast but not to the varia–
tion of cloudiness over the pack-ice [ 43 ] . This lack of association table XIV and XV here
merely reflects the fact that the stratus clouds characteristic of the
pack-ice are largely the result of local processes. They are in no way
related to the circulations forming a part of cyclonic systems which affect
the Arctic. Conversely, it must be assumed that coastal cloudiness is
essentially frontal phenomenon.Sverdrup (loc. cit.) found that May has the greatest number of days
with precipitation and the midwinter months the smallest. The contrast
between summer winter precipitation frequencies appears to be greater
over the Polar Sea than in coastal areas.
175 | Vol_VII-0181
Table XIV . Mean number of days with precipitation ✓ Station Amt Jan Feb Mar Apr May Jun Jul Aug Sep Oct Nov Dec Ann Yrs Rec Oceanic: 002 c 11 11 13 13 20 20 21 19 22 14 9 9 180 2 003 c 2 8 6 6 19 17 14 17 16 13 6 6 130 2 004 c 19 19 15 15 11 9 11 9 15 15 17 18 174 … 005 c 14 14 14 10 12 7 7 8 14 13 14 13 139 … 006 e 13 8 7 7 6 8 11 14 12 10 9 9 114 24 007 e 18 14 13 11 7 11 13 16 20 17 13 16 169 21 Alaska, Coastal and Insular: 100 c 3 3 2 3 2 3 8 8 8 7 4 3 54 22-25 101 c 6 5 5 9 6 4 9 9 14 17 4 6 94 1-2 102 c 5 2 3 2 1 2 7 7 5 4 3 4 45 6-10 103 c 3 13 6 5 15 8 12 16 16 13 2 3 112 2-3 104 c 9 7 8 8 8 9 14 17 14 10 8 9 121 23-36 105 c 11 11 8 16 7 6 12 10 13 13 17 18 156 2-5 106 c 7 6 5 4 5 6 10 15 14 12 7 6 97 23-25 Alaska, Inland: 150 c 14 12 18 11 14 15 14 13 18 20 12 17 178 2-5 151 c .. 8 21 18 15 22 19 25 23 26 21 28 … 0-2 152 c 5 5 4 3 4 7 10 7 8 6 5 4 68 5-8 153 c 5 4 3 2 3 6 7 9 6 5 5 3 58 20-27 154 c 9 6 8 7 8 11 16 20 18 10 8 9 130 17-19 155 c 8 7 7 4 7 10 14 15 13 9 8 7 109 30-31 156 c 10 6 6 4 9 10 13 15 10 11 10 7 111 11
c - 0.01 inch or more. e - Not defined.
176 | Vol_VII-0182
Table XIV . Mean number of days with precipitation (cont.) ✓ Station Amt Jan Feb Mar Apr May Jun Jul Aug Sep Oct Nov Dec Ann Yrs Rec Alaska, Inland (cont.): 157 c 7 5 5 5 8 11 13 13 11 8 7 7 100 33-36 Canada, Coastal and Insular: 204 c 5 3 5 4 6 7 6 8 7 9 8 4 72 4-5 206 c 6 6 7 6 8 5 8 14 10 9 6 2 87 5 208 a 4 8 19 9 19 9 6 .. 17 24 6 2 … 1 210 c 6 3 4 4 7 6 6 14 10 8 4 5 77 5 211 c 6 3 6 6 6 6 7 10 8 8 6 5 77 7 213 c 3 1 2 2 2 4 6 6 4 5 3 3 41 4-5 214 c 4 1 2 1 5 4 5 5 8 15 6 3 59 2-3 216 c 8 6 7 6 7 6 10 15 10 10 10 8 103 10 217 c 3 3 6 4 5 6 10 13 10 6 5 3 74 6 221 c 6 5 6 9 8 7 12 11 12 9 9 8 102 10 223 c 6 6 6 11 12 10 10 11 11 13 15 11 122 10 224 c 5 5 6 6 8 9 9 8 8 10 9 7 91 4-7 226 c 6 3 4 7 5 7 9 9 7 8 8 7 81 6-8 227 c 10 8 11 9 12 11 12 11 14 14 15 14 141 10 228 c 5 6 6 6 7 9 10 12 11 12 9 8 101 10 Canada, Inland: 250 c 4 5 4 4 4 5 9 10 10 8 8 5 76 10 252 c 8 6 8 5 9 11 13 14 11 11 11 10 117 10 253 c 7 7 8 3 5 9 13 11 10 11 12 8 104 5 254 c 7 7 8 6 8 6 9 14 10 12 12 7 106 10 255 c 9 7 5 7 9 12 12 14 12 12 15 13 127 8
a - Trace or more. c - 0.01 inch or more.
177 | Vol_VII-0183
Table XIV . Mean number of days with precipitation (cont.) ✓ Station Amt Jan Feb Mar Apr May Jun Jul Aug Sep Oct Nov Dec Ann Yrs Rec Canada, Inland (cont.): 257 c 6 7 7 6 7 8 10 12 8 8 8 6 93 10 258 c 6 5 8 5 7 7 10 9 6 7 8 8 86 10 259 c 8 8 9 5 8 7 9 9 9 10 12 9 103 10 260 c 8 8 8 5 6 6 11 7 9 10 8 9 99 … 262 e 11 8 9 5 7 6 11 7 9 11 8 11 103 … Greenland and Iceland, Coastal and Insular 302 a 17 10 11 14 13 13 16 12 15 17 17 15 170 3 303 b 18 10 11 6 9 6 3 6 6 8 12 14 107 … 304 b 4 4 6 5 7 6 7 8 10 11 10 6 84 50 305 e 13 14 15 12 14 6 10 10 18 18 15 17 162 3 307 d 7 4 5 3 4 3 4 5 5 4 6 6 56 5 308 b 9 8 7 4 .. 4 5 1 7 6 5 6 … 9 309 b 8 8 7 8 5 5 7 8 9 11 12 11 100 13 310 c 9 12 16 9 8 5 10 7 20 11 16 13 139 2 312 c 4 4 3 2 3 5 11 8 7 6 6 5 55 7 313 c 14 14 14 12 14 7 11 5 17 12 12 12 146 5 314 c 8 8 7 6 7 8 8 10 11 11 9 6 97 45 317 b 14 12 12 10 10 9 8 9 10 13 11 12 131 29 318 b 12 10 12 10 10 10 9 10 13 12 12 11 131 45 321 c 19 17 18 17 13 14 14 13 12 16 14 19 187 2-3 330 e 21 20 19 18 16 17 14 20 22 20 19 20 226 11
a - Trace or more b - 0.004 inch or more. c - 0.01 inch or more. d - 0.04 inch or more. e - Not defined.
178 | Vol_VII-0184
Table XIV . Mean number of days with precipitation (cont.) ✓ Station Amt Jan Feb Mar Apr May Jun Jul Aug Sep Oct Nov Dec Ann Yrs Rec Greenland and Iceland, Coastal and Insular (cont.): 331 b 21 19 18 16 14 14 14 19 19 17 19 21 211 16 333 e 21 17 18 15 17 16 15 21 21 19 20 20 220 11 334 a 10 10 10 9 8 6 8 10 11 12 12 11 117 … 335 e 14 11 12 12 9 10 13 14 13 17 14 14 153 15 336 e 11 12 11 9 5 7 10 12 12 13 11 12 125 11 337 e 18 16 17 16 17 15 17 19 23 19 18 21 216 11 338 b 13 13 13 10 10 11 8 11 14 12 14 14 142 15 339 e 14 10 12 11 8 9 10 12 13 13 10 11 133 7 340 c 19 16 16 15 13 11 11 16 16 18 16 18 186 14 341 e 19 13 18 13 13 10 15 13 16 14 18 21 183 8 Greenland and Iceland, Inland: 350 e 7 4 .. .. .. .. .. .. .. 11 13 10 … … 351 e 19 13 18 21 19 15 20 17 15 18 15 13 203 1 360 e 17 15 15 15 17 14 15 21 18 17 14 16 194 7 361 e 14 10 11 10 5 7 12 13 10 14 10 10 126 11 Europe, Coastal and Insular: 400 e 13 14 11 10 10 9 12 15 13 16 13 12 147 1 401 e 9 7 8 9 12 12 13 18 18 15 13 9 144 2 403 c 12 12 12 10 7 6 6 6 9 11 11 12 114 … 406 b 14 16 15 13 13 12 12 10 16 17 16 13 167 12 408 b 14 16 12 11 10 9 10 11 15 15 16 15 155 …
a - Trace or more b - 0.004 inch or more. c - 0.01 inch or more. e - Not defined.
179 | Vol_VII-0185
Table XIV . Mean number of days with precipitation (cont.) ✓ Station Amt Jan Feb Mar Apr May Jun Jul Aug Sep Oct Nov Dec Ann Yrs Rec Europe, Coastal and Insular (cont.): 411 d 20 19 15 13 14 12 12 13 19 20 20 16 194 50 412 b 12 11 13 11 11 11 12 13 17 15 16 13 155 20 414 b 16 15 13 13 11 12 11 13 17 16 17 14 170 20 415 c 13 13 12 13 16 15 15 16 18 17 17 14 179 25 417 e 25 21 19 18 18 14 11 16 22 22 22 23 231 … 420 b 15 11 13 11 12 11 12 13 15 15 15 14 157 20 421 b 12 11 12 9 11 10 12 13 11 14 12 15 142 36 422 b 15 13 12 10 11 10 13 17 17 18 16 15 166 30 423 b 15 12 12 9 9 9 12 12 12 14 14 14 144 27 424 b 19 16 14 13 12 13 12 16 15 17 18 19 184 36 425 c 14 13 11 12 13 12 16 16 16 16 16 17 170 18 426 a 22 19 14 12 14 13 16 19 16 16 19 22 203 18 427 a 13 13 11 11 11 10 11 13 16 16 15 15 155 25 428 a 16 15 13 11 12 12 12 14 15 17 17 17 171 25 429 b 8 7 5 7 10 9 11 12 14 11 10 7 112 17 Europe, Inland: 450 b 13 11 10 8 10 10 16 16 13 12 13 12 144 32 451 d 5 5 6 5 6 8 9 9 7 8 8 6 82 … 452 c 5 5 5 7 8 9 10 12 8 9 7 6 91 … 453 b 19 16 15 14 13 15 15 17 17 18 18 18 195 30
a - Trace or more b - 0.004 inch or more. c - 0.01 inch or more. d - 0.04 inch or more. e - Not defined.
180 | Vol_VII-0186
Table XIV . Mean number of days with precipitation (cont.) ✓ Station Amt Jan Feb Mar Apr May Jun Jul Aug Sep Oct Nov Dec Ann Yrs Rec Europe, Inland (cont.): 454 c 21 17 17 17 20 19 21 23 22 20 19 18 234 31 455 b 12 10 10 9 12 12 14 15 12 13 12 13 144 38 456 c 14 12 13 10 10 11 15 18 13 15 14 15 160 26 457 b 19 16 15 14 14 16 15 18 16 19 19 19 200 36 458 b 19 17 15 14 14 15 15 17 17 19 19 20 201 35 Asia, Coastal and Insular: 500 e 8 7 9 10 11 12 13 17 18 14 10 9 138 3 501 e 13 9 7 9 11 13 14 18 19 16 10 12 151 18 502 e 14 14 9 13 16 16 19 24 23 17 11 11 186 19 503 e 8 9 6 4 6 10 12 14 13 13 12 10 116 22 505 e 17 15 13 12 13 12 11 15 18 17 16 14 173 14 506 c 14 12 11 11 9 9 12 13 15 17 14 14 151 18 507 e 12 10 12 9 8 8 9 11 16 16 13 14 134 6 508 e 19 18 15 13 11 10 11 19 21 22 18 16 192 13 509 e 21 16 15 13 14 15 12 20 22 23 18 16 204 15 510 e 13 12 12 10 9 13 12 20 20 18 15 14 169 17 511 c 4 6 1 2 10 8 2 8 12 4 11 7 75 2 512 c 9 9 7 5 4 10 11 12 14 12 9 6 108 3 513 c 8 12 9 9 8 12 14 14 17 13 12 12 141 7 514 f 0 0 * 0 * 2 2 2 1 * 0 0 8 11
b - 0.004 inch or more. c - 0.01 inch or more. e - Not defined. f - 0.08 inch or more. * - Less than 0.5 day.
181 | Vol_VII-0187
Table XIV . Mean number of days with precipitation (cont.) ✓ Station Amt Jan Feb Mar Apr May Jun Jul Aug Sep Oct Nov Dec Ann Yrs Rec Asia, Coastal and Insular (cont.): 515 c 4 6 5 4 11 13 12 13 13 9 9 6 107 9 517 b 8 7 7 6 8 8 9 12 10 10 7 7 99 11 518 e 14 11 13 11 12 12 11 16 21 19 17 17 175 9 519 e 13 11 9 11 13 12 11 17 21 19 16 14 167 12 520 d 8 8 7 5 8 8 10 11 11 10 10 10 107 … 521 e 15 11 12 12 15 14 10 16 18 18 15 14 171 25 522 b 8 10 8 8 6 6 13 14 14 14 12 9 120 5-8 523 c 6 10 11 9 8 6 10 14 18 12 9 7 120 3 525 c 8 7 8 8 5 4 10 12 14 12 12 10 110 8 526 b 8 8 9 6 7 9 10 12 9 10 9 8 106 16 527 b 10 10 9 7 9 9 11 12 10 8 10 9 115 14 531 c 3 3 6 4 7 11 9 12 13 10 7 4 88 4 Asia, Inland: 550 e 14 13 13 13 13 15 16 20 17 20 15 15 185 28 551 c 8 12 13 14 14 13 15 16 13 20 11 15 167 3 552 c 12 10 11 8 7 10 12 12 13 18 13 12 138 13 553 e 15 13 13 10 12 14 12 17 19 20 16 14 173 26 554 b 14 13 11 12 10 12 12 13 18 17 16 14 162 18 556 b 5 5 4 4 4 7 8 8 6 7 8 7 73 30 557 c 8 7 6 6 4 7 11 12 9 4 9 6 99 5 558 c 8 9 7 5 6 8 10 11 12 11 11 10 107 5
b - 0.004 inch or more. c - 0.01 inch or more. d - 0.04 inch or more. e - Not defined.
182 | Vol_VII-0188
Table XIV . Mean number of days with precipitation (cont.) ✓ Station Amt Jan Feb Mar Apr May Jun Jul Aug Sep Oct Nov Dec Ann Yrs Rec Asia, Inland (cont.): 559 c 17 15 10 6 7 10 14 15 13 16 18 19 161 10 560 c 8 7 9 9 11 13 12 12 11 13 11 11 127 8 561 c 14 10 10 7 11 12 11 15 15 16 17 15 154 10 562 c 14 11 11 7 14 15 12 14 16 15 16 15 159 10 563 c 12 12 12 11 12 13 12 14 17 19 16 14 164 42 565 e 14 12 9 8 10 9 6 7 9 15 19 16 134 12 566 b 8 8 7 7 9 11 9 10 10 10 11 10 110 26 567 c 11 10 9 7 8 9 10 9 11 14 14 11 122 25 568 b 9 8 5 5 6 8 9 10 9 12 12 10 104 31 569 e 3 6 4 5 12 15 8 14 7 10 6 4 94 1 570 e 6 5 5 7 7 8 8 11 9 9 6 4 85 18 572 e 8 8 8 6 6 7 12 12 8 10 11 9 105 21 573 c 8 7 7 6 8 10 10 11 10 11 10 10 107 18 574 c 11 9 9 10 12 14 12 14 13 16 15 13 146 21 575 c 16 15 15 11 12 13 12 13 14 16 19 17 173 10 576 b 17 14 14 11 11 12 14 12 14 16 21 19 176 13 577 e 16 13 12 12 12 13 13 14 13 18 17 16 167 …
b - 0.004 inch or more. c - 0.01 inch or more. e - Not defined.
183 | Vol_VII-0189
Table XV . Mean precipitation (inches) ✓ Station Jan Feb Mar Apr May Jun Jul Aug Sep Oct Nov Dec Ann Yrs Rec Oceanic: 003 0.1 0.3 0.2 0.1 0.3 0.4 0.7 1.0 0.3 0.2 0.2 0.2 3.9 2 004 1.5 1.7 1.1 0.9 0.5 0.6 0.8 1.1 2.5 2.2 1.4 1.0 15.3 7 005 1.1 1.4 1.2 0.7 0.7 0.8 0.7 0.9 1.6 1.4 1.0 1.1 12.6 15 006 0.2 0.2 0.1 0.1 0.2 0.3 1.1 0.5 0.6 0.2 0.1 0.2 3.7 24 007 0.2 0.2 0.1 0.1 * 0.7 1.1 1.0 0.3 0.2 0.1 0.2 4.5 21 Alaska, Coastal and Insular: 100 0.2 0.2 0.1 0.1 0.1 0.3 0.9 0.7 0.5 0.6 0.3 0.3 4.2 25-27 101 0.1 0.1 0.2 0.1 0.1 0.1 0.3 0.3 0.4 0.5 * 0.4 2.6 … 102 0.7 0.2 0.2 0.4 0.1 0.4 1.3 1.1 0.6 0.5 0.3 0.3 6.1 11 103 1.3 1.3 0.9 0.6 0.5 1.0 1.4 2.5 2.6 1.1 0.6 1.3 14.9 3-6 104 1.1 0.8 0.8 0.7 0.6 1.1 2.5 3.2 2.7 1.6 1.0 1.1 17.3 35-37 105 1.1 1.5 0.5 1.4 0.6 0.4 1.5 1.4 2.4 2.1 1.0 1.0 14.8 2-5 106 0.8 0.7 0.6 0.4 0.5 0.7 1.6 2.6 2.6 2.2 1.0 0.9 14.6 24-26 Alaska, Inland: 150 * * 1.0 1.7 1.0 1.6 2.6 5.0 3.7 1.5 * * 18.8 2-5 151 … … … * * 1.0 1.0 2.7 * 1.0 * * … 1-2 152 0.6 0.2 0.2 0.5 0.6 0.7 1.5 0.9 1.8 0.6 0.6 0.6 8.2 6-8 153 0.4 0.4 0.3 0.3 0.5 0.8 1.1 1.2 0.6 0.6 0.4 0.3 6.8 21-27 154 1.0 0.6 0.8 0.5 0.7 1.1 2.4 3.9 3.3 1.6 1.0 0.8 17.7 18-19 155 0.8 0.7 0.6 0.2 0.8 1.2 2.4 2.5 1.7 1.1 0.7 0.6 13.3 36-43 156 1.0 0.5 0.7 0.3 0.6 1.4 1.9 2.0 1.3 0.8 0.7 0.6 11.7 35-38 157 0.5 0.4 0.4 0.4 0.8 1.5 1.8 2.0 1.3 0.8 0.5 0.4 10.7 33-36 Canada, Coastal and Insular: 201 0.4 0.1 0.4 0.2 0.4 0.2 0.7 0.5 0.4 0.2 0.2 0.3 3.9 3
*Less than 0.05 inch.
184 | Vol_VII-0190
Table XV . Mean precipitation (inches) (cont.) ✓ Station Jan Feb Mar Apr May Jun Jul Aug Sep Oct Nov Dec Ann Yrs Rec Canada, Coastal and Insular (cont.): 204 0.4 0.2 0.5 0.5 0.5 0.8 0.9 1.8 0.5 1.4 0.8 0.2 8.6 5 208 0.9 0.8 0.9 0.4 1.5 … … … 0.9 0.4 0.3 0.2 … 0-1 211 0.4 0.2 0.4 0.3 0.6 0.6 0.6 1.5 0.7 0.7 0.4 0.4 6.8 10 212 0.1 0.2 0.4 0.2 0.4 1.0 1.1 1.8 1.5 1.7 0.7 0.2 8.6 4 213 0.2 0.1 0.1 0.3 0.4 0.4 1.3 1.0 0.9 0.6 0.5 0.4 6.2 5 214 0.2 0.2 0.1 * 0.4 0.2 0.9 1.2 0.4 1.1 0.8 0.1 5.7 5 215 0.2 … … … 0.5 1.2 0.8 1.1 0.6 0.8 0.1 0.3 … 0-6 216 0.6 0.4 0.6 0.8 0.6 0.8 1.3 1.9 1.0 1.2 0.8 0.6 10.7 13 217 0.7 … … … … … 2.0 1.2 0.9 … 0.1 0.1 … 0-1 220 0.3 0.3 0.6 0.5 0.7 2.3 3.4 1.2 2.2 0.6 0.9 0.7 13.6 4 221 0.4 0.5 0.5 0.9 0.7 1.0 1.8 1.5 1.4 1.3 0.8 0.9 10.9 20 222 0.2 0.4 0.2 0.5 0.6 0.5 1.5 1.7 1.5 0.7 0.5 0.1 8.5 6 223 0.6 0.6 0.6 1.1 0.8 1.0 1.7 1.9 1.7 1.3 1.5 0.8 13.6 14 224 0.7 0.7 0.6 1.0 1.3 1.5 1.8 1.7 1.5 1.5 1.2 0.5 14.1 6 225 0.3 0.3 0.2 0.5 1.2 0.6 1.6 1.4 1.7 0.7 0.4 0.5 9.5 3½ 226 0.9 1.5 1.0 1.8 0.7 1.1 1.2 1.9 1.0 1.6 2.2 2.1 17.0 7 227 1.0 1.1 1.0 0.9 1.3 1.3 1.9 1.5 2.3 1.3 1.2 1.0 16.0 15 228 0.5 0.6 0.9 0.9 0.9 1.8 2.2 2.7 2.3 1.4 1.0 0.7 16.0 54 Canada, Inland: 250 0.6 0.5 0.4 0.5 0.6 0.8 1.3 1.3 0.9 0.8 0.8 0.5 9.0 20 251 0.6 0.5 0.4 0.6 0.5 1.l 1.3 1.6 1.3 0.9 0.7 0.6 10.1 28 252 0.9 0.7 0.5 0.5 1.0 1.2 1.5 1.6 1.4 1.2 1.1 1.0 12.6 41 253 0.5 0.4 0.7 0.3 0.6 1.3 1.8 1.2 1.6 1.0 1.1 0.6 11.1 6 254 0.5 0.5 0.5 0.5 0.7 1.0 1.5 1.7 1.2 1.1 0.8 0.6 10.6 31
*Less than 0.05 inch.
185 | Vol_VII-0191
Table XV . Mean precipitation (inches) (cont.) ✓ Station Jan Feb Mar Apr May Jun Jul Aug Sep Oct Nov Dec Ann Yrs Rec Canada, Inland (cont.): 255 1.1 0.7 0.6 0.6 1.2 2.4 1.9 1.6 1.4 1.3 1.7 1.3 15.8 9 256 0.5 0.5 0.4 0.4 1.2 1.3 2.0 1.9 1.1 0.8 0.6 0.5 11.2 30 257 0.5 0.5 0.4 0.4 1.2 1.3 2.0 1.9 1.1 0.8 0.6 0.5 11.2 31 258 0.7 0.7 0.5 0.7 1.4 1.5 2.0 1.5 1.3 1.1 0.9 0.8 13.0 42 259 0.6 0.5 0.5 0.7 0.9 1.3 1.3 1.8 1.5 1.0 0.9 0.8 11.8 45 260 0.8 0.5 0.6 0.5 0.7 0.9 1.2 0.9 0.7 1.1 0.7 0.6 10.3 … 261 0.6 0.6 0.5 0.5 0.9 1.2 1.1 1.4 1.6 1.1 1.4 0.7 11.6 27 262 0.5 0.6 0.5 0.5 1.0 1.8 2.2 1.8 1.7 0.9 0.8 0.7 13.0 26 263 0.6 0.4 0.6 0.6 1.1 1.8 2.0 1.7 1.3 0.7 0.6 0.5 12.1 30 Greenland and Iceland, Coastal and Insular: 302 0.1 0.1 0.1 0.1 0.1 0.2 0.5 0.5 0.4 0.1 0.1 0.2 2.6 3 303 1.2 0.7 0.7 0.1 0.2 0.2 * 0.3 0.3 0.2 1.0 0.7 5.8 2 304 0.4 0.4 0.6 0.6 0.6 0.6 1.0 1.1 1.0 1.1 1.1 0.5 9.0 50 305 1.6 2.5 1.8 1.6 2.8 1.0 3.4 3.7 5.4 4.1 2.3 2.2 32.4 3-4 306 1.0 0.7 0.3 0.5 0.2 0.6 0.2 0.7 0.5 0.6 0.8 0.8 6.9 4-6 307 1.1 0.6 0.6 0.3 0.5 0.5 0.6 1.4 1.3 0.8 0.8 0.9 8.7 5 308 1.8 1.7 0.6 1.5 0.3 1.0 0.6 0.4 1.1 1.1 1.0 1.5 12.5 10 309 0.6 0.5 0.7 0.6 1.5 1.2 2.7 2.0 1.7 1.4 1.3 1.0 15.2 8 310 0.2 0.9 0.7 0.2 0.7 0.6 1.3 0.6 2.4 0.5 0.8 0.4 9.3 2-3 312 0.2 0.3 0.1 0.1 0.3 0.4 1.0 0.7 0.8 0.6 0.4 0.3 5.1 6-8 313 2.1 1.8 2.4 2.0 3.9 6.7 4.1 1.8 5.6 1.8 1.3 1.7 35.4 4-5 314 1.4 1.7 1.7 1.2 1.7 1.4 2.2 3.1 3.3 2.5 1.9 1.5 23.5 50 317 3.3 2.0 2.4 2.4 2.4 2.1 1.9 2.4 3.7 5.7 3.3 2.8 34.3 28 318 3.3 2.6 3.3 2.5 3.5 3.2 3.1 3.8 5.8 5.7 4.6 3.2 44.6 50
*Less than 0.05 inch.
186 | Vol_VII-0192
Table XV . Mean precipitation (inches) (cont.) ✓ Station Jan Feb Mar Apr May Jun Jul Aug Sep Oct Nov Dec Ann Yrs Rec Greenland and Iceland, Coastal and Insular (cont.): 319 1.4 1.5 2.5 1.0 2.8 1.8 2.6 3.8 4.1 4.6 1.6 0.8 28.5 2-3 321 7.3 8.2 11.9 7.9 9.5 8.2 6.2 6.5 7.9 9.5 5.8 10.9 99.7 4-6 331 3.9 3.3 2.7 2.4 1.9 1.9 1.9 2.0 3.5 3.4 3.7 3.5 34.3 50 333 7.5 6.4 6.2 5.2 5.0 5.9 5.8 7.0 10.3 8.4 8.7 9.5 85.9 10 334 0.6 0.7 0.5 0.4 0.7 1.4 1.4 2.3 2.0 2.5 1.8 0.9 15.3 13 335 1.4 0.9 1.3 0.9 0.7 1.7 2.1 2.6 2.4 4.0 2.2 1.9 22.0 12 336 5.0 2.6 3.1 3.5 2.3 2.4 3.2 3.7 3.8 5.1 3.3 4.5 25.0 12 337 6.9 6.7 7.7 4.5 5.6 5.4 3.8 5.9 7.7 6.0 7.5 8.7 76.4 11 338 8.6 6.9 6.2 5.2 4.4 4.5 4.3 4.3 7.5 7.5 7.2 7.6 74.2 15 339 1.7 0.9 0.9 0.8 0.9 1.6 2.0 2.6 2.6 2.6 2.0 2.5 21.1 10 340 8.6 5.4 3.8 1.9 2.3 2.6 2.3 2.7 11.9 3.9 5.4 6.8 57.6 3 341 4.1 3.8 4.1 2.4 3.9 3.2 4.3 4.6 6.4 4.8 5.9 6.0 53.5 8 Greenland and Iceland, Inland: 360 5.0 4.5 3.3 2.6 2.6 3.4 2.9 5.6 4.3 5.6 4.0 3.9 47.7 7 361 1.0 0.6 0.7 0.4 0.6 1.1 1.6 2.5 1.6 1.0 0.8 0.9 12.7 5 Europe, Coastal and Insular: 400 0.2 0.3 0.2 0.2 0.2 0.3 0.7 1.1 0.7 0.3 0.2 0.2 4.6 1 401 0.2 0.1 0.1 0.1 0.2 0.4 0.8 0.6 0.7 0.3 0.2 0.1 3.8 2 402 1.1 1.1 0.9 1.1 0.4 0.5 0.6 1.6 1.3 1.0 1.5 1.3 12.3 … 403 1.3 1.2 1.1 0.9 0.5 0.5 0.7 0.8 0.9 1.2 1.0 1.6 11.7 14 406 2.6 3.1 2.8 2.2 2.1 2.2 2.8 2.6 3.9 3.5 3.4 2.9 34.1 50 407 1.4 1.4 1.3 0.6 0.8 1.3 1.5 1.6 2.7 1.5 1.5 1.4 17.0 10 408 2.7 2.6 2.1 1.6 1.4 1.5 1.8 2.1 2.4 2.5 2.5 2.6 25.8 … 409 4.9 4.6 3.6 2.7 2.8 2.7 2.9 3.7 5.5 5.0 5.2 4.5 48.1 50
187 | Vol_VII-0193
Table XV . Mean precipitation (inches) (cont.) ✓ Station Jan Feb Mar Apr May Jun Jul Aug Sep Oct Nov Dec Ann Yrs Rec Europe, Coastal and Insular (cont.): 410 2.1 1.9 1.4 1.1 1.1 1.2 1.5 1.9 2.6 2.6 2.7 2.0 22.1 50 411 6.2 7.5 4.5 2.9 3.7 3.1 3.2 3.2 7.0 7.2 7.5 5.5 61.5 50 412 2.8 2.9 2.4 1.7 2.7 2.7 2.4 2.0 4.0 4.3 3.8 2.4 34.1 50 413 3.0 2.7 2.2 1.7 1.6 1.5 1.7 2.1 3.7 3.5 3.7 2.8 30.2 50 414 4.3 4.4 3.1 2.3 1.9 2.2 2.2 2.8 4.7 4.6 4.4 3.8 40.7 50 415 0.5 0.8 0.5 0.6 1.2 1.2 2.3 1.9 1.7 1.3 1.3 0.9 14.4 18 417 0.3 0.3 0.3 0.3 0.5 0.7 1.0 1.8 2.0 1.5 0.8 0.4 9.9 … 419 0.7 0.8 0.6 0.6 0.8 1.5 2.3 1.9 1.9 1.5 1.2 0.9 14.7 50 420 3.5 3.0 2.5 2.2 2.5 2.5 3.0 3.3 5.1 4.6 4.7 3.2 40.1 50 421 1.5 1.2 1.5 1.0 1.7 1.7 2.4 3.2 2.7 2.7 2.1 1.7 23.3 50 422 1.7 1.5 1.3 1.4 1.7 2.0 2.4 2.8 2.6 2.3 2.1 1.7 23.5 30 423 1.5 1.1 1.0 0.9 1.1 1.3 1.8 2.1 2.2 2.2 1.9 1.3 18.4 51 424 1.8 1.5 1.4 1.4 1.8 1.8 2.2 2.9 2.5 2.6 2.5 2.0 24.4 40 425 0.8 0.6 0.7 0.9 1.2 2.0 2.6 2.9 2.7 1.9 1.2 0.9 18.9 25 426 1.1 1.0 1.0 1.3 1.8 2.3 2.3 3.3 2.4 1.9 1.6 1.2 21.2 50 427 0.7 0.7 0.8 1.0 1.5 1.7 2.3 2.3 1.8 1.1 0.8 0.7 15.4 25 428 0.9 0.8 0.9 0.8 1.4 2.0 2.4 2.5 2.2 1.8 1.3 1.0 18.0 45 429 0.5 0.3 0.4 0.6 1.0 1.7 1.8 2.0 1.9 1.3 0.8 0.6 15.4 20 Europe, Inland: 450 0.5 0.4 0.3 0.3 0.8 1.3 2.8 2.4 1.3 0.9 0.7 0.4 12.1 32 451 0.7 0.5 0.4 0.5 0.7 1.6 2.0 1.9 1.8 0.9 0.9 0.5 12.4 30 452 0.7 0.5 0.6 0.9 1.3 2.1 2.4 2.7 1.4 1.3 1.0 0.7 15.6 … 453 1.1 0.9 0.9 1.2 1.4 2.3 2.5 2.6 2.1 2.0 1.6 1.2 19.8 30 454 3.4 2.9 2.2 1.8 1.5 1.7 2.2 3.0 3.3 3.4 2.1 2.6 30.1 50
188 | Vol_VII-0194
Table XV . Mean precipitation (inches) (cont.) ✓ Station Jan Feb Mar Apr May Jun Jul Aug Sep Oct Nov Dec Ann Yrs Rec Europe, Inland (cont.): 455 1.2 1.0 1.0 0.9 1.2 1.2 1.4 1.5 1.2 1.3 1.2 1.3 14.4 38 456 1.0 0.7 0.7 0.8 1.3 1.7 2.7 2.9 2.0 1.6 1.1 0.9 17.3 51 457 1.6 1.2 1.3 1.3 1.7 2.6 2.6 3.2 2.7 2.4 1.9 1.7 24.3 51 458 1.5 1.3 1.1 1.3 1.7 2.4 3.1 3.2 2.5 2.3 1.8 1.5 23.7 50 Asia, Coastal and Insular: 500 0.1 0.1 0.1 0.1 0.2 0.5 1.0 1.5 0.9 0.3 0.1 0.1 5.1 3 501 0.3 0.1 0.1 0.2 0.2 0.9 1.5 1.2 0.9 0.4 0.2 0.2 6.2 18 502 0.2 0.1 0.1 0.2 0.2 0.8 1.5 2.0 0.9 0.3 0.1 0.2 6.5 19 503 0.1 0.1 0.1 0.1 0.1 0.7 1.1 1.1 0.4 0.3 0.2 0.1 4.5 22 504 0.1 0.1 0.1 * 0.2 0.4 1.2 1.0 0.5 0.2 0.1 0.2 4.0 4 505 0.7 0.6 0.5 0.4 0.5 0.7 1.0 1.5 1.4 1.1 0.6 0.6 9.6 24 506 0.3 0.2 0.2 0.2 0.3 0.8 1.1 1.3 1.3 0.8 0.4 0.4 7.3 18 507 0.3 0.2 0.2 0.2 0.2 0.5 1.5 1.2 1.5 0.6 0.4 0.3 7.0 6 508 0.3 0.3 0.2 0.2 0.2 0.6 0.6 1.6 1.1 0.5 0.4 0.2 6.2 13 509 0.4 0.2 0.2 0.2 0.5 0.9 0.9 2.0 1.7 0.6 0.3 0.3 8.3 15 510 0.2 0.1 0.2 0.2 0.2 0.7 0.8 1.6 1.6 0.5 0.3 0.2 6.6 17 511 0.1 0.1 0.0 0.0 0.2 0.4 0.3 1.4 0.4 0.1 0.2 0.2 3.4 2 512 0.1 0.1 0.1 0.1 0.1 1.3 1.2 1.1 0.8 0.2 0.2 0.1 5.4 7 513 0.2 0.2 0.1 0.2 0.3 1.2 1.1 1.1 0.8 0.4 0.4 0.3 6.0 7 514 0.1 0.1 0.1 0.1 0.2 0.4 0.6 0.6 0.4 0.2 0.1 0.1 3.0 4 515 0.2 0.2 0.2 0.1 0.4 0.8 1.1 1.1 0.7 0.3 0.3 0.3 5.7 14 516 0.2 0.2 0.1 0.1 0.1 1.1 0.9 0.6 0.8 0.2 0.1 0.2 4.2 3 517 0.2 0.2 0.2 0.2 0.2 0.4 0.6 0.9 0.5 0.4 0.1 0.2 4.1 11 518 0.2 0.2 0.2 0.2 0.4 0.9 1.1 1.8 1.8 0.9 0.4 0.4 8.2 9
*Less than 0.05inch.
189 | Vol_VII-0195
Table XV . Mean precipitation (inches) (cont.) ✓ Station Jan Feb Mar Apr May Jun Jul Aug Sep Oct Nov Dec Ann Yrs Rec Asia, Coastal and Insular (cont.): 519 0.2 0.2 0.2 0.2 0.4 0.9 1.0 1.7 1.5 0.9 0.3 0.2 7.8 12 520 0.3 0.3 0.2 0.3 0.7 1.3 1.8 2.0 1.5 0.7 0.5 0.4 10.0 30 521 0.3 0.2 0.3 0.4 0.8 1.9 1.3 2.3 2.0 0.6 0.4 0.3 10.7 25 522 0.5 0.2 0.2 0.2 0.2 0.7 1.5 1.2 0.9 0.5 0.4 0.3 6.8 7 523 0.1 0.4 0.5 0.5 0.2 0.4 0.8 1.8 0.8 0.7 0.2 0.2 6.7 3 524 0.2 0.2 0.2 0.2 0.3 0.3 0.9 1.1 0.7 0.4 0.2 0.1 4.9 4 525 0.6 0.6 0.4 0.5 0.4 0.5 1.6 1.8 2.1 1.9 0.5 1.0 11.8 8 526 0.3 0.3 0.4 0.3 0.4 0.7 1.7 1.8 1.2 1.0 0.6 0.4 9.2 16 527 0.3 0.3 0.2 0.2 0.4 0.9 1.3 1.6 1.1 0.5 0.3 0.4 7.5 14 528 0.4 0.9 0.3 0.4 0.3 0.9 2.0 2.7 2.0 0.2 0.2 0.2 10.4 3 529 0.9 0.7 0.8 0.9 0.3 0.7 1.7 1.9 2.7 1.8 1.3 0.6 14.3 4 530 1.1 0.2 0.6 0.6 0.5 0.7 1.6 1.5 2.6 1.8 0.5 0.8 12.5 7 531 0.1 0.2 0.1 0.2 0.3 1.1 2.1 2.6 1.3 1.0 0.9 0.1 10.0 4 Asia, Inland: 550 0.4 0.6 0.3 0.9 0.5 1.4 1.8 2.7 1.5 1.2 0.7 0.4 11.8 28 551 0.2 0.3 0.3 0.5 0.7 0.8 1.6 1.8 1.1 0.8 0.4 0.6 9.1 3 552 0.3 0.2 0.3 0.3 0.5 1.0 1.5 1.6 1.5 0.9 0.4 0.3 8.9 18 553 0.2 0.2 0.2 0.2 0.4 1.5 1.5 2.5 1.9 1.0 0.5 0.2 10.1 26 554 0.2 0.2 0.2 0.3 0.4 1.2 1.3 1.7 1.7 0.7 0.3 0.2 8.4 17 556 0.2 0.1 0.1 0.2 0.3 0.9 1.1 1.0 0.5 0.3 0.3 0.2 5.1 31 557 0.4 0.2 0.3 0.2 0.4 1.2 1.4 2.4 0.8 0.6 0.4 0.2 8.4 3 558 0.3 0.3 0.2 0.2 0.2 0.9 1.3 1.2 0.8 0.5 0.5 0.4 6.8 13 559 0.6 0.4 0.2 0.2 0.5 0.9 2.4 1.7 1.1 0.4 0.8 0.6 9.8 10 560 0.5 0.3 0.4 0.6 1.5 2.2 2.5 2.0 1.5 0.9 0.6 0.5 13.5 8
190 | Vol_VII-0196
Table XV . Mean precipitation (inches) (cont.) ✓ Station Jan Feb Mar Apr May Jun Jul Aug Sep Oct Nov Dec Ann Yrs Rec Asia, Inland (cont.): 561 0.8 0.6 0.7 0.5 2.0 2.3 2.4 3.0 2.2 1.6 1.0 1.0 18.0 10 562 0.6 0.4 0.5 0.5 1.3 2.5 2.4 3.2 1.9 1.3 0.8 0.7 16.1 28 563 0.5 0.4 0.4 0.6 1.0 1.6 2.0 2.3 2.0 1.1 0.8 0.6 13.2 40 564 0.7 0.6 0.4 0.7 1.5 2.2 3.2 1.7 1.6 0.9 1.0 0.8 15.3 5 565 0.3 0.3 0.2 0.3 0.7 1.5 1.0 1.3 1.0 0.6 0.6 0.4 8.2 … 566 0.4 0.3 0.3 0.4 0.9 1.7 1.6 2.1 1.2 0.7 0.7 0.5 10.7 26 567 0.3 0.3 0.3 0.3 0.9 1.3 1.3 1.6 1.0 0.7 0.6 0.4 9.0 … 568 0.2 0.2 0.1 0.3 0.5 1.1 1.3 1.6 0.9 0.5 0.4 0.3 7.4 35 569 * * * 0.1 0.7 1.6 1.1 1.7 0.4 0.6 0.1 0.1 6.5 1 570 0.1 0.2 0.1 0.3 0.4 0.8 1.2 1.4 0.8 0.3 0.2 0.2 6.1 17 571 0.2 0.1 0.2 0.1 0.2 0.6 1.2 1.2 0.5 0.3 0.4 0.3 5.3 4 572 0.3 0.3 0.3 0.2 0.3 0.8 1.5 1.9 1.1 0.5 0.5 0.4 7.9 21 573 0.6 0.6 0.6 0.7 1.5 2.3 2.9 2.7 1.7 1.3 1.1 0.9 16.9 35 574 0.8 0.5 0.5 0.7 1.4 2.4 2.4 2.6 1.7 1.5 1.2 1.0 16.9 48 575 0.8 0.5 0.5 0.5 1.0 1.8 2.1 2.0 1.7 1.0 1.0 1.0 13.8 18 576 0.7 0.4 0.5 0.7 0.9 1.7 2.5 2.1 1.5 0.9 1.1 0.9 13.8 30 577 0.4 0.3 0.2 0.3 0.7 1.3 1.4 1.4 1.2 0.7 0.5 0.5 8.8 …
*Less than 0.05 inch.
191 | Vol_VII-0197
As shown by the data on the average number of days with precipitation
(Table XIV ), the monthly frequencies are more uniform in continental
locations and in the more southerly Arctic latitudes. There is a
tendency toward summer maxima at high-latitude continental locations and
toward autumn and winter maxima in the maritime locations near the major
winter storm tracks, particularly over the Norwegian and Barents Seas.The annual variation of precipitation amounts over the Arctic Basin
presents a somewhat different picture than the annual variation of
precipitation probabilities. Most locations show decided summer maxima,
usually in July or August. However, between the east coast of Greenland
and Novaya Zemlya the averages are greater in winter than in summer.
(See Table XV .)fig. 48 here
192 | Vol_VII-0198
Diurnal Variation of Precipitation . - Because of the general absence of
important diurnal insolational effects in winter at the higher latitudes,
no diurnal variation in precipitation is observed during this season over
the pack-ice. In other seasons, however, the probability of precipitation
appears to be greater at night than in daytime, a difference which is
especially great in spring. During the warmer months in the lower Arctic,
and particularly at inland points, it is to be expected that precipitation
will be most frequent during daylight hours when thermal convection is
most pronounced. Specific Arctic data by which to verify this conclusion
are lacking however.
193 | Vol_VII-0199
Snowfall . - Snowfall in Arctic regions is, on the average, very light.
However, heavy snows do occur in the more mountainous regions and also
in the areas under maritime influence near the major winter cyclone paths.
On the plains or steppes of Arctic continental regions, the average annual
snowfall does not often exceed 2 feet. This snowfall, however, does not
result in a uniform snow cover over the interior. The more exposed ridges
and plateaus are free from snow throughout most of the year because they
are swept clean by winds. At the same time, a fairly deep snow cover may
be experienced in valleys and river courses which are more or less protected
from the scouring action of the wind.tables XVI to XVIII here
In regions with a more maritime influence, as around Hudson Bay,
Labrador, southern Greenland and Baffin Bay, average snow depths between
5 and 10 feet are common. In these regions the heaviest precipitation of
the year is often recorded in November and December, with the result that
snowfall constitutes a large percentage of the total annual precipitation.
194 | Vol_VII-0200
Table XVI . Mean number of days with snow ✓ Station Amt Jan Feb Mar Apr May Jun Jul Aug Sep Oct Nov Dec Ann Yrs Rec Oceanic: 002 e 11 11 13 13 19 17 14 14 13 17 9 9 156 2 003 e 2 8 6 6 19 7 4 9 16 13 6 6 102 1 004 c 15 17 15 11 10 3 1 * 6 9 15 17 118 .. 005 e 11 12 13 8 8 2 * * 3 8 12 11 87 .. 006 e 12 8 7 5 6 7 4 8 9 10 9 8 93 .. 007 e 13 11 8 6 7 9 5 7 14 15 10 12 115 .. Alaska, Coastal and Insular: 100 a 2 2 2 3 3 1 2 3 8 9 5 6 46 5 101 a 11 14 13 16 13 6 .. 3 8 18 17 15 … 0-2 104 a 14 15 15 15 9 1 0 0 2 12 15 17 115 1-2 106 a 17 12 14 5 1 * .. .. 1 7 13 15 … 0-7 Alaska, Inland: 153 a 5 4 4 2 1 0 0 0 1 6 6 4 33 10 154 a 10 9 9 8 4 0 0 * 1 7 11 10 69 10 155 a 8 9 9 6 2 * 0 0 2 11 11 10 68 11 156 a 13 9 9 7 3 1 0 0 3 12 13 10 80 10 157 a 10 8 8 7 2 0 0 * 2 8 11 10 66 10 Canada, Coastal and Insular: 204 d 5 3 5 4 6 3 0 1 5 9 8 4 53 5 206 b 6 6 7 6 8 2 0 3 6 8 6 2 60 5 208 a 14 8 19 9 19 7 0 .. 17 24 6 2 … 0-1
a Trace or more b Measurable amounts c 0.004 inches or more d 0.1 inch or more e Not defined * Less than 0.5 day.
195 | Vol_VII-0201
Table XVI . Mean number of days with snow (cont.) Station Amt Jan Feb Mar Apr May Jun Jul Aug Sep Oct Nov Dec Ann Yrs Rec Canada, Coastal and Insular: (cont.) 210 b 6 3 4 4 7 4 1 0 8 8 4 5 54 5 211 b 6 3 6 6 6 4 * 1 7 8 6 5 58 7 213 d 3 1 2 2 2 * 0 * 2 5 3 3 24 5 214 d 3 .. .. 11 10 11 .. .. .. 9 .. 2 … 0-1 216 b 8 6 7 5 7 1 * * 3 9 10 8 64 10 217 d 2 .. 4 .. .. .. 0 0 .. .. .. 4 … .. 221 b 6 5 6 8 6 1 0 0 3 8 9 8 60 10 223 b 6 6 6 11 10 6 * * 5 11 15 11 87 10 224 d 5 5 5 6 7 2 * 0 1 9 8 7 54 6 226 d 6 3 4 7 4 2 0 0 2 7 8 7 51 7 227 b 10 8 11 9 10 4 0 * 1 11 14 14 92 10 228 b 5 6 6 5 2 1 * 0 1 8 9 8 51 10 Canada, Inland: 250 b 4 5 4 4 2 1 0 * 4 7 8 5 44 10 251 d 4 4 3 4 3 2 0 1 4 8 3 3 40 9 252 b 8 6 8 2 * 0 0 0 1 7 11 10 53 10 253 b 7 7 8 2 1 0 0 0 1 5 11 8 50 5 254 b 7 7 8 6 4 * 0 0 2 9 11 7 61 10 255 b 9 7 5 4 * 0 0 0 1 8 13 13 60 8 257 b 6 7 7 6 2 0 0 0 1 6 8 6 49 10 258 b 6 5 8 3 1 0 0 0 * 5 8 8 44 10
a Trace or more b Measurable amounts c 0.004 inches or more d 0.1 inch or more e Not defined * Less than 0.5 day.
196 | Vol_VII-0202
Table XVI . Mean number of days with snow (cont.) Station Amt Jan Feb Mar Apr May Jun Jul Aug Sep Oct Nov Dec Ann Yrs Rec Canada, Inland: (cont.) 259 b 8 8 9 4 1 * 0 0 1 6 12 9 58 10 260 e 8 8 8 4 0 0 0 0 1 4 8 9 50 .. 262 b 7 6 7 3 1 0 0 0 1 6 9 9 49 10 Greenland, Iceland, Coastal and Insular: 304 c 4 4 6 5 6 3 1 1 6 10 10 6 63 .. 307 c 7 4 5 3 3 1 * 1 3 4 6 6 44 5 308 c 8 8 7 4 .. 1 * 0 5 5 5 6 … 9 309 c 8 8 7 8 4 1 * 0 4 8 11 11 70 13 314 d 8 7 7 6 4 2 * * 2 7 7 6 56 26 317 c 13 12 11 9 6 1 0 * 3 9 10 11 84 28 318 e 11 9 10 8 5 1 * * 2 6 9 10 70 .. 330 e 17 14 12 9 3 1 * * 2 3 10 12 87 16 331 c 15 12 9 5 2 * 0 0 1 4 8 12 69 19 332 e 12 11 12 8 3 1 0 0 1 5 6 8 67 9 333 e 12 10 8 4 2 * * 0 1 3 6 9 55 11 334 e 8 7 7 6 2 1 0 0 1 5 4 5 45 14 335 e 12 10 10 9 3 1 * * 1 8 8 10 73 15 336 e 9 9 8 8 2 * 0 * 1 6 7 8 59 16 337 e 8 6 4 3 1 0 0 0 * * 4 5 31 11 338 e 8 5 5 3 1 * 0 0 * 2 3 5 31 15 339 e 11 8 10 9 3 2 * 0 1 6 4 6 60 10
a Trace or more b Measurable amounts c 0.004 inches or more d 0.1 inch or more e Not defined * Less than 0.5 day.
197 | Vol_VII-0203
Table XVI . Mean number of days with snow (cont.) Station Amt Jan Feb Mar Apr May Jun Jul Aug Sep Oct Nov Dec Ann Yrs Rec Greenland, Iceland, Coastal and Insular: (cont.) 340 e 14 12 13 11 5 1 0 0 1 8 7 10 82 14 341 e 9 8 7 6 1 * 0 0 0 2 3 6 42 8 Greenland, Iceland, Inland: 360 e 10 9 8 3 1 * 0 0 0 3 4 5 43 7 361 e 12 10 10 10 4 3 * 1 4 10 9 10 83 16 Europe, Coastal and Insular: 400 e 12 11 8 8 9 7 5 7 11 15 13 11 117 10 401 e 7 7 7 8 11 10 9 13 16 14 10 8 120 1 406 a 12 12 14 12 8 4 * * 3 9 11 11 96 12 408 a 16 17 16 12 10 4 0 * 3 11 15 17 121 44 411 a 14 15 12 8 4 1 0 0 1 6 11 10 81 .. 412 a 11 11 10 6 3 * 0 0 1 5 8 8 63 44 414 a 13 14 13 10 7 1 0 0 2 8 11 11 90 44 415 e 11 12 10 9 9 4 * * 3 9 15 15 94 18 416 c 11 12 13 10 5 2 0 0 2 7 9 10 81 10 417 e 24 20 19 17 16 6 0 0 1 12 17 22 154 .. 420 a 12 11 11 7 3 * 0 0 * 4 8 9 65 44 421 a 11 11 11 6 2 * 0 0 * 3 7 13 64 36 423 a 15 12 12 7 3 * 0 0 * 5 10 13 77 27 424 e 17 16 13 7 2 * 0 0 * 4 10 15 84 36 425 e 14 13 11 8 4 1 0 0 1 7 15 16 91 18
a Trace or more b Measurable amounts c 0.004 inches or more d 0.1 inch or more e Not defined * Less than 0.5 day.
198 | Vol_VII-0204
Table XVI . Mean number of days with snow (cont.) Station Amt Jan Feb Mar Apr May Jun Jul Aug Sep Oct Nov Dec Ann Yrs Rec Europe, Coastal and Insular: (cont.) 426 e 20 18 12 7 2 * 0 0 * 5 13 19 97 18 428 e 8 9 8 4 3 1 0 0 1 6 10 10 60 25 429 e 8 7 5 5 6 2 1 1 3 7 10 7 60 17 450 a 13 11 10 8 5 2 * * 3 8 12 12 84 32 451 a 9 8 9 7 6 2 * * 2 7 9 7 66 44 452 c 12 9 11 10 6 3 * 0 1 8 10 10 80 .. 454 c 15 14 13 9 4 * 0 0 1 5 10 13 84 44 455 a 12 10 10 5 2 * 0 0 * 2 7 11 59 38 456 a 14 12 13 9 4 1 * 0 2 8 12 15 90 26 458 c 18 17 15 10 4 * 0 0 1 8 16 18 107 35 Asia, Coastal and Insular: 500 e 10 8 8 10 10 9 4 6 13 13 9 8 108 7-8 501 e 12 6 6 8 11 9 4 7 11 14 10 11 107 5-6 502 e 13 9 7 11 14 8 7 4 13 14 11 11 122 4-5 503 e 6 8 5 4 6 7 4 6 10 13 11 8 88 7-8 505 e 16 14 13 12 12 7 1 1 5 12 14 14 121 14 506 e 14 10 9 10 8 5 * * 5 13 15 16 106 24 507 e 12 10 11 9 7 5 1 1 8 14 12 13 104 17 508 e 16 14 13 12 10 6 2 1 10 18 17 15 133 5 509 e 19 13 14 13 14 8 0 1 10 18 15 12 136 6-7 510 e 12 11 11 10 10 9 9 3 10 17 14 12 122 19
a Trace or more b Measurable amounts c 0.004 inches or more d 0.1 inch or more e Not defined * Less than 0.5 day.
199 | Vol_VII-0205
Table XVI . Mean number of days with snow (cont.) Station Amt Jan Feb Mar Apr May Jun Jul Aug Sep Oct Nov Dec Ann Yrs Rec Asia, Coastal and Insular: (cont.) 511 e 4 5 1 2 8 4 0 2 7 4 10 6 53 2 512 e 20 13 12 11 7 1 0 0 1 6 12 12 95 7 514 e 15 12 14 13 13 2 0 * 3 12 14 14 112 11 515 e 4 4 4 2 9 6 2 4 11 7 8 6 67 4 517 e 8 7 7 6 8 4 1 5 8 8 7 7 76 9 518 e 13 10 12 11 11 6 1 * 6 15 16 16 115 26 519 e 12 11 9 11 12 5 1 1 7 15 14 12 110 22 520 e 8 9 7 7 7 1 * 0 3 10 10 9 72 10 521 e 13 9 10 11 11 4 * * 4 15 14 10 102 4 522 e 8 9 8 8 6 1 1 4 10 13 10 10 88 4 523 e 11 8 13 10 10 3 4 1 8 13 17 12 110 3 524 e 13 11 14 10 10 0 0 0 2 10 12 10 92 4 525 e 7 6 8 8 5 1 1 1 5 10 11 9 72 7 526 e 8 8 8 7 6 * 0 * 2 8 10 8 65 13 527 e 9 10 8 7 7 2 * * 2 6 9 9 66 14 529 a 12 12 7 8 4 0 0 0 0 2 7 7 69 4 530 e 12 13 15 13 6 0 0 0 0 3 8 12 82 7 531 e 3 3 6 4 4 * 0 * 0 7 7 3 37 4 Asia, Inland: 550 e 22 .. 21 .. 16 7 0 0 10 23 .. 12 … 0-1 551 e 25 15 8 13 12 7 0 5 8 19 14 16 142 1 552 e 10 7 9 9 8 2 * 1 9 16 10 8 89 ..
a Trace or more b Measurable amounts c 0.004 inches or more d 0.1 inch or more e Not defined * Less than 0.5 day.
200 | Vol_VII-0206
Table XVI . Mean number of days with snow (cont.) Station Amt Jan Feb Mar Apr May Jun Jul Aug Sep Oct Nov Dec Ann Yrs Rec Asia, Inland: (cont.) 553 e 13 12 12 9 10 5 * * 7 19 17 14 118 14 554 e 8 7 9 10 7 5 0 * 6 12 13 10 85 4 556 e 7 6 4 4 3 1 * 1 4 8 8 8 54 18 558 e 3 5 4 3 1 1 * 1 4 8 8 4 42 5 559 e 17 14 10 5 4 1 * 1 5 15 18 20 111 9 560 e 10 12 12 10 7 2 0 * 3 14 14 13 96 8 561 e 12 7 7 7 5 1 * 0 1 8 9 11 667 3 562 e 15 12 13 8 7 1 * * 3 12 16 16 104 10 563 e 10 9 10 9 9 4 * * 7 16 15 14 103 15 566 e 9 8 6 6 3 * 0 0 2 9 10 9 62 16 567 e 12 11 9 7 4 * 0 * 3 13 15 12 86 12 568 e 9 6 4 4 1 0 0 0 1 10 9 9 53 14 570 e 3 4 5 6 3 0 0 0 2 9 7 3 42 8 571 e 11 2 3 8 6 0 0 0 4 12 12 7 65 0-1 572 e 7 7 7 5 4 * 0 * 3 9 10 8 62 16 573 e 8 6 7 4 2 * 0 0 1 6 10 10 54 18 574 e 11 9 9 8 4 * 0 0 2 13 15 13 83 21 575 e 17 15 14 9 4 * 0 0 3 13 19 18 112 18 576 e 16 14 14 11 6 * 0 * 5 15 21 18 120 13
a Trace or more b Measurable amounts c 0.004 inches or more d 0.1 inch or more e Not defined * Less than 0.5 day.
201 | Vol_VII-0207
Table XVII. Mean monthly snowfall (inches) Station Jan Feb Mar Apr May Jun Jul Aug Sep Oct Nov Dec Ann Yrs Rec Alaska, Coastal and Insular: 100 2.6 2.7 2.0 2.7 1.8 0.4 1.0 0.7 3.0 7.9 4.3 3.9 33.0 21-33 102 15.6 5.4 5.7 5.2 0.5 0.4 0.0 * 1.4 5.2 3.5 3.8 46.7 6-11 104 10.8 8.9 10.2 5.1 1.3 0.2 0.0 * 0.4 3.6 8.5 10.8 59.8 29-34 105 0.9 0.7 0.1 0.7 0.5 0.2 1.2 0.6 1.0 1.1 0.3 0.2 7.5 2-5 106 12.1 8.7 7.7 2.9 0.2 0.0 0.0 0.0 * 5.2 11.2 10.4 58.4 21-25 Alaska, Inland: 152 9.4 11.3 4.5 5.1 1.8 0.0 0.0 0.0 * 7.1 11.2 11.7 62.1 6-8 153 7.8 6.9 3.8 1.6 0.5 0.0 0.0 0.1 1.3 7.2 7.7 5.1 42.0 21-27 154 7.2 4.9 8.0 3.3 0.5 0.0 0.0 0.0 0.2 3.3 5.2 9.3 41.9 16-18 155 10.0 9.5 8.1 2.5 0.5 * * 0.0 0.9 7.6 5.8 8.6 53.5 33-37 156 11.7 7.2 8.1 2.7 0.4 * 0.0 0.1 0.7 6.5 7.4 8.7 53.5 31 157 8.4 5.4 5.5 3.6 0.5 * 0.0 0.2 1.7 8.1 9.2 10.1 52.7 28-31 Canada, Coastal and Insular: 204 3.8 2.4 5.4 5.1 4.5 5.3 0.0 0.6 3.5 14.1 8.7 2.4 55.8 5 205 1.7 4.6 1.1 1.0 0.0 0.0 0.0 0.0 4.5 7.5 7.2 0.5 28.1 3 206 2.3 3.2 2.5 1.2 4.0 1.4 0.0 5.3 5.5 3.8 2.2 1.2 32.6 1-4 210 9.7 2.1 3.7 4.5 6.2 8.7 0.1 * 17.8 17.6 10.5 3.5 84.4 4 211 3.9 2.3 3.9 2.7 5.3 3.5 0.1 1.6 5.7 7.0 4.3 3.9 44.2 10 212 1.1 2.3 4.2 2.1 4.3 5.5 0.0 0.2 4.5 16.8 6.6 2.2 40.8 4 213 2.5 0.8 0.9 2.6 3.6 0.5 0.0 0.4 1.3 5.6 4.7 3.9 26.8 5 214 2.4 2.3 0.8 0.4 3.8 1.5 1.0 * 1.0 11.0 8.0 1.1 33.3 5 215 2.2 … 1.5 3.5 5.2 0.4 0.0 0.0 4.2 3.2 1.3 2.6 … 0-6 216 5.7 4.4 6.3 5.2 4.9 1.8 * 0.2 3.9 9.9 8.4 6.3 57.0 13 217 3.4 5.0 2.0 3.6 4.8 6.2 0.0 T 2.5 3.9 5.8 3.6 40.8 13
* Less than 0.05 inch. T Trace
202 | Vol_VII-0208
Table XVII. Mean monthly snowfall (inches) (cont.) Station Jan Feb Mar Apr May Jun Jul Aug Sep Oct Nov Dec Ann Yrs Rec Canada, Coastal and Insular: (cont.) 221 3.5 5.5 5.0 8.8 6.1 0.8 0.0 * 1.2 9.1 8.0 9.1 57.0 20 222 1.7 3.8 2.4 5.1 6.3 1.6 0.0 0.0 3.4 7.2 4.6 1.3 37.4 6 223 5.7 5.5 5.9 11.2 6.7 4.0 0.9 0.6 3.1 10.6 14.7 8.4 77.3 14 224 7.2 7.1 4.8 10.0 5.7 2.0 0.0 0.0 1.0 12.3 9.6 4.9 64.8 6 225 3.0 3.4 1.7 5.4 8.8 2.3 0.0 0.0 4.1 5.2 4.3 4.8 43.0 3 226 8.8 14.6 9.2 18.0 4.5 1.6 0.0 0.0 2.1 13.1 22.1 21.0 115.0 7 227 10.2 11.1 9.4 8.7 9.0 3.0 * 0.1 2.2 8.2 12.1 10.3 84.3 15 228 4.8 6.1 8.5 7.7 1.8 1.4 0.0 * 1.7 8.1 10.3 6.6 56.9 30 Canada, Inland: 250 5.8 5.3 4.3 5.0 2.4 2.2 * 0.8 3.3 7.3 8.1 4.8 49.3 20 251 6.0 4.7 3.9 6.2 2.7 1.2 0.0 * 3.1 8.0 6.8 6.0 48.6 28 252 8.7 7.0 5.1 3.5 0.6 0.1 0.0 * 1.8 7.9 11.3 10.2 56.2 41 253 4.5 4.3 7.1 2.7 1.2 0.0 0.0 0.0 0.5 5.0 10.8 6.3 42.4 6 254 5.3 4.9 4.9 4.8 3.8 0.4 0.0 0.2 2.8 8.9 8.2 5.8 50.0 31 255 11.1 7.0 6.3 4.0 0.8 0.0 0.0 0.0 0.3 9.2 15.5 13.2 67.4 9 256 4.6 4.9 3.5 4.1 2.5 0.2 0.0 0.1 2.8 7.0 6.1 4.5 40.3 30 257 4.6 4.9 3.5 4.1 2.5 0.2 0.0 0.1 2.8 7.0 6.1 4.5 40.3 31 258 7.2 7.0 4.8 5.8 4.1 * 0.0 0.1 0.7 8.1 8.5 8.3 54.6 42 259 6.2 5.4 5.3 4.9 1.8 0.3 0.0 0.1 0.5 5.0 8.4 8.0 45.6 45 260 8.1 5.0 5.8 3.4 0.2 * 0.0 0.0 0.1 2.3 6.9 5.9 37.7 .. 261 6.3 5.6 5.3 2.9 1.2 0.5 0.0 0.0 1.8 6.8 14.2 7.3 51.9 27 262 5.4 6.0 4.9 4.1 1.3 0.1 0.0 * 0.8 4.7 8.3 6.7 42.3 26 263 6.1 3.7 5.9 3.1 1.0 0.1 0.0 0.0 0.5 3.0 5.1 5.2 33.7 30
* Less than 0.05 inch.
203 | Vol_VII-0209
Table XVII. Mean monthly snowfall (inches) (cont.) Station Jan Feb Mar Apr May Jun Jul Aug Sep Oct Nov Dec Ann Yrs Rec Greenland, Iceland, Coastal and Insular: 302 0.6 0.5 1.5 2.3 1.1 0.8 0.0 0.0 2.2 1.5 2.5 1.9 14.9 3 331 3.0 3.4 1.7 0.8 0.2 0.0 0.0 0.0 * 0.5 1.4 2.1 13.1 15 Europe, Coastal and Insular: 425 8.4 6.7 8.3 8.6 5.0 0.8 0.0 0.1 1.2 5.8 8.6 8.4 60.1 ..
* Less than 0.05 inch.
204 | Vol_VII-0210
Table XVIII Mean snow depth (inches) Station Jan Feb Mar Apr May Jun Jul Aug Sep Oct Nov Dec Ann Yrs Rec Alaska, Coastal and Insular: 100 8 7 8 6 3 * 0 * 1 3 5 6 8 101 1 2 4 9 5 1 0 0 * 2 3 1 1 104 3 13 16 11 4 0 0 0 * * 2 6 11 105 6 8 7 7 1 * 0 0 0 3 8 10 1-4 Alaska, Inland: 153 18 26 23 3 0 0 0 0 * 7 13 16 10 156 18 17 20 11 1 0 0 0 * 1 4 11 14 Canada, Coastal and Insular: 214 13 22 15 24 24 16 2 * * 9 16 18 2-3 216 3 4 6 6 3 2 * * 4 8 6 3 7 223 16 15 19 14 7 0 0 0 0 3 6 11 8 226 13 15 16 13 4 0 0 0 1 8 10 13 3 227 5 8 16 * 0 0 0 0 0 * 7 5 8 Canada, Inland: 252 23 25 4 0 0 0 0 0 0 1 9 13 10 254 18 20 19 14 0 0 0 0 * 5 11 20 2-21 263 20 19 17 0 0 0 0 0 3 13 15 20 10 Greenland and Iceland, Coastal and Insular: 302 3 1 1 2 1 * 0 0 * * 1 2 2-3 305 19 19 21 19 12 * 0 0 * 2 8 16 3-5 308 24 25 28 40 39 8 * 0 * 5 11 22 .. 310 8 8 11 10 7 * 0 0 * 1 6 11 2-3 312 3 2 2 2 * * 0 * * 1 3 3 5-7 317 11 10 12 14 9 3 * 0 * 5 12 10 3 318 6 8 13 11 2 * * 0 * 1 3 5 3-5 319 2 3 4 2 * * 0 0 * 1 2 1 3-7 321 36 33 60 65 44 6 * * * 3 6 20 3-5
* - Less than 0.5 inch.
205 | Vol_VII-0211
Table XVIII Mean snow depth (inches) (cont.) Station Jan Feb Mar Apr May Jun Jul Aug Sep Oct Nov Dec Ann Yrs Rec Greenland and Iceland, Coastal and Insular: (cont.) 330 4 4 4 2 1 0 0 0 0 2 3 4 11 331 4 2 2 1 0 0 0 0 0 1 2 2 10 Greenland and Iceland, Inland: 361 18 19 21 15 7 1 0 0 1 5 11 8 11 Europe, Coastal and Insular: 408 21 28 34 30 14 * 0 0 * 1 5 15 .. 411 9 13 17 4 1 0 0 0 0 * 4 9 .. 415 16 22 25 23 8 0 0 0 0 2 5 10 .. 424 12 16 12 * 0 0 0 0 0 1 1 7 20 425 12 16 18 10 * 0 0 0 0 * 4 8 .. 428 18 24 27 11 * 0 0 0 0 * 4 11 4 Europe, Inland: 451 12 15 16 13 2 0 0 0 0 1 6 11 .. 452 19 25 28 23 6 0 0 0 0 * 7 15 .. 454 3 5 4 1 * 0 0 0 0 * 1 2 15 455 10 12 11 3 0 0 0 0 0 0 2 5 25 457 16 19 15 1 0 0 0 0 0 2 3 9 36 458 16 21 20 4 0 0 0 0 0 1 4 11 18 Asia, Coastal and Insular: 503 7 7 8 8 8 5 * 0 1 3 5 6 7 506 10 11 13 12 11 3 0 0 0 1 3 8 .. 508 11 12 12 13 15 8 0 0 * 3 6 8 6 510 16 21 25 29 27 9 0 0 0 4 11 14 18
* - Less than 0.5 inch.
206 | Vol_VII-0212
Table XVIII Mean snow depth (inches) (cont.) Station Jan Feb Mar Apr May Jun Jul Aug Sep Oct Nov Dec Ann Yrs Rec Asia, Coastal and Insular: (cont.) 513 2 1 5 6 .. 0 0 0 0 5 5 3 3 515 18 21 23 24 24 3 0 0 1 6 10 15 .. 517 8 12 12 9 10 4 0 0 0 2 6 3 11 518 7 8 11 13 12 2 0 0 0 1 3 6 26 519 5 5 4 5 4 * 0 0 0 1 4 4 22 522 13 17 19 19 12 * 0 0 * 3 9 12 .. 523 9 10 12 14 14 5 0 0 0 2 5 6 6 526 13 18 22 25 13 .. 0 0 0 2 4 9 3-4 527 13 18 20 22 18 2 0 0 * 2 5 9 .. Asia, Inland: 552 4 5 4 8 6 0 0 0 1 3 4 4 .. 554 44 50 58 6 * 0 0 0 0 5 25 36 .. 556 9 11 11 11 4 0 0 0 0 3 6 8 6 558 15 18 19 16 8 * 0 0 * 4 9 13 .. 559 15 17 19 19 7 0 0 0 * 2 7 12 .. 562 20 27 32 27 8 .. 0 0 * 1 5 12 11 563 38 41 40 33 27 .. 0 0 0 2 10 23 3 566 11 13 12 6 0 0 0 0 * 1 7 9 .. 568 10 13 15 8 0 0 0 0 * 1 4 6 .. 572 33 38 44 48 40 .. 0 0 0 3 14 26 6 573 20 25 28 13 1 0 0 0 0 1 5 12 9 575 14 17 17 7 * 0 0 0 0 1 5 10 .. 576 23 24 24 19 1 0 0 0 0 3 11 17 8
* - Less than 0.5 inch.
207 | Vol_VII-0213
It is to be noted that the water equivalent of Arctic snow is often
considerable. With the low winter temperatures which occur in the Arctic,
the precipitated snow (plus hoarfrost) is most often in the form of small
ice spicules which form so compact a mass that 2 inches of the snow may
be equivalent to 1 inch of liquid water. The average density of snow
cover over the Arctic Basin area is least at the beginning of winter and
increases to its maximum value in spring (average densities of snow cover
are of the order of 0.30 to 0.45).fig. 49 here
Snow depths probably reach a maximum in March or April over much
of the Arctic. In some of the more maritime regions which experience
heavy snows, the maximum snow depth may not be reached until May. Over
some of the drier continental portions of the Arctic, on the other hand,
the period of maximum snow depth may occur as early as February.
208 | Vol_VII-0214
The snow cover disappears at some time during spring or summer
everywhere in the Arctic except at elevations above the permanent snow
line and in local protected locations nearer sea level. Near the Pole
the snow begins to melt in June, and by the end of July the snow cover is
almost gone. The Russian North Polar Expedition (1937), for example,
reported that it was difficult in late July to find enough
snow to use as ballast for the tents [ 5 ] .
209 | Vol_VII-0215
The average thickness of snow cover by months for selected
Siberian arctic locations is given in Table XVIII . Comparing these data with
the data on monthly snowfall (Table XVII ), it is seen that the thickness
of the snow cover is not completely determined by snowfall alone. Other
factors such as melting, drifting, evaporation and the accretion of rime,
etc., serve to alter the relationship. Topographical conditions also
exert their influence on the snow depths, since larger amounts of
snowfall occur on windward slopes than in leeward locations. This effect
is particularly noticeable in Greenland where the data show considerably
less accretion in the eastern portions than is observed at western
stations in the same latitude. The amount of accretion in the border
regions of the Greenland Ice Cap must also decrease sharply from south to
north, as is evidenced by the comparatively higher elevation of the
permanent snow line in the north (1400 m) compared to the south — a
difference which exists in spite of the temperature decrease toward the
north.
210 | Vol_VII-0216
Thunderstorms . - Thunderstorms have never been recorded over the Arctic
pack-ice but they do occur infrequently at coastal and inland locations
above the Arctic Circle. In Jakobshaven 3 thunderstorms were experienced
in the course of 62 years. In all Arctic regions their frequency
increases rapidly toward the south. For example, Ivigtut has had 24
thunderstorms in 45 years of record; Nanortalik, 77 in 42 years. At
inland locations in more southerly Arctic latitudes, thunderstorms are
fairly frequent and probably occur at least several times each year. at
some inland stations the average annual number is as high as 9 (as at
Fairbanks). Thunderstorms have been recorded in all months [ 43 ] but their
occurrence is most probable in July and August.
211 | Vol_VII-0217
HUMIDITY
Some of the facts concerning humidity conditions within the Arctic
have already been discussed in the section on the composition of the
atmosphere. There it was emphasized that a clear distinction must be
made between humidity as expressed in terms of the actual moisture
content (by vapor pressure, specific humidity, or mixing ratio) and as
expressed in terms of the degree of saturation (by relative humidity or
by saturation deficit). In the latter case a further distinction must
be made between the expression of relative humidity in terms of percent
of saturation with respect to ice and its expression in terms of
saturation with respect to water. (See Table II.) For example, the
observations on the Fram [ 28 ] over the pack-ice during February 1894
gave a mean temperature for the month of −32.1°F. and a mean relative
humidity with respect to ice of 129 percent. The corresponding relative
humidity computed with respect to water for the same month is only 92
percent.
212 | Vol_VII-0218
It should be mentioned that humidity computations at low
temperatures in the Arctic are highly questionable partly because of
the importance of small instrumental or observational errors at these
temperatures and also because of the difficulty in obtaining a sample
unaffected by a local source of moisture (such as the observer himself).As a very generalized statement for the entire Arctic it can be said
that it is essentially a region of high relative humidities but, because
of low temperatures, it is also a region which presents very small absolute
amounts of atmospheric moisture. Relative humidities average generally
between 75 and 100 percent, even over continental areas, except where
foehn (dynamical heating) effects are persistent. Over glaciers, elevated
snowfields, and the pack-ice, however, the relative humidities with respect
to ice are frequently above 100 percent. From 150 observations on about
120 different days in the winters of 1923-24 and 1924-25, Malmgren [ 26 ]
found that over the Polar Sea in winter the relative humidity always
remains near 100 percent. The smallest observed value was 83 percent and
the greatest, 122 percent. In 77 percent of all cases the relative
humidity with respect to ice was between 93 and 107 percent. During
213 | Vol_VII-0219
summer the relative humidities were lower over the Polar Sea but even
in July the average (with respect to a water surface) was 95 percent.Malmgren [ 26 ] points out that in calm weather over the pack-ice
there exists a sharp decrease in relative humidity from the surface
upward due to the presence of the surface temperature inversion. When
the wind blows, however, the mixing processes bring air of higher
temperature, i.e., lower relative humidity, down to the ice. For this
reason the surface humidity decrease as the wind speed increases and
becomes progressively lower as the wind extends the mixing to greater
altitudes. Changes in cloudiness have a similar effect. Under clear
sky conditions (in winter), the increased radiative loss of heat from
the ice lowers the surface air temperature with a resulting increase in
relative humidity. The relations between relative humidity (with respect
to ice) and temperature, wind speed, and cloudiness in winter as found
by Malmgren [ 26 ] are as follows:Wind Speed (mph) 1.3 4.5 8.9 13.2 20.6 Relative Humidity (%) 105.7 103.2 101.1 98.7 96.5
214 | Vol_VII-0220
Temperature (°F.) 10.4 –0.6 –8.9 –17.9 –25.2 –35.9 Relative Humidity (%) 97.1 98.1 98.9 101.1 103.2 103.9 Cloudiness (0-10) 0.9 3.9 7.2 9.9 Relative Humidity (%) 104.3 101.6 99.2 97.9
When a marked surface temperature inversion is present, the humidity
usually decreases from a maximum at the surface to a value between 50 and
60 percent at the top of the inversion. Above the inversion the humidity
remains fairly constant with altitude unless warm, moist air is being
advected aloft from lower latitudes, in which case a marked maximum in
humidity may occur even at altitudes of 15,000 or 20,000 feet.The only circumstances that allow low relative humidities to occur
in the Arctic are offered by strong offshore or downslope winds such as
occur at the foot of a glacier or a mountain range. An example of the
lowering of humidity during periods of offshore (downslope) winds is
given by the following average relative humidity data for Foka Bay,
Novaya Zemlya:Jan Feb Mar Apr May Jun Jul Aug Sep Oct Nov Dec Ann Onshore wind … 82.0 92.1 92.2 92.4 93.8 94.1 94.2 91.9 83.3 83.3 84.8 91.0 Offshore wind … 79.8 81.5 87.1 78.5 81.3 83.5 82.2 82.9 77.6 74.7 74.6 79.5
215 | Vol_VII-0221
Annual Variation of Humidity . — In most inland Arctic regions the
annual variation of relative humidity follows very closely the annual
variation in temperature as would be expected on the basis of the
functional dependence of relative humidity upon air temperature. Inland,
the maximum humidity values are found in winter and the minima, in summer.
In the more maritime regions, the reverse is generally true. In Greenland,
however, the interior ice locations show summer maxima and the coastal
regions, winter maxima. This circumstance can be accounted for by the tables XIX to XXI here
fact that the free air at 8,000 to 10,000 feet is exceedingly dry in
winter compared to its state in summer. On the northern coasts of
Greenland, however, the prevailing downslope winds of summer give
humidities which are lower than those recorded during winter when the
katabatic circulation from the Ice Cap is at its weakest.
216 | Vol_VII-0222
Table XIX . Mean relative humidity (%) by seasons
at continental and coastal stationsContinental Stations Coastal Stations Station Summer Winter Station Summer Winter Fairbanks 48 78 Nome 83 76 Chesterfield 87 92 Barrow 87 81 Meanook 74 85 Coppermine 81 73 Hopes Advance 85 89 “Fram” 94 82 Olekminsk 67 80 “Maud” 96 78 Verkhoyansk 60 72 “Sedov” Foka Bay 91 80 West Station* 83 76 Danmarkshavn** 79 84 Eismitte* 86 79 Angmagssalik** 73 82
*Stations on Greenland Ice Cap. **Stations on northeast Greenland coast.
217 | Vol_VII-0223
Table XX . Mean relative humidity (%) Station Jan Feb Mar Apr May Jun Jul Aug Sep Oct Nov Dec Ann Yrs Rec Oceanic: 002 81 85 .. .. .. .. .. .. .. .. 80 81 .. .. 003 74 75 75 80 87 93 96 96 93 85 79 75 84 2 004 84 83 81 82 82 86 90 86 83 82 81 83 84 .. 005 86 83 80 82 84 88 85 83 84 82 85 86 84 .. 007 89 84 83 89 88 93 96 96 93 88 88 86 89 5-6 008 76 .. .. .. .. .. 95 94 86 79 77 75 .. 0-1 Alaska, Coastal and Insular: 100 84 80 80 80 84 87 86 88 88 86 83 80 84 2 Alaska, Inland: 156 81 76 62 55 53 56 63 69 67 74 81 82 68 9 157 92 85 81 67 56 61 65 76 77 80 86 91 76 1-2 Canada, Coastal and Insular: 201 .. .. .. .. 79 79 80 79 84 83 .. .. .. .. 204 85 84 87 86 90 89 86 87 86 84 88 86 87 2-5 211 .. .. .. .. 83 77 79 83 83 82 .. .. .. 4 216 .. .. .. .. .. 89 90 92 93 93 .. .. .. 2-3 221 .. .. .. .. .. 90 84 85 89 .. .. .. .. 5 Canada, Inland: 250 .. .. .. .. .. 73 76 85 85 .. .. .. .. 5 252 .. .. .. .. 67 69 76 81 86 .. .. .. .. 5 253 90 84 78 65 56 64 64 69 75 79 88 91 75 5 255 93 89 76 70 61 65 66 68 75 78 88 91 77 4 256 90 84 83 73 67 61 64 71 80 85 93 89 78 3
218 | Vol_VII-0224
Table XX . Mean relative Humidity (%) (cont.) Station Jan Feb Mar Apr May Jun Jul Aug Sep Oct Nov Dec Ann Yrs Rec Canada, Inland, (cont.): 258 83 83 76 67 62 59 62 65 71 82 87 80 73 4 260 .. .. .. .. 80 68 71 74 80 90 .. .. .. 5 Greenland and Iceland, Coastal and Insular: 303 84 81 88 78 80 80 80 76 70 74 86 87 80 2 304 73 74 72 78 87 86 82 81 85 89 84 78 75 24 306 .. .. .. .. 72 73 69 68 69 .. .. .. .. 5 314 89 89 89 89 88 84 87 87 86 88 90 88 88 7 317 83 82 81 79 77 74 73 72 73 80 80 81 77 35 320 75 76 74 72 72 73 76 78 76 75 74 75 75 16 331 81 80 80 74 70 75 75 74 74 78 81 81 77 3 Greenland and Iceland, Inland: 351 80 77 78 81 86 84 88 84 84 80 79 78 82 1 Europe, Coastal and Insular: 403 81 80 80 77 76 82 81 83 82 80 79 82 80 .. 408 82 81 81 82 82 83 84 85 85 85 85 83 83 15 412 68 69 71 70 68 71 74 73 75 76 73 69 71 18 414 77 76 74 71 69 71 74 80 80 80 80 78 75 18 415 86 85 80 75 71 70 75 80 83 86 88 88 81 24 420 75 73 73 69 60 74 76 75 76 75 76 74 74 18 421 83 84 81 71 62 61 67 73 66 81 87 88 76 7 423 86 85 83 77 64 65 61 73 78 88 91 87 78 7 424 87 87 82 78 71 72 73 80 83 86 88 89 81 26 425 88 87 83 81 75 73 80 86 88 88 90 90 84 21
219 | Vol_VII-0225
Table XX . Mean relative humidity (%) (cont.) Station Jan Feb Mar Apr May Jun Jul Aug Sep Oct Nov Dec Ann Yrs Rec Europe, Coastal and Insular, (cont.): 426 86 85 79 71 63 63 67 74 79 82 86 87 77 25 428 88 87 83 76 73 68 74 86 85 87 90 89 82 25 429 87 85 81 75 72 69 73 80 85 87 89 88 81 25 Europe, Inland: 450 85 85 84 74 67 63 63 73 77 83 88 87 77 7 454 73 70 70 65 65 66 70 72 77 78 75 76 72 18 455 79 81 78 68 55 55 61 71 73 82 86 84 73 7 456 90 87 79 70 61 56 63 72 76 85 90 92 77 7 Asia, Coastal and Insular: 500 87 84 90 88 88 92 93 92 90 86 87 88 90 7-8 501 82 80 80 84 86 90 90 91 90 87 82 82 85 5-6 502 85 82 82 73 71 70 72 73 80 81 82 85 78 8 503 86 85 82 84 86 90 90 94 90 87 84 82 87 7-8 507 80 82 80 80 78 78 79 80 82 81 82 82 80 17 508 85 84 83 86 87 92 92 91 91 90 88 86 88 6 509 88 87 84 87 89 88 81 87 90 90 87 84 87 6-7 510 89 88 85 88 88 91 90 90 89 88 88 86 88 19 511 85 85 86 87 89 92 92 90 90 88 87 84 87 2 513 81 83 80 80 78 77 76 77 82 80 82 79 80 .. 515 81 82 86 86 88 85 78 84 89 90 87 85 85 6 518 89 89 86 87 89 90 87 90 88 88 89 85 89 26 519 87 88 84 84 88 89 88 92 90 90 89 86 88 22 520 86 90 88 84 83 81 78 82 88 91 87 88 85 4-8 522 80 78 79 70 72 67 69 80 82 87 84 79 77 1
220 | Vol_VII-0226
Table XX . Mean relative humidity (%) (cont.) Station Jan Feb Mar Apr May Jun Jul Aug Sep Oct Nov Dec Ann Yrs Rec Asia, Inland: 553 84 81 81 82 85 83 74 82 85 89 84 82 83 18 554 79 72 74 79 79 73 71 81 87 84 80 75 78 2 556 72 71 67 60 55 53 59 69 75 77 76 74 67 9 558 78 78 76 71 70 65 68 78 78 83 84 82 76 6 562 81 80 75 70 67 69 71 77 82 82 83 81 77 10 566 81 80 73 67 61 64 64 72 75 76 81 80 73 7-15 567 81 81 72 62 60 60 61 69 74 80 83 79 72 12 573 84 80 73 67 63 64 66 77 77 81 85 89 76 9
221 | Vol_VII-0227
Table XXI . Average vapor pressure (mbs) Jan Feb Mar Apr May Jun Jul Aug Sep Oct Nov Dec Ann Yrs Rec Oceanic: 003 0.3* 0.3* 0.4* 0.8* 2.0* 5.2 5.9 6.0 4.2 1.8 0.6* 0.3* … 1-2 007 1.5 1.2 0.7 1.3 2.9 5.2 6.0 6.1 5.5 3.3 1.7 1.3 3.1 5-6 Asia, Coastal and Insular: 500 2.2 1.9 1.1 1.9 3.2 5.1 6.4 6.7 5.6 4.0 2.7 2.1 3.6 7-8 501 1.2 1.1 0.7 1.3 2.8 5.6 7.2 6.9 5.9 2.9 1.5 1.1 3.2 5-6 503 1.1 1.1 0.7 1.1 2.7 5.1 6.5 6.1 5.2 2.7 1.5 0.9 2.9 7-8 507 2.1 1.7 1.2 2.1 3.5 5.2 7.1 7.6 5.9 4.3 3.2 2.4 3.9 17 508 1.7 1.3 0.8 1.7 3.5 5.2 7.5 8.0 6.5 4.0 2.4 1.9 3.7 6 509 1.5 1.1 0.9 1.7 3.9 6.3 9.1 9.3 6.8 3.7 1.9 1.3 4.0 6-7 510 1.3 1.3 0.9 1.7 3.2 5.7 7.5 7.9 6.4 3.5 1.9 1.3 3.6 19 518 2.4 1.9 1.7 2.4 4.5 5.9 8.4 9.3 7.5 4.9 3.7 2.7 4.7 26 519 2.0 1.3 1.5 2.1 4.4 5.7 8.8 9.3 7.3 4.5 2.9 2.1 4.4 22 Asia, Inland: 553 1.2 1.2 1.2 1.9 3.5 6.7 10.3 9.9 7.1 3.5 1.5 1.1 4.4 18
* - The values for November through May were obtained from plot of annual
course of vapor pressure, page 253, “Scientific Results of the Maud
Expedition: by Sverdrup.
222 | Vol_VII-0228
Data concerning the annual course of vapor pressure over the Arctic
are not available in any regional detail. However, the values nearly
everywhere should be lowest in winter (0.1 to 0.4 mb near sea level) and
highest in July or August (4.0 to 6.5 mb near sea level). These values
are approximately of the same order of magnitude as the saturation vapor
pressures at the observed seasonal temperatures. (See page .)
Diurnal Variation of Humidity . Table XXII shows the diurnal variation
of relative humidity as observed on the Fram in South Ellesmere Land.
Average humidity is highest between midnight and 0400h and lowest between
noon and 1600h in all months except January, when the diurnal maxima and
minima are reversed. The January reversal in humidity appears to correspond
to a similar reversal in the diurnal temperature variation during this month
at most stations on the Arctic Ocean and in the Canadian Archipelago.
Sverdrup [ 43 ] found the diurnal variation in humidity to be very small
over the pack-ice but the hours of maxima and minima appear to correspond
quite closely to those recorded at the coast by the Fram .
223 | Vol_VII-0229
Table XXII . Diurnal range in relative humidity (%) in South
Ellesmere Land, 1898-1902Hour 2h 4h 6h 8h 10h 12h 14h 16h 18h 20h 22h 24h Ra.* Jan 83.0 83.0 83.4 83.1 83.1 83.3 83.3 83.7 83.6 83.3 83.1 83.1 0.7 Feb 85.1 84.8 84.3 84.4 84.3 84.0 83.8 83.7 84.6 84.8 84.8 84.4 1.4 Mar 80.6 81.0 80.9 80.6 80.6 79.3 79.0 79.6 79.7 80.3 80.3 80.1 2.0 Apr 83.5 83.0 82.5 81.0 79.5 78.6 78.5 78.4 79.2 81.2 82.8 83.4 5.1 May 82.1 81.3 79.6 78.7 77.4 76.1 76.3 76.8 77.8 79.0 80.2 81.4 6.0 Jun 82.2 81.9 80.8 79.4 78.2 76.8 78.2 75.9 77.4 78.5 79.9 82.0 6.3 Jul 84.4 84.4 84.6 83.4 82.4 80.5 79.1 79.1 79.7 81.3 82.6 84.1 5.7 Aug 89.3 89.4 89.1 89.3 86.9 85.2 84.3 82.6 85.2 86.4 88.0 88.7 6.8 Sep 86.3 86.7 85.2 84.0 83.3 83.0 83.0 83.6 85.8 86.4 85.7 86.3 3.7 Oct 82.3 81.7 81.5 80.6 81.2 80.0 80.5 80.2 82.5 82.3 82.8 83.0 3.0 Nov 81.7 81.4 81.7 81.4 81.9 81.2 80.6 80.9 80.5 80.8 81.1 81.2 1.4 Dec 84.1 84.3 83.8 83.8 84.0 83.4 83.3 83.2 83.8 83.6 83.6 84.2 1.1
*Mean diurnal range.
224 | Vol_VII-0230
Sverdrup also found that the vapor pressure in the surface air over
the pack-ice has a regular diurnal variation in all months in which the
relative humidity varies regularly but that the phase is reversed. (See
Fig. 50 .) The maximum vapor pressure occurs at the hour of minimum
relative humidity and the minimum vapor pressure occurs near midnight fig. 50 here
when the relative humidity is at its maximum.table xxiii here
Non-Periodic Variations in Humidity . While the annual and diurnal variations
in the actual moisture content of the atmosphere are quite considerable over
the Arctic, the corresponding variations in relative humidity are very
slight. The principal variations in relative humidity appear to be non–
periodic in nature and the result of several causative factors. In some
coastal areas and in regions which exhibit a local diversity in the character
of the land surface, large changes in humidity can accompany rapid changes
in wind direction. This is particularly true during summer along the coasts
of the Polar Sea, where a sudden change in the wind from an offshore to an
onshore direction will produce an immediate rise in relative humidity. This
change is primarily caused by the sudden change in temperature (see page )
rather than by any large difference in the actual moisture content between
225 | Vol_VII-0231
Table XXIII. Diurnal variation of relative humidity (%)
(with respect to water)Station Mar Apr May Jun Jul Aug Sep Oct Nov Dec Ayon Island (69°52′N., 167°52′E.) Mean 82.8 86.9 83.7 86.0 84.2 Max. 83.9 88.7 89.0 86.7 84.5 Hour of Max. 0100 0200 0400 1900 0800 Min. 81.2 84.8 79.1 85.5 84.0 Hour of Min. 1500 1600 1200 1200 0100 Amplitude 2.72 3.84 8.95 1.20 0.56 Cape Serdze Kamen (66°53′N., 188°22′E.) Mean 79.4 84.5 86.4 91.1* 90.7 86.6 83.0 Max. 80.0 86.6 91.1 93.1* 92.1 89.0 84.5 Hour of Max. 0700 0200 2400 0100* 2200 0400 2400 Min. 78.4 82.2 81.7 89.3* 88.8 84.7 81.8 Hour of Min. 1200 1300 1100 1000* 1500 1300 0700 Amplitude 1.59 4.45 9.39 3.80* 3.31 4.31 2.75 Pack Ice 1922 (Approx. 71°N., 185°E.) Mean 95.0 95.4 84.5 Max. 97.0 96.1 85.2 Hour of Max. 2300 0800 1500 Min. 91.3 91.7 84.1 Hour of Min. 1500 1400 2300 Amplitude 5.66 1.35 1.12
* Four Pillar Island (74°43′N., 165°25′E.)
226 | Vol_VII-0232
Table XXIII. Diurnal variation of relative humidity (%)
(with respect to water) (cont.)Station Mar Apr May Jun Jul Aug Sep Oct Nov Dec Pack ice 1923 (Approx. 75.5°N., 165°E.) Mean 95.5 97.0 97.3 91.1 86.0 Max. 97.7 98.3 98.2 91.5 86.3 Hour of Max. 0200 0100 0600 2000 0300 Min. 93.5 95.7 95.8 90.1 85.7 Hour of Min. 1600 0900 1300 1400 1100 Amplitude 4.17 2.60 2.38 1.40 0.63 Pack Ice 1924 (Approx. 76.5°N., 145°E.) Mean 81.8 91.3 94.7 Max. 83.4 92.7 96.1 Hour of Max. 0200 0100 2300 Min. 79.7 89.7 92.5 Hour of Min. 1300 1400 1100 Amplitude 2.73 3.06 3.60
227 | Vol_VII-0233
offshore and onshore winds. Large variations in relative humidity can
also occur with increases in the wind to speeds which are sufficient to
break down the surface temperature inversion or upon the initiation of
winds which exhibit a considerable dynamical heating because they possess
a large downslope component.At lower latitudes in the Arctic the changes in air mass accompanying
frontal passages are probably the most important among the several factors
which account for rapid and sizeable changes in the atmospheric moisture
content. Such changes in air mass are reflected in the observations by
corresponding changes in both the specific humidity (vapor pressure) and
the relative humidity terms.
228 | Vol_VII-0234
CLOUDINESS AND CEILINGS
The general character of cloud cover over the Arctic differs
considerably from that considered typical for most temperate regions.
The uniform and contourless stratus clouds which are by far the most
frequent type observed give to the Arctic its reputation for a dull and
monotonous appearance. Over the Arctic Ocean during summer the low
stratus type of cloud constitutes from 70 to 80 percent of all clouds
observed. In winter and spring they are not so frequent, but they still
constitute from 45 to 60 percent of all cloud types present. Along the
coast in more southerly locations, the stratus clouds are proportionately
less frequent. In these regions the cloud decks tend to be more often
broken up by convective currents, with a resulting increase in the
proportion of stratocumulus cloud reported.Sverdrup [ 43 ] has shown that there is no direct relation between
air temperature and the occurrence of stratus over the maritime Arctic
regions. However, he does show that the occurrence of low stratus is
closely associated with the presence of a surface temperature inversion.
229 | Vol_VII-0235
Along the coasts of the Arctic Ocean in summer the surface inversion
exists only when there is an onshore wind, but with offshore winds and
when the temperature is high at the ground, the temperature decreases
regularly with altitude. Conditions are then unfavorable for the
formation of low cloud. These processes probably account for the
secondary minimum in cloudiness that is observable during one or more
of the summer months at a number of Arctic coastal stations (see Table XXIV ).table XXIV here
Over nearly all of the Arctic cloudiness is most extensive in summer
and autumn and least extensive in winter and spring. Over the Arctic
Ocean during summer the low stratus overcast may persist for weeks at a
time without once offering a glimpse of blue sky or upper cloud. Days
with clear sky occur rarely if ever. It is significant to note that
average sky conditions computed from observations on both the Fram and
the Maud indicate that no clear days (cloudiness, 2-tenths or less) are
to be expected during any of the months from June through August.tables XXV to XXVII here
The Arctic Ocean proper and those adjacent coastal regions with a
preponderance of onshore winds show a maximum cloud cover in midsummer.
Those localities more often subject to offshore winds present a maximum
230 | Vol_VII-0236
Table XXIV . Mean monthly cloudiness (%) Jan Feb Mar Apr May Jun Jul Aug Sep Oct Nov Dec Ann Yrs Rec Oceanic: 002 36 41 56 48 76 87 91 85 91 63 39 36 62 2⅓ 003 36 42 34 47 73 85 88 88 82 80 51 40 62 2 004 84 83 79 83 82 84 90 85 81 83 83 81 83 … 005 82 80 82 86 90 89 87 89 90 86 86 81 86 4 006 60 69 52 56 82 82 84 88 89 83 62 49 71 4 007 68 62 50 64 90 95 88 92 95 82 74 65 78 5 008 53 .. .. .. .. .. 82 82 80 65 50 57 .. 0-1 Alaska, Coastal and Insular: 100 47 57 53 53 80 80 83 97 90 91 70 60 70 2½ 102 53 53 57 57 70 67 73 87 73 77 53 63 63 2½ 104 54 52 50 64 62 62 79 75 68 70 52 58 62 10 105 52 53 49 50 69 63 66 75 72 69 61 50 61 10 106 70 60 50 63 83 70 70 77 80 87 70 67 67 8 Alaska, Inland: 150 53 47 70 57 67 70 70 87 73 70 53 70 63 2½ 151 63 53 67 57 80 77 73 87 87 87 80 80 73 2 152 40 47 70 40 60 57 53 73 77 70 47 43 57 2 153 44 43 42 37 40 41 45 52 57 60 50 40 46 10 154 60 47 57 77 80 80 87 83 80 77 63 70 70 2½ 156 63 53 60 60 70 70 70 73 80 80 57 60 63 7 157 48 50 54 56 61 56 62 68 72 66 57 48 58 10 Canada, Coastal and Insular: 201 34 28 50 35 60 66 70 78 63 44 28 36 49 2 202 20 41 34 45 62 66 62 78 81 57 33 33 51 2-5
231 | Vol_VII-0237
Table XXIV . Mean monthly cloudiness (%) (cont.) Jan Feb Mar Apr May Jun Jul Aug Sep Oct Nov Dec Ann Yrs Rec Canada, Coastal and Insular (cont.): 204 39 42 50 54 60 72 62 76 78 70 56 34 58 3 213 36 36 40 30 48 58 48 60 70 76 52 30 49 5 216 46 46 45 53 62 58 58 74 78 68 56 47 58 6 217 30 26 29 36 74 58 48 82 79 67 40 .. .. 1 218 32 25 27 42 68 69 58 68 83 68 56 27 52 2 220 50 55 64 62 70 82 80 78 84 71 74 58 69 … 223 49 48 55 66 81 76 60 68 79 85 76 52 66 8-11 224 48 50 48 57 67 68 64 51 64 70 65 51 59 2 226 36 44 26 50 64 56 62 65 63 66 40 53 53 2 227 68 63 68 74 80 74 70 67 74 79 85 76 73 6 228 45 52 38 53 56 52 50 48 59 68 56 50 52 5 Canada, Inland: 250 41 42 43 44 45 51 60 74 70 67 58 49 54 8 252 57 49 44 48 49 53 58 58 59 63 62 63 55 15 253 70 70 75 57 66 76 86 65 78 69 81 71 71 … 254 44 44 38 44 46 42 43 51 63 64 53 41 48 … 257 37 34 38 46 48 49 56 62 62 70 58 46 50 4 259 52 47 49 45 54 50 45 44 66 67 62 47 52 18 260 43 47 39 41 50 41 58 56 66 73 67 51 53 … Greenland, Iceland, Coastal and Insular: 301 37 46 62 42 .. 66 69 65 68 59 60 36 62 5 302 47 47 40 57 63 60 70 60 67 67 63 43 57 2 303 63 44 50 32 43 52 51 48 48 46 56 54 49 …
232 | Vol_VII-0238
Table XXIV . Mean monthly cloudiness (%) (cont.) Jan Feb Mar Apr May Jun Jul Aug Sep Oct Nov Dec Ann Yrs Rec Greenland, Iceland, Coastal and Insular (cont.): 304 49 45 47 54 66 72 66 68 68 70 71 62 62 31 307 42 48 50 41 50 64 60 65 56 49 56 49 52 … 308 59 71 50 68 53 58 51 55 51 54 53 62 57 … 310* 73 68 67 71 71 71 69 71 72 73 76 76 71 15 314 75 72 69 70 68 69 66 70 70 69 68 67 69 31 317 67 61 61 61 63 62 56 54 63 68 67 66 62 30 318 64 63 59 58 60 61 59 62 62 61 58 58 61 29 320 68 68 64 62 64 66 64 68 64 63 64 64 65 2 330 73 74 70 70 60 63 68 72 74 72 72 71 70 16 331 67 68 71 62 65 71 72 72 66 67 66 67 68 10 332 78 78 76 77 74 78 81 86 80 72 70 79 77 9 333 76 73 74 72 78 74 78 75 79 68 74 76 75 11 334 73 70 71 71 66 66 73 73 70 77 77 74 72 14 335 68 64 64 70 64 71 76 80 74 76 69 66 70 … 336 75 74 75 74 70 72 74 79 75 79 72 72 74 20 337 67 67 66 67 74 72 78 75 74 62 69 66 70 11 339 85 80 84 84 80 82 85 83 83 86 84 82 83 10 340 66 67 69 69 71 69 75 76 72 72 66 65 70 18 341 71 70 79 72 71 68 82 69 76 73 75 67 73 8 Greenland, Iceland, Inland: 351 66 49 54 60 61 54 77 60 53 54 52 57 58 1 360 73 70 70 76 79 74 78 80 78 75 75 74 75 7 361 75 71 72 75 68 70 74 79 75 81 74 73 74 15
* - Data for Agto, 67° 57′ N., 53° 44′W.
233 | Vol_VII-0239
Table XXIV . Mean monthly cloudiness (%) (cont.) Jan Feb Mar Apr May Jun Jul Aug Sep Oct Nov Dec Ann Yrs Rec Europe, Coastal and Insular: 400 70 67 61 71 86 85 87 92 92 90 73 64 78 10 401 64 56 52 76 87 91 91 96 82 85 67 72 77 4 403 62 59 58 56 66 75 70 73 76 72 61 59 66 14 406 70 73 73 74 75 73 69 69 77 73 74 65 72 … 407 70 70 75 74 77 74 68 73 82 75 74 69 73 10 408 76 74 72 71 76 74 72 75 77 77 80 77 75 44 410 78 76 72 68 68 69 71 69 75 75 77 76 73 … 412 65 63 58 55 58 59 61 59 67 66 65 59 61 44 414 65 64 60 62 68 68 66 67 76 70 70 60 66 … 415 70 70 60 69 72 68 75 77 77 81 77 76 73 10 417 82 77 73 81 89 83 80 83 84 86 86 85 82 7 420 72 71 68 65 66 68 70 70 75 71 71 68 70 … 421 62 60 59 56 55 50 53 68 61 63 60 69 59 20 423 66 62 55 54 61 55 57 62 63 68 70 71 62 20 424 80 75 67 64 58 55 53 62 63 74 81 83 68 … 425 73 70 67 68 75 66 64 72 75 77 82 75 72 21 426 84 78 68 62 60 60 61 64 69 79 83 88 71 10 428 88 87 83 76 73 68 74 80 85 87 90 89 82 25 429 79 82 73 75 79 69 73 78 82 85 86 78 78 13 Europe, Inland: 450 62 57 54 56 68 64 68 72 69 68 66 67 64 … 451 66 63 61 64 70 66 66 71 73 71 70 66 67 44 453 76 65 61 71 67 66 67 70 71 80 79 76 71 9
234 | Vol_VII-0240
Table XXIV . Mean monthly cloudiness (%) (cont.) Jan Feb Mar Apr May Jun Jul Aug Sep Oct Nov Dec Ann Yrs Rec Europe, Inland (cont.): 454 77 76 73 71 73 73 77 79 79 77 77 75 76 44 455 66 62 56 54 52 52 55 56 56 63 66 69 59 … 456 66 59 59 59 63 60 65 68 69 72 71 70 65 20 457 76 70 60 59 55 56 53 61 62 75 82 81 66 36 458 76 71 64 62 61 63 59 66 70 78 84 82 70 35 Asia, Coastal and Insular: 500 63 61 63 77 89 91 85 89 91 92 81 69 79 8 501 57 47 46 62 81 88 80 89 89 80 58 62 70 5 502 58 53 60 59 81 84 80 94 88 78 58 57 70 4 503 57 60 46 63 86 87 86 93 90 85 64 55 73 7 504** 30 45 34 62 71 85 84 95 90 81 66 44 66 2½ 505 80 77 71 73 82 76 75 81 84 82 83 75 78 14 506 76 68 61 70 82 81 71 80 83 85 81 74 76 14 507 69 69 65 68 80 75 70 78 82 83 80 72 74 16 508 68 64 60 67 86 82 79 90 90 88 80 70 77 6 509 71 66 61 68 86 84 79 92 88 85 72 62 76 7 510 65 69 59 70 85 91 81 90 88 85 75 64 77 18 511 40 36 32 53 77 80 76 85 90 72 60 51 63 1½ 513 40 48 43 53 66 71 73 79 78 70 55 50 60 7 515 34 36 33 36 65 76 68 78 85 73 60 46 58 9 517 55 58 50 54 79 74 72 79 81 74 67 64 67 9 518 74 67 66 72 88 83 76 82 88 87 87 79 79 26 519 69 64 57 69 84 80 68 81 86 86 88 80 76 22
** - Data from station approximately 75° N., 147° E.
235 | Vol_VII-0241
Table XXIV. Mean monthly cloudiness (%) (cont.) Jan Feb Mar Apr May Jun Jul Aug Sep Oct Nov Dec Ann Yrs Rec Asia, Coastal and Insular (cont.): 520 63 65 59 62 72 75 68 75 79 80 70 67 70 33 521 64 59 59 68 84 78 72 79 81 83 76 66 72 13 522 47 43 40 46 54 53 61 70 73 65 65 51 56 3-6 523 57 69 68 60 77 84 80 86 91 83 78 75 76 3 525 53 64 61 74 86 74 77 82 85 79 78 63 73 10 526 55 53 53 64 68 73 76 72 67 70 64 56 64 14 527 52 63 54 55 68 69 75 74 72 71 65 60 65 14 531 64 59 62 53 73 77 79 67 56 64 68 62 65 4 Asia, Inland: 551 42 54 49 64 80 74 74 77 81 79 55 48 65 3 552 60 46 56 63 68 75 79 79 81 90 73 59 69 12 553 64 66 65 64 77 80 70 83 84 86 71 62 73 18 554 65 70 59 69 75 81 70 75 85 82 72 65 72 17 555 71 58 68 58 67 75 64 74 80 85 76 56 69 4 556 34 31 33 48 61 64 64 66 66 64 46 39 51 33 557 52 54 29 36 40 64 64 68 74 71 65 48 55 4 558 40 42 32 34 51 57 62 72 70 68 54 48 53 9 559 53 48 44 52 63 65 61 75 74 71 62 56 60 10 560 67 54 52 51 67 62 58 65 69 70 65 62 62 11 561 55 49 43 47 60 58 55 61 67 69 68 61 58 9 562 66 59 54 58 70 69 62 68 72 80 72 69 67 24 563 63 60 58 59 68 68 63 70 79 81 70 63 67 46 564 59 64 63 67 75 75 73 76 77 81 72 62 70 5 565 61 51 58 67 79 60 50 53 67 78 69 70 64 13 566 56 60 49 53 68 65 58 63 70 74 63 68 63 23
236 | Vol_VII-0242
Table XXIV. Mean monthly cloudiness (%) (cont.) Jan Feb Mar Apr May Jun Jul Aug Sep Oct Nov Dec Ann Yrs Rec Asia, Inland (cont.): 567 66 63 56 65 72 71 67 69 75 79 70 63 68 25 568 52 45 37 49 59 56 56 60 63 73 61 56 56 30 569 34 41 41 57 69 63 50 67 69 68 54 34 54 1 570 23 20 24 34 46 38 36 42 48 59 42 22 36 16 572 53 54 50 56 67 65 68 71 71 72 65 56 62 21 573 64 65 58 56 61 65 60 62 67 71 76 71 65 9 574 67 58 57 56 65 64 58 64 63 78 75 65 64 20 575 61 57 60 64 68 63 62 65 71 76 75 65 66 18 576 73 64 58 63 67 67 68 68 74 75 79 77 69 13
237 | Vol_VII-0243
Table XXV. Mean number of clear days Station Jan Feb Mar Apr May Jun Jul Aug Sep Oct Nov Dec Ann Yrs Rec Oceanic: 002 g 14 12 9 8 7 0 0 0 0 4 11 15 80 2 1/2 003 g 14 9 12 10 2 0 0 0 1 1 7 9 65 2 004 g * * 1 0 * * * * 0 * * * 2 … 005 c 1 1 1 1 * 1 * * * 0 0 1 6 … 006 c 6 2 7 6 1 2 2 1 1 1 6 9 43 4 117 c 5 3 8 5 * 0 1 1 0 * 2 5 31 5 Alaska, Coastal and Insular: 100 g 17 18 18 14 7 9 8 4 4 6 12 13 130 10 102 g 15 13 15 12 12 13 7 6 7 8 11 12 132 11-13 104 g 10 11 12 9 9 8 5 4 6 7 10 11 102 19 105 g 13 8 7 4 5 8 3 4 3 2 2 2 61 2-4 106 g 9 8 10 9 7 8 6 4 6 6 7 9 89 24-26 Alaska, Inland: 152 g 15 14 18 16 12 10 4 5 6 7 15 15 137 8-10 153 g 15 16 17 18 15 15 15 11 10 9 10 13 164 10 154 g 11 10 12 9 6 9 4 5 5 7 11 11 100 18-19 156 g 10 9 11 10 4 4 5 3 4 5 8 11 84 10 157 g 12 10 10 10 6 8 7 6 5 7 8 12 101 10 Canada, Coastal and Insular: 201 c 16 14 8 12 5 4 4 1 4 12 17 16 113 2 202 c 20 11 13 9 6 5 6 1 1 7 15 14 108 3 204 c 16 13 13 9 8 6 8 4 3 7 11 18 117 3-5
c – 2-tenths of less total cloud cover. g – Undefined. * - Less than 0.5 day.
238 | Vol_VII-0244
Table XXV. Mean number of clear days (cont.) Station Jan Feb Mar Apr May Jun Jul Aug Sep Oct Nov Dec Ann Yrs Rec Canada, Coastal and Insular (cont.): 213 c 17 21 20 20 15 13 14 6 6 7 12 16 168 3-5 220 g 14 16 16 8 4 4 6 2 0 2 5 10 87 2 223 g 11 12 12 6 5 4 9 6 3 3 5 14 90 5-7 224 g 15 18 19 10 5 5 6 10 4 6 7 12 116 4-5 226 c 13 18 17 15 7 6 6 7 4 9 7 18 125 2 227 c 11 7 7 6 4 6 6 10 4 5 6 8 80 2-5 Canada, Inland: 250 c 16 13 20 13 10 12 8 6 4 7 13 15 136 2-4 Greenland and Iceland, Coastal and Insular: 301 g 13 10 3 .. .. 4 4 2 2 4 5 9 .. 0-3 302 g 12 11 16 11 8 9 6 10 6 7 8 15 119 2 304 g 9 10 10 8 5 3 5 5 4 3 3 6 71 31 307 g 12 10 9 11 8 5 6 4 4 9 4 11 93 … 308 g 7 2 8 7 7 6 7 5 7 7 8 7 78 19 310** g 1 2 2 1 2 2 2 1 1 1 1 2 18 15 314 g 1 1 2 2 3 2 2 2 2 3 2 2 24 31 317 g 4 4 5 6 6 6 6 8 6 4 4 5 64 30 318 g 5 7 7 9 9 7 8 7 7 7 7 7 87 28 320 g 2 2 4 3 4 2 3 2 3 4 4 3 35 19 330 g 2 2 3 2 5 4 4 3 2 2 2 3 32 16 331 g 2 2 2 2 2 1 2 1 1 1 2 2 20 16 332 g 1 1 1 1 2 1 1 * 1 * 1 * 10 16
c – 2-tenths of less total cloud cover. g – Undefined. * - Less than 0.5 day. ** - Data for Agto, 67° 57' N., 53° 44' W.
239 | Vol_VII-0245
Table XXV. Mean number of clear days (cont.) Station Jan Feb Mar Apr May Jun Jul Aug Sep Oct Nov Dec Ann Yrs Rec Greenland and Iceland, Coastal and Insular (cont.) 333 g 1 2 2 2 11 1 1 1 2 2 1 1 16 11 334 g 1 1 2 1 2 2 1 1 1 * * 1 13 14 335 g 3 4 4 3 5 3 2 1 2 3 3 3 34 15 336 g 1 1 1 2 3 2 1 1 1 1 2 1 17 16 337 g 3 2 3 3 1 2 1 * 1 2 2 2 22 11 339 g * 1 1 1 * * * 0 * * * 1 4 10 340 g 4 3 2 3 3 3 1 1 1 1 3 4 30 14 341 g 7 3 2 3 4 4 1 4 2 2 2 5 39 8 Greenland and Iceland, Inland: 360 g 4 3 1 2 1 2 2 1 1 3 2 2 24 7 361 g 1 1 2 2 2 2 1 1 1 * 1 1 15 16 Europe, Coastal and Insular: 400 c 3 3 6 3 1 1 1 * 0 * 3 6 28 10 401 c 4 5 7 2 1 1 1 0 0 0 2 8 30 4 403 c 6 6 7 7 4 3 3 2 2 3 6 7 56 … 406 a 3 3 3 3 3 3 4 4 1 2 2 4 35 12 407 c 1 1 1 1 1 1 3 2 0 1 1 2 15 10 408 a 2 2 3 2 2 2 2 2 1 1 1 0 22 29 412 a 3 5 5 4 5 6 5 3 3 4 3 4 50 28 414 c 5 4 6 5 5 5 5 4 3 4 4 7 57 25 415 c 1 1 3 2 1 2 1 * * 1 1 1 14 18
a – Less than 1-tenth total cloud cover. c – 2-tenths of less total cloud cover. g – Undefined. * - Less than 0.5 day.
240 | Vol_VII-0246
Table XXV. Mean number of clear days (cont.) Station Jan Feb Mar Apr May Jun Jul Aug Sep Oct Nov Dec Ann Yrs Rec Europe, Coastal and Insular (cont.): 417 c 1 2 1 1 0 1 2 0 1 0 0 1 10 7 420 c 4 5 5 5 5 5 4 3 2 3 3 3 47 27 421 c 11 7 8 10 12 11 10 7 10 6 6 5 103 8 423 c 4 5 6 5 4 5 6 4 4 4 2 3 52 8 424 c 2 2 5 4 5 5 5 3 3 2 2 2 40 36 425 c 4 3 5 5 3 4 3 1 3 2 2 2 35 13 426 c 2 2 4 5 4 4 4 2 3 2 1 1 33 18 428 c 1 2 3 3 1 3 1 1 1 1 1 1 19 18 429 c 4 2 3 3 1 3 2 1 1 1 1 2 21 13 Europe, Inland: 450 c 5 4 5 6 4 2 3 4 2 4 2 4 45 8 451 a 3 3 4 3 2 3 3 2 1 2 2 3 31 18 453 c 3 3 4 3 3 3 2 2 1 1 1 2 28 9 454 c 2 2 3 3 2 2 1 1 1 2 2 2 23 31 455 c 7 6 6 9 10 8 8 5 6 5 4 2 76 8 456 c 5 4 5 5 5 4 5 4 3 3 3 4 50 8 457 c 3 3 6 6 5 5 5 4 4 2 1 2 46 36 458 c 2 3 5 5 3 3 4 3 2 2 1 1 34 35 Asia, Coastal and Insular: 500 c 4 3 4 2 * * 2 1 * * 2 4 21 8 501 c 7 7 9 5 2 * 2 1 * 2 7 5 46 5 502 c 8 6 6 6 1 1 2 1 * 2 5 6 43 4
a – Less than 1-tenth total cloud cover. c – 2-tenths of less total cloud cover. * - Less than 0.5 day.
241 | Vol_VII-0247
Table XXV. Mean number of clear days (cont.) Station Jan Feb Mar Apr May Jun Jul Aug Sep Oct Nov Dec Ann Yrs Rec Asia, Coastal and Insular (cont.): 503 c 7 4 8 5 1 * 1 0 1 1 5 7 40 7 505 b 2 2 2 2 2 3 3 1 0 1 3 2 24 13 506 c 3 4 5 2 1 2 3 1 0 1 1 2 25 14 507 c 3 3 3 4 2 3 3 2 1 1 1 2 26 16 508 c 3 3 5 3 1 1 2 * * 1 1 3 23 6 509 c 4 3 5 3 * 1 1 0 * 1 2 6 26 7 510 c 5 4 5 4 1 * 2 * * 1 2 5 29 18 511 c 15 15 17 11 5 4 5 2 2 6 7 13 102 2-3 512 g 6 7 12 10 6 4 7 5 2 4 5 13 81 2-3 513 c 13 8 12 8 4 3 2 1 2 3 6 7 69 4 514 c 11 12 14 10 6 4 5 2 3 2 8 10 86 11 515 c 17 14 15 13 4 2 4 2 1 3 7 11 93 5 516 c 16 11 9 12 7 7 6 5 3 6 9 8 98 4 517 c 6 4 6 5 2 2 1 0 1 1 2 4 34 9 518 c 3 4 4 3 0 1 2 1 * 1 1 3 21 26 519 c 3 4 6 3 1 1 3 1 0 * 2 3 27 22 520 g 4 3 4 3 2 2 3 2 1 1 2 4 31 10 521 c 4 4 6 3 1 2 2 1 * 1 2 5 33 13 522 c 10 9 11 9 7 5 5 2 3 3 3 8 75 4 523 c 8 6 7 6 2 2 2 1 1 1 2 3 41 3 525 c 6 6 5 2 1 1 2 1 1 2 2 5 34 8
b – 1-tenths or less total cloud cover. c – 2-tenths of less total cloud cover. g – Undefined. * - Less than 0.5 day.
242 | Vol_VII-0248
Table XXV. Mean number of clear days (cont.) Station Jan Feb Mar Apr May Jun Jul Aug Sep Oct Nov Dec Ann Yrs Rec Asia, Coastal and Insular (cont.): 526 c 7 6 8 4 3 2 1 2 3 3 4 6 48 13 527 c 8 17 10 12 7 10 5 6 4 12 11 11 110 4 531 c 3 3 4 6 1 1 1 3 5 5 2 2 35 4 Asia, Inland: 551 d 3 9 18 7 7 3 4 1 3 5 8 12 81 2 552 c 11 12 12 10 8 5 5 6 4 3 7 11 94 20 553 c 6 5 5 4 2 1 3 1 1 2 4 7 40 18 554 c 11 4 13 6 5 2 4 6 1 3 6 11 72 3 555 g 2 6 4 8 6 1 4 2 1 1 3 7 45 4 556 c 12 11 12 9 4 2 3 2 3 5 9 9 81 8 557 c 10 6 8 7 4 3 1 2 2 3 4 6 56 14 558 c 14 11 13 15 8 5 5 2 3 4 8 10 98 9 559 c 6 7 7 5 1 5 3 * 2 2 3 3 44 4 560 c 10 10 11 9 7 4 6 5 5 7 9 10 93 8 561 d 8 9 12 9 8 9 9 7 5 6 8 9 99 6 562 c 5 3 5 6 3 2 3 3 1 2 3 3 39 … 563 c 6 6 7 7 4 3 3 3 2 2 5 6 54 11 566 c 5 1 4 4 1 2 5 3 2 1 3 4 35 8 567 c 5 5 9 6 3 2 2 3 3 2 4 8 50 11 568 c 10 9 14 9 5 5 5 5 5 3 6 7 86 24 570 c 19 19 17 14 7 11 10 11 9 6 8 17 148 8
c – 2-tenths or less total cloud cover. d – 3-tenths or less total cloud cover. g – Undefined. * - Less than 0.5 day.
243 | Vol_VII-0249
Table XXV. Mean number of clear days (cont.) Station Jan Feb Mar Apr May Jun Jul Aug Sep Oct Nov Dec Ann Yrs Rec Asia, Inland (cont.): 572 c 9 8 9 7 4 3 2 3 2 4 5 6 53 10 573 c 9 11 13 11 8 7 8 7 7 6 7 7 101 9 574 d 9 13 11 9 6 9 10 7 5 5 5 6 95 6 575 c 6 6 6 4 3 3 4 3 2 2 3 5 47 18 576 c 3 3 6 4 3 3 3 2 2 3 1 2 35 13
244 | Vol_VII-0250
Table XXVI. Mean number of partly cloudy days Station Jan Feb Mar Apr May Jun Jul Aug Sep Oct Nov Dec Ann Yrs Rec Oceanic: 002 g 9 10 8 13 6 4 4 7 3 15 13 10 102 2 1/2 003 g 13 13 16 12 13 14 9 5 9 23 19 18 164 2 004 g 10 8 13 10 13 9 7 9 11 11 11 13 125 … 005 c 13 11 12 9 7 7 8 8 5 11 12 13 116 … 006 c 16 17 16 15 11 8 7 8 6 10 14 14 144 4 007 c 12 16 16 13 6 4 6 3 3 7 13 12 109 5 Alaska, Coastal and Insular: 100 g 4 4 5 5 5 7 7 6 5 6 5 5 64 10 102 g 5 5 6 7 9 8 5 7 8 7 5 5 77 11-13 104 g 7 6 6 7 10 9 7 8 8 8 6 5 87 19 105 g 5 5 5 4 4 6 4 4 5 6 8 9 67 2-4 106 g 8 7 7 8 11 10 9 9 9 9 7 7 101 24-26 Alaska, Inland: 152 g 6 6 5 7 11 13 13 10 8 7 4 6 95 8-10 153 g 5 3 5 5 8 8 8 8 7 4 5 5 71 10 154 g 6 5 7 7 9 8 6 7 7 7 6 6 81 18-19 156 g 6 6 7 9 11 14 9 6 7 6 6 6 96 10 157 g 4 4 6 5 7 6 6 5 5 4 5 5 62 10 Canada, Coastal and Insular: 201 d 11 12 17 15 14 11 19 14 15 12 10 11 151 2 202 d 9 11 15 15 11 11 11 11 11 13 12 13 143 3 204 d 4 6 7 9 9 8 9 6 7 6 5 4 79 3-5
c – 3- to 8-tenths total cloud cover. d – 3- to 7-tenths total cloud cover. g – Undefined.
245 | Vol_VII-0251
Table XXVI. Mean number of partly cloudy days (cont.) Station Jan Feb Mar Apr May Jun Jul Aug Sep Oct Nov Dec Ann Yrs Rec Canada, Coastal and Insular (cont.): 213 d 3 3 5 3 5 4 4 6 5 4 4 5 52 3-5 218 d 12 12 14 14 13 10 17 16 10 16 13 20 167 2 223 d 10 6 7 8 5 5 7 6 6 6 5 7 76 5-7 224 d 4 3 2 5 5 4 5 8 4 5 5 3 52 4-5 226 d 6 6 4 5 7 8 7 8 4 5 7 5 71 2 227 d 8 7 8 7 6 5 7 7 6 6 4 7 77 2-5 Canada, Inland: 250 d 4 5 4 4 8 6 9 8 6 4 2 5 61 2-4 Greenland and Iceland, Coastal and Insular: 301 g 12 12 3 .. .. 11 17 14 16 17 14 18 .. 1-3 302 g 5 5 5 3 4 5 5 4 7 6 4 4 57 2 304 g 13 11 13 12 12 11 12 11 11 13 13 12 144 31 307 g 11 10 14 14 14 13 13 17 20 14 20 10 170 … 308 g 12 12 14 13 13 14 15 19 15 14 12 11 164 19 310* g 16 14 16 16 15 14 16 16 16 16 14 12 181 15 314 g 15 15 16 16 15 16 17 15 15 14 15 17 186 31 317 g 14 13 14 13 13 13 16 14 14 14 13 14 165 30 318 g 13 9 12 10 12 12 11 11 12 11 11 14 138 28 320 g 16 15 15 16 17 17 17 16 16 15 14 18 192 19 330 g 14 12 13 15 15 15 13 12 13 14 13 13 163 16 331 g 15 12 14 13 17 15 14 15 16 19 15 15 100 16 332 g 13 11 13 11 15 13 10 10 11 12 12 15 146 16
d - 3- to 7-tenths total cloud cover. g - Undefined. * - Data for Agto, 67° 57′ N., 53° 44′ W.
246 | Vol_VII-0252
Table XXVI. Mean number of partly cloudy days (cont.) Station Jan Feb Mar Apr May Jun Jul Aug Sep Oct Nov Dec Ann Yrs Rec Greenland and Iceland, Coastal and Insular (cont.): 333 g 12 11 12 12 14 14 12 13 11 15 15 13 154 11 334 g 16 16 15 17 18 16 15 17 17 16 16 16 194 14 335 g 14 13 13 12 13 12 12 11 11 11 13 15 151 15 336 g 16 14 12 12 14 13 14 11 13 11 14 16 157 16 337 g 15 15 15 15 15 14 13 14 13 16 15 14 174 11 339 g 10 10 9 8 13 12 9 12 11 10 10 12 125 10 340 g 15 13 15 12 13 13 14 14 15 15 15 15 169 14 341 g 8 11 9 11 11 11 9 10 11 12 11 10 124 8 Greenland and Iceland, Inland: 360 g 9 10 13 10 10 13 11 11 11 11 12 13 134 7 361 g 15 16 15 13 16 15 15 13 15 13 15 17 178 16 Europe, Coastal and Insular: 400 d 13 13 13 13 7 7 7 5 5 8 11 12 114 10 401 d 16 14 17 12 6 4 5 4 6 10 16 14 124 4 403 d 12 10 13 13 14 10 12 12 12 12 12 13 145 … 406 a 13 10 11 10 10 10 11 12 12 13 12 14 138 12 407 d 17 16 14 14 13 14 15 14 12 16 15 17 177 10 408 a 13 13 14 13 11 12 13 12 14 13 12 12 152 29 412 a 14 11 14 15 16 14 14 16 13 14 12 13 166 28 414 d 12 11 12 11 12 11 13 14 11 13 13 12 145 25 415 d 14 13 16 13 12 14 13 14 13 12 12 13 160 18 417 d 12 10 17 11 7 9 27 9 9 10 9 9 139 7
a - 1- to 9-tenths total cloud cover. d - 3- to 7-tenths total cloud cover. g – Undefined.
247 | Vol_VII-0253
Table XXVI. Mean number of partly cloudy days (cont.) Station Jan Feb Mar Apr May Jun Jul Aug Sep Oct Nov Dec Ann Yrs Rec Europe, Coastal and Insular (cont.): 420 d 13 11 13 13 14 14 15 14 13 14 12 13 158 27 421 d 10 10 11 11 14 14 17 16 14 12 11 8 148 8 423 d 13 9 12 15 17 15 17 15 12 9 10 8 152 8 424 g 9 10 12 14 17 17 19 18 17 12 8 7 160 36 425 d 12 11 15 14 15 17 16 16 13 12 11 11 163 13 426 d 10 9 14 13 16 17 16 18 15 11 8 8 154 18 428 d 10 10 14 13 16 15 16 14 11 10 8 10 147 18 429 d 8 9 13 10 12 14 14 14 11 9 10 10 132 13 Europe, Inland: 450 d 16 14 15 15 13 12 15 10 12 11 11 10 154 8 451 a 16 14 16 15 12 13 15 12 15 11 13 14 166 18 453 d 11 14 15 12 16 15 18 16 16 10 10 12 165 9 454 d 11 11 14 12 14 13 12 12 11 13 11 13 146 31 455 g 11 9 11 12 15 15 17 16 17 9 10 9 151 8 456 d 14 11 14 12 14 12 14 14 13 10 11 8 147 8 457 d 10 11 13 13 18 17 19 17 16 12 9 9 164 36 458 d 12 10 13 13 18 17 19 16 15 10 8 10 161 35 Asia, Coastal and Insular: 500 d 15 16 17 11 7 6 7 5 5 8 9 12 119 8 501 d 14 16 16 15 10 8 8 5 6 11 13 15 138 5 502 d 12 15 19 14 10 8 9 3 7 10 15 16 141 4 503 d 13 15 17 13 8 8 7 5 5 9 13 15 129 7
a - 1- to 9-tenths total cloud cover. d - 3- to 7-tenths total cloud cover. g – Undefined.
248 | Vol_VII-0254
Table XXVI. Mean number of partly cloudy days (cont.) Station Jan Feb Mar Apr May Jun Jul Aug Sep Oct Nov Dec Ann Yrs Rec Asia, Coastal and Insular (cont.): 505 b 12 10 14 14 9 11 13 11 9 11 9 13 136 13 506 d 11 12 15 14 10 9 12 12 8 7 7 10 127 14 507 d 14 13 17 12 11 11 13 10 10 12 12 15 150 16 508 d 14 14 15 15 9 10 10 7 6 8 12 15 136 6 509 d 11 12 15 14 9 8 12 6 7 9 13 14 131 7 510 d 12 11 16 11 8 6 8 6 7 9 12 13 119 18 511 d 4 3 5 3 3 4 2 4 3 4 4 6 45 2-3 512 g 2 3 3 4 3 3 3 2 4 4 6 4 41 2-3 513 d 4 3 4 4 4 6 6 4 5 5 5 5 55 7 514 d 3 2 3 4 3 2 3 2 2 2 2 3 30 11 515 d 9 9 13 12 13 12 12 8 5 10 9 11 123 5 516 d 9 6 8 6 9 8 6 4 3 5 5 5 77 4 517 d 18 18 18 16 11 13 16 14 14 15 17 17 187 9 518 d 12 12 15 12 8 9 12 10 7 7 8 9 123 26 519 d 14 14 17 15 9 10 15 12 10 9 10 13 149 22 520 g 12 12 16 13 10 11 14 15 13 12 12 12 152 10 521 d 17 16 16 14 9 11 15 12 13 9 11 15 156 13 522 d 14 14 17 14 16 19 16 16 12 15 17 15 185 4 523 d 15 12 11 10 11 9 10 8 6 10 12 14 128 3 525 c 15 11 16 12 10 16 11 11 8 10 8 14 142 … 526 c 15 12 13 15 13 14 13 17 15 14 16 17 174 13
b - 2- to 8-tenths total cloud cover. c - 3- to 8-tenths total cloud cover. d - 3- to 7-tenths total cloud cover. g – Undefined.
249 | Vol_VII-0255
Table XXVI. Mean number of partly cloudy days (cont.) Station Jan Feb Mar Apr May Jun Jul Aug Sep Oct Nov Dec Ann Yrs Rec Asia, Coastal and Insular (cont.): 527 e 3 1 2 2 4 3 2 2 5 3 1 1 28 4 531 a 10 6 8 6 9 8 6 4 3 5 6 6 77 4 Asia Inland: 551 c 11 4 4 6 6 3 7 5 6 5 5 2 64 2 552 d 4 4 5 5 5 5 5 4 4 2 4 4 51 20 553 d 12 10 14 15 11 11 14 9 9 6 10 11 133 18 554 d 13 7 9 10 9 12 12 10 8 9 11 13 123 3 555 g 14 12 13 12 11 13 17 14 10 7 10 14 147 4 556 d 15 13 15 13 16 15 17 15 14 14 14 16 177 8 557 c 11 9 12 13 13 14 14 13 14 13 14 13 154 14 558 c 11 11 14 10 14 16 15 13 12 14 12 15 157 9 559 d 18 13 19 18 15 14 18 12 12 17 17 15 188 4 560 e 4 2 4 4 4 7 8 6 5 4 4 3 55 8 561 f 2 1 2 3 3 4 4 2 2 1 2 2 28 6 562 d 12 16 17 16 17 18 19 19 14 13 12 13 188 … 563 d 13 11 14 13 13 15 18 14 12 9 10 12 154 11 566 d 13 17 19 17 15 17 17 16 13 14 12 15 185 8 567 d 20 15 15 14 17 17 20 17 14 13 14 18 194 11 568 d 14 13 14 15 18 19 19 17 16 16 16 15 192 24
a - 1- to 9-tenths total cloud cover. c - 3- to 8-tenths total cloud cover. d - 3- to 7-tenths total cloud cover. e - 3- to 6-tenths total cloud cover. f - 4- to 6-tenths total cloud cover. g - Undefined.
250 | Vol_VII-0256
Table XXVI. Mean number of partly cloudy days (cont.) Station Jan Feb Mar Apr May Jun Jul Aug Sep Oct Nov Dec Ann Yrs Rec Asia, Inland (cont.): 570 c 11 8 12 12 20 16 18 16 14 15 15 10 167 16 572 g 12 10 13 14 13 17 17 15 13 12 13 13 162 10 573 e 4 3 2 5 5 7 8 7 6 3 3 3 56 9 574 f 1 0 2 2 3 3 3 2 1 1 0 2 20 6 575 c 13 13 14 15 16 17 17 16 14 11 10 12 168 18 576 c 12 14 15 16 17 17 18 17 14 12 12 11 172 13
c - 3- to 8-tenths total cloud cover. e - 3- to 6-tenths total cloud cover. f - 4- to 6-tenths total cloud cover. g - Undefined.
251 | Vol_VII-0257
Table XXVII. Mean number of cloudy days Station Jan Feb Mar Apr May Jun Jul Aug Sep Oct Nov Dec Ann Yrs Rec Oceanic: 002 g 8 6 14 9 18 26 27 24 27 12 6 6 183 2 1/2 003 g 4 6 3 8 16 16 22 26 20 7 4 14 136 2 004 g 21 20 18 20 18 21 24 22 19 20 19 18 238 … 005 c 17 16 18 20 24 22 23 23 25 20 18 17 243 … 006 c 9 9 8 9 19 20 22 22 23 20 10 8 178 4 007 c 14 9 7 12 25 26 24 27 27 24 15 14 225 5 Alaska, Coastal and Insular: 100 g 10 6 8 11 19 14 16 21 21 19 13 13 171 10 102 g 11 10 10 11 10 9 19 18 14 15 14 14 156 11-13 104 g 14 11 13 14 12 13 19 19 16 16 14 15 176 19 105 g 13 15 18 22 22 16 24 22 22 22 20 20 237 2-4 106 g 14 13 14 13 14 12 16 18 16 16 16 15 177 24-26 Alaska, Inland: 152 g 10 8 9 7 8 7 15 16 16 17 10 10 134 8-10 153 g 11 9 9 7 8 7 8 12 13 18 15 13 130 10 154 g 14 13 12 13 16 13 21 19 19 17 14 14 185 18-19 156 g 15 13 13 11 16 12 17 22 19 20 16 14 188 10 157 g 15 14 15 15 18 16 18 20 20 20 17 14 202 10 Canada, Coastal and Insular: 201 c 4 2 6 3 12 15 18 16 11 7 3 4 101 2 202 c 2 6 3 6 14 14 14 19 18 11 3 4 114 3 204 c 11 9 12 12 14 16 14 21 20 18 14 10 170 3-5 213 c 10 4 6 8 11 13 12 19 19 20 14 9 146 3-5
c - 8-tenths or more total cloud cover. g - Undefined.
252 | Vol_VII-0258
Table XXVII. Mean number of cloudy days (cont.) Station Jan Feb Mar Apr May Jun Jul Aug Sep Oct Nov Dec Ann Yrs Rec Canada, Coastal and Insular (cont.): 218 c 5 0 1 8 14 16 8 13 20 13 12 1 111 2 223 c 11 10 12 16 22 21 16 18 21 23 20 10 199 5-7 224 c 12 8 10 15 21 20 21 13 23 21 18 16 198 4-5 226 c 13 5 9 10 17 17 19 16 22 17 16 9 169 2 227 c 12 14 16 17 21 19 18 15 20 20 20 17 208 2-5 Canada, Inland: 250 c 11 10 9 13 13 13 15 17 20 20 16 11 168 2-4 Greenland and Iceland, Coastal and Insular: 301 g 6 6 22 .. .. 15 10 15 12 10 11 4 … 1-2 302 g 14 12 10 16 19 16 20 17 17 18 18 12 189 2 304 g 9 7 8 10 14 16 14 15 15 15 14 13 150 31 307 g 8 8 8 5 9 12 12 10 6 8 6 10 102 … 308 g 12 14 9 10 11 10 9 7 8 10 10 13 123 19 310* g 14 12 13 13 14 14 13 14 13 14 15 17 166 15 314 g 15 12 13 12 13 12 12 14 13 14 13 12 155 31 317 g 13 17 12 11 12 11 9 9 10 13 13 12 136 30 318 g 13 12 12 11 10 11 12 13 11 13 12 10 140 28 320 g 13 11 12 11 10 11 11 13 11 12 12 11 138 19 330 g 15 14 15 13 11 11 14 16 15 15 15 15 170 16 331 g 14 14 15 15 12 14 15 15 13 11 13 14 165 16 332 g 17 16 17 18 14 16 20 21 18 19 17 16 209 16 333 g 18 15 17 16 17 15 18 17 17 14 14 17 195 11
c - 8-tenths or more total cloud cover. g - Undefined. * - Data for Agto, 67° 57′ N., 53° 44′ W.
253 | Vol_VII-0259
Table XXVII. Mean number of cloudy days (cont.) Station Jan Feb Mar Apr May Jun Jul Aug Sep Oct Nov Dec Ann Yrs Rec Greenland and Iceland, Coastal and Insular (cont.): 334 g 14 11 14 12 11 12 15 13 12 15 14 14 158 14 335 g 14 11 14 15 13 15 17 19 17 17 14 13 180 15 336 g 14 13 18 16 14 15 16 19 16 19 14 14 191 16 337 g 13 11 13 12 15 14 17 17 16 13 13 15 169 11 339 g 21 17 21 21 18 18 22 19 19 21 20 19 236 10 340 g 12 12 14 15 15 14 16 16 14 15 12 12 166 14 341 g 16 14 20 16 16 15 21 17 17 17 17 16 202 8 Greenland and Iceland, Inland: 360 g 18 15 17 18 20 15 18 19 18 17 16 16 207 7 361 g 15 11 14 15 13 13 15 17 14 18 14 13 172 16 Europe, Coastal and Insular: 400 c 15 12 12 14 23 22 23 26 25 23 16 13 225 10 401 c 11 9 7 16 24 25 25 27 24 19 14 9 208 4 403 c 13 12 11 10 13 17 16 17 16 16 12 11 164 … 406 a 15 15 17 17 18 17 16 15 17 16 26 13 202 12 407 c 13 11 16 15 17 15 13 15 18 14 14 12 173 10 408 a 16 13 14 15 18 16 16 17 15 17 17 17 191 29 412 a 14 12 12 11 10 10 12 12 14 13 15 14 149 28 414 c 14 13 13 14 14 14 13 13 16 14 13 12 163 25 415 c 16 14 12 15 18 15 17 16 17 18 18 17 191 18 417 c 18 16 13 18 24 20 2 22 20 21 21 21 216 7 420 c 15 12 13 12 12 11 12 14 15 14 15 15 160 27
a - 10-tenths total cloud cover. c - 8-tenths or more total cloud cover. g - Undefined.
254 | Vol_VII-0260
Table XXVII. Mean number of cloudy days (cont.) Station Jan Feb Mar Apr May Jun Jul Aug Sep Oct Nov Dec Ann Yrs Rec Europe, Coastal and Insular (cont.): 421 c 10 11 12 9 5 5 4 8 6 13 13 18 114 8 423 c 14 14 13 10 10 10 8 12 14 18 18 20 161 8 424 c 20 16 14 12 9 8 7 10 10 17 20 22 165 36 425 c 16 14 11 12 13 9 12 14 14 17 17 18 168 13 426 c 20 17 13 12 11 10 11 11 12 19 20 22 178 18 428 c 20 16 14 14 14 12 14 16 18 20 21 20 199 18 429 c 20 18 16 17 18 14 14 17 19 21 20 19 212 13 Europe, Inland: 450 c 10 10 11 9 14 16 13 17 16 16 17 17 166 8 451 a 12 11 11 12 17 14 13 17 14 18 15 14 168 18 453 c 17 11 12 15 12 12 11 13 13 20 19 17 172 9 454 c 18 15 14 15 15 15 17 19 18 17 17 16 196 31 455 c 13 13 14 9 6 7 6 10 7 17 16 20 138 8 456 c 12 13 12 13 12 14 12 13 13 14 18 16 162 8 457 c 18 14 12 11 8 8 7 10 10 17 20 20 155 36 458 c 17 15 13 12 10 10 8 12 13 19 21 20 170 35 Asia, Coastal and Insular: 500 c 12 9 10 17 24 24 22 25 25 23 19 15 225 8 501 c 10 5 6 10 19 22 21 25 24 18 10 11 181 5 502 c 11 7 6 10 20 21 20 27 23 19 10 9 181 4 503 c 11 9 6 12 22 22 23 26 24 21 12 9 196 7 505 b 17 16 15 14 20 16 15 19 21 19 18 15 205 13
a - 10-tenths total cloud cover. b - 9-tenths or more total cloud cover. c - 8-tenths or more total cloud cover.
255 | Vol_VII-0261
Table XXVII . Mean number of cloudy days (cont.) Station Jan Feb Mar Apr May Jun Jul Aug Sep Oct Nov Dec Ann Yrs Rec Asia, Coastal and Insular (cont.): 506 c 17 12 11 14 20 19 16 18 22 23 22 19 213 14 507 c 14 12 11 14 18 16 15 19 19 18 17 14 189 16 508 c 14 11 11 12 21 19 19 24 24 22 17 13 206 6 509 c 16 13 11 13 22 21 18 25 23 21 15 11 208 7 510 c 14 13 10 15 22 24 21 25 23 21 16 13 217 18 511 c 12 10 9 16 23 24 24 25 25 21 19 12 218 2-3 512 g 23 18 16 16 22 23 21 24 24 23 19 14 243 2-3 513 c 10 12 11 14 19 19 20 23 21 19 24 13 95 7 514 c 17 14 15 16 22 24 24 27 25 27 20 18 249 11 515 c 5 5 3 5 14 16 15 21 24 18 14 9 149 5 516 b 6 11 14 12 15 15 19 22 24 20 16 18 190 4 517 c 7 6 7 9 18 15 14 17 15 15 11 10 144 9 518 c 16 12 12 15 23 20 17 20 23 23 21 19 221 26 519 c 14 10 8 12 21 19 13 18 20 22 18 15 189 22 520 g 15 13 11 14 19 7 14 14 16 18 16 15 182 10 521 c 10 8 9 13 21 17 14 18 17 21 17 11 176 13 522 c 7 5 3 7 8 6 10 13 15 13 10 8 105 4 523 c 8 10 13 14 18 19 19 22 23 20 16 14 196 3 525 b 10 11 10 16 20 13 18 19 21 19 20 12 189 8 526 b 10 10 10 11 14 14 17 13 12 14 11 8 143 13 527 d 21 10 20 16 21 17 23 23 22 16 18 20 227 4 531 c 12 8 11 8 16 16 17 13 10 13 12 9 144 4
b - 9-tenths or more total cloud cover. c - 8-tenths or more total cloud cover. d - 7-tenths or more total cloud cover. g - Undefined.
256 | Vol_VII-0262
Table XXVII . Mean number of cloudy days (cont.) Station Jan Feb Mar Apr May Jun Jul Aug Sep Oct Nov Dec Ann Yrs Rec Asia, Inland: 551 b 17 15 8 17 18 24 20 25 21 21 17 17 220 … 552 c 16 12 14 15 18 20 21 21 22 26 19 16 220 20 553 c 13 13 12 11 18 18 14 21 20 23 16 13 192 18 554 c 7 11 9 14 17 16 15 15 21 19 13 7 170 3 555 g 15 10 14 10 14 16 10 15 19 23 17 10 173 4 556 c 4 4 4 8 11 13 11 14 13 12 7 6 107 8 557 b 10 13 11 10 14 13 16 16 14 14 12 12 155 14 558 b 6 6 4 5 9 9 11 16 15 13 10 3 110 9 559 c 7 8 5 7 5 11 10 19 16 12 10 13 133 4 560 d 17 16 16 17 20 19 17 20 20 20 17 18 217 8 561 d 21 18 17 18 20 17 18 22 23 24 20 20 238 6 562 c 14 9 9 8 11 10 9 9 15 16 15 15 138 … 563 c 12 11 10 10 14 12 10 14 16 20 15 13 157 … 566 c 13 10 8 9 15 11 9 12 15 16 15 12 145 8 567 c 6 8 7 10 12 11 9 11 13 16 12 6 121 11 568 c 7 6 3 6 8 6 7 9 9 12 8 9 90 24 570 b 1 1 2 4 4 3 3 4 7 10 7 4 50 8 572 g 20 10 9 9 4 10 12 13 15 15 12 12 141 10 573 d 18 14 16 14 18 16 15 17 17 22 20 21 208 9 574 d 21 15 18 19 22 18 18 22 24 25 25 23 250 6 575 b 12 9 11 11 12 10 10 12 14 18 17 14 150 18 576 b 16 11 10 10 11 10 10 12 14 16 17 18 158 13
b - 9-tenths or more total cloud cover. c - 8-tenths or more total cloud cover. d - 7-tenths or more total cloud cover. g - Undefined.
257 | Vol_VII-0263
cloudiness in early autumn, with a secondary maximum in early summer
immediately preceding the summer minimum of stratus just described.
The cause of the double maximum is therefore obvious. At more southerly
coastal locations nearer the winter storm tracks (as over northern
Scandinavian areas), the annual variation in cloudiness is less than is
true for the Arctic generally and some stations show maxima during one
of the winter months.figs. 51 and 52 here
At the more northerly locations the average amount of cloud cover
is relatively small in winter and also during the early spring, the
latter period being the most favorable for air operations within the
Arctic. The average cloud cover during winter is about 4-tenths over
the pack-ice and from 2- to 3-tenths at northerly land stations. These
figures are to be compared with summer averages of about 9- and 8-tenths,
respectively.During the winter and early spring months the proportion of high
clouds increases but the stratiform types still predominate. The
cumuliform types of cloud are exceedingly rare anywhere over the Arctic
Ocean and are infrequent elsewhere except over interior Arctic locations
258 | Vol_VII-0264
during summer. The excessive cloudiness prevalent during the warmer
months does not affect temperatures as significantly as might be expected
from experiences in lower latitudes. In the Arctic insolation is not
affected as much by clouds as in locations farther south, partly because
the layers of clouds in the Arctic are thinner than in lower latitudes
and partly because the incoming radiation is doubly reflected from snow–
covered ground and clouds. On account of the relatively strong insolation
on overcast days, the diurnal temperature range is much greater than on
corresponding overcast days in lower latitudes. This condition is
particularly true during spring months.Diurnal Variation of Cloudiness . — The hourly cloud data available for
a few localities over the Arctic Ocean and adjacent coasts show that
there is an apparent and regionally consistent diurnal variation during
the dark season and in the months when the night is longer than the day.
At this time there appears to be a definite maximum cloudiness during
the day (so-called) and a minimum cloudiness during the night. Simpson
[ 39 ] ascribes this feature to the fact that the observer’s estimate of
cloud cover tends to be too low when the sun is more than 10° below the
259 | Vol_VII-0265
horizon. Other observers have subsequently verified Simpson’s conclusion
as to the non-reality of the diurnal variation in Arctic cloudiness during
the winter half-year.During the summer half-year, when the sun is either continuously
above the horizon or the day is longer than night, the character of the
diurnal variation is regionally complex and appears to change from one
month to the next. Sverdrup [ 43 ] suggests that the maximum at night
occurs when there is a prevalence of stable fog situations, and that a
daytime maximum is associated with convection currents. The type of
diurnal variation which results depends upon which factor dominates
the local weather.Cloud Altitudes and Ceilings . — Cloud heights are lower in the Arctic
than in temperate latitudes. Over the Arctic Ocean and adjacent coasts,
for example, the bases of stratus clouds will be found anywhere between
the surface and 5,000 feet [ 43 ] but most frequently below 1,500 feet.
The following data from the Maud Expedition give the ranges and averages
of ceilings described by the bases of the various cloud types over the
Arctic Basin (as determined from pilot balloon observations):
260 | Vol_VII-0266
Cloud Form Altitude of Bases
(feet)Greatest Frequency
at Altitude
(feet)Cirrus Up to 19,000 … Cirrostratus 15,000 to 16,000 … Cirrocumulus 15,000 to 16,000 … Altostratus 8,000 to 15,000 11,500 to 13,000 Altocumulus 8,000 to 15,000 About 10,000 Stratocumulus 1,600 to 8,000 About 1,600 Fractostratus 650 to 6,500 … Stratus 0 to 5,000 Below 1,600
These data indicate that low ceilings unfavorable for air operations
over the Arctic Basin should be closely associated with the prevalence
of the stratus type of cloud formation. It is difficult to generalize
in similar fashion for inland areas because of the almost inseparable
relation between cloud altitudes and orography. In general, the period
of the greatest frequency of low ceilings will correspond to the period
of most frequent cloud cover, but there are important local exceptions
to this rule.
261 | Vol_VII-0267
According to Rigby [ 34 ] , low ceilings are most frequent nearly
everywhere in the Arctic during summer and early autumn, particularly
over the Kara and Barents Sea areas. Only in the more southerly Arctic
areas, nearer the major winter cyclone tracks, is there a general
reversal of this seasonal pattern.The vertical extent of cloudiness over the Arctic also averages
considerably less than at the lower latitudes where the atmospheric
moisture content is relatively high and where convective and frontal
activity is more vigorous. The weather reconnaissance flights which
have been conducted by the U. S. Air Force since 1947 show very clearly
that summer is the season of the greatest vertical development of cloud
systems over the Arctic. (See Table XXVIII .) During this season the average
altitude of the tops of the lower cloud layers is of the order of 11,000 table XXVIII here
to 12,000 feet, with the higher forms of clouds extending well above
20,000 feet. In late autumn, winter, and early spring, on the other
hand, the tops are normally below 6,000 feet — easily topped by aircraft
cruising at relatively low flight altitudes.
262 | Vol_VII-0268
Table XXVIII. Cloud cover* data from USAF reconnaissance flights
July 1948 to June 1949
Route — Fairbanks to Barrow to North Pole to Prince Patrick Island to
Aklavik to Fairbanks, or vice versa, depending on windsMonth Below 18,280 Feet Above 18,280 Feet Ovc Bkn Sct Clr Ovc Bkn Sct Clr Frequency (%) of Specified Cloud Conditions January 29 5 7 59 0 0 4 96 February 36 6 8 50 0 0 6 94 March 23 6 8 63 1 4 15 80 April 17 13 19 51 7 5 11 77 May 46 19 12 23 4 2 5 89 June 54 29 17 0 3 7 43 47 July 64 29 6 1 5 4 37 54 August 64 23 7 6 14 4 28 54 September 45 35 16 4 1 4 26 69 October 43 16 14 27 2 1 27 70 November 48 16 13 23 0 0 5 95 December 28 8 14 50 0 1 7 92
* Ovc - >. 9 to 1 . 0 cloud cover
Bkn - >. 5 to <. 9 cloud cover
Sct - >. 1 to <. 5 cloud cover
Clr - 0 <. 1 cloud cover
263 | Vol_VII-0269
The preceding figures apply principally to conditions over the
Arctic Ocean and contiguous coastal areas. In more southerly locations
on the fringes of the true Arctic, the vertical cloud structures are
more nearly typical of those found in temperate regions. At times of
strong convective or frontal activity, the cloud tops in these areas
may often exceed 30,000 feet.
264 | Vol_VII-0270
FOG AND VISIBILITY
With the possible exception of blowing snow, fog is the most
important weather factor limiting aviation in the Arctic regions.
Over a large portion of the Arctic seas fog may be expected to occur
on at least 90 days each year, and in many maritime areas the average
number is greater than 160. Fog frequencies are usually much lower
at inland locations, but at some points the annual figure may run
as high as 120 to 130 days. (See Table XXIX .) table XXIX here
265 | Vol_VII-0271
Table XXIX . Mean number of days with fog Station Jan Feb Mar Apr May Jun Jul Aug Sep Oct Nov Dec Ann Yrs Rec Oceanic: 003 15 8 12 5 17 19 27 27 15 6 7 10 167 2 004 2 3 3 5 3 6 13 10 6 3 2 2 58 … 005 1 2 3 5 7 9 19 15 12 4 3 1 82 … 006 3 6 7 7 4 6 20 20 13 4 2 1 92 4 007 2 4 3 4 3 14 26 23 14 5 3 3 105 5 Alaska, Coastal and Insular: 100 5 10 2 5 7 10 15 16 5 3 3 1 83 4 101 2 1 2 5 6 12 14 6 6 4 * 1 59 2 102 1 2 3 3 3 4 2 2 2 1 1 1 25 9-10 103 2 3 5 10 10 16 15 7 5 2 1 1 77 1-3 104 5 5 5 4 5 11 8 6 4 4 3 7 67 8 105 2 3 3 5 9 12 15 12 5 4 3 4 76 6-7 106 * 1 0 0 0 0 0 0 1 * 1 1 3 6-7 Alaska, Inland: 150 1 2 1 * 1 1 1 2 2 1 1 * 14 4-5 151 13 13 8 10 6 6 8 10 7 5 7 12 105 2-3 152 1 1 2 1 1 * 1 3 3 1 1 1 16 6-7 153 4 4 1 0 * 0 * * 2 2 2 4 20 5-10 154 2 1 3 2 4 2 5 7 6 3 2 3 40 7-8 155 1 1 0 * 0 * * 1 1 1 * * 5 10 156 17 11 12 1 1 1 2 4 3 7 6 13 78 8-9 157 1 1 * 0 * 0 * * 2 * * 1 6 7-10
* - Less than 0.5 day.
266 | Vol_VII-0272
Table XXIX . Mean number of days with fog (cont.) Station Jan Feb Mar Apr May Jun Jul Aug Sep Oct Nov Dec Ann Yrs Rec Canada, Coastal and Insular: 204 0 1 0 * * 1 2 2 1 1 * 1 7 6-7 205 0 0 * 0 0 1 2 1 10 2 0 0 16 1-3 206 4 1 0 1 0 1 10 12 13 1 2 1 44 1-3 210 1 2 1 2 * 1 6 7 1 1 1 1 26 3-4 211 0 0 1 * * 1 4 8 2 1 1 0 22 3-4 212 00 1 0 1 1 3 5 2 2 0 1 0 16 3 213 1 2 2 2 1 1 1 1 1 1 1 1 14 14-18 214 1 1 * 1 * 2 3 4 1 1 1 1 16 2-3 215 * * * 1 3 6 7 6 3 * * 0 26 7-10 216 * 1 * 1 2 1 2 3 1 1 * * 12 10-11 217 1 1 * 1 2 2 2 3 2 1 1 1 17 4-8 221 * 1 1 1 2 2 3 4 2 1 1 1 17 20 222 2 3 2 1 1 2 4 4 3 5 4 2 34 2½ 223 * 1 1 1 2 7 9 9 6 1 * 0 37 12-13 224 1 1 * 1 1 2 3 2 3 1 1 1 16 16-17 225 1 2 2 * 1 2 3 3 3 1 1 1 20 5 226 * * 1 1 1 1 1 1 1 ** 0 * 8 10-12 228 4 3 3 2 2 3 6 7 4 2 2 4 42 2½ Canada, Inland: 250 1 1 * 0 * * 1 * 1 1 * 1 5 11-16 251 6 1 0 0 0 0 0 1 2 1 2 1 15 1-5 254 2 2 1 1 * * * 1 2 2 2 2 16 17-21 256 * 1 * * * * * * * 1 1 * 3 1½
* - Less than 0.5 day.
267 | Vol_VII-0273
Table XXIX . Mean number of days with fog (cont.) Station Jan Feb Mar Apr May Jun Jul Aug Sep Oct Nov Dec Ann Yrs Rec Canada, Inland (cont.): 259 1 1 1 * 1 * * * 1 1 2 1 9 1½ 261 0 0 0 * 0 0 * 0 0 * 1 * 1 1 Greenland and Iceland, Coastal and Insular: 301 1 0 3 2 .. 6 7 11 5 3 1 1 .. 5 304 2 1 1 2 5 9 11 7 2 1 * 1 42 31 306 7 5 8 9 10 13 10 5 3 2 2 2 76 5 307 0 1 1 1 2 6 6 7 4 0 .. .. .. .. 308 4 6 6 8 15 14 11 8 9 5 4 6 96 11 309 9 9 11 12 15 15 17 17 8 8 3 5 125 .. 311 1 * 0 2 3 5 5 5 2 * 0 1 24 6 314 1 1 2 4 8 11 14 14 8 2 1 1 67 31 315 3 2 9 4 9 9 11 6 6 9 4 6 78 5 316 8 5 14 18 26 23 28 26 26 3 8 10 195 25 317 1 1 2 4 9 11 11 9 5 3 2 1 59 30 318 * * 1 1 1 3 5 6 3 1 * * 21 28 330 1 1 1 2 2 1 1 1 1 * 1 1 12 16 331 1 1 1 1 1 2 2 2 2 2 2 1 18 16 332 2 2 2 1 6 5 10 9 4 2 1 2 46 9 333 1 2 3 4 7 7 8 7 5 2 3 2 51 11 334 * 1 2 2 5 5 9 6 3 * 1 1 35 14 335 1 * 1 2 4 5 8 6 3 2 * 1 34 15 336 * * 1 1 2 2 3 3 2 1 1 1 17 16 337 * * 1 * * 1 1 * * * * * 4 11
* - Less than 0.5 day.
268 | Vol_VII-0274
Table XXIX . Mean number of days with fog (cont.) Station Jan Feb Mar Apr May Jun Jul Aug Sep Oct Nov Dec Ann Yrs Rec Greenland and Iceland, Coastal and Insular (cont.): 339 1 * 2 1 4 4 5 3 2 * 1 * 23 10 340 1 1 2 1 2 3 5 3 2 1 1 * 23 14 341 1 1 2 2 4 5 10 7 4 2 2 1 41 8 Greenland and Iceland, Inland: 351 15 14 4 1 6 1 2 13 15 26 16 20 133 1 360 * 1 1 1 * 1 1 * 1 1 1 1 9 7 361 2 1 1 1 2 2 4 2 2 2 2 1 20 16 Europe, Coastal and Insular: 400 6 7 9 9 9 10 15 16 6 5 4 5 100 10 401 2 * 4 8 5 13 24 24 14 5 2 2 104 4 403 * 1 * * * 3 4 3 1 1 0 0 13 7 405 2 5 4 5 3 2 11 3 5 1 1 2 44 9 406 0 0 0 * 1 3 6 5 1 * 0 0 16 12 407 * 0 0 0 * * 2 1 1 0 * * 4 10 408 * * 0 * 1 3 7 5 1 * * * 17 44 410 * 1 * 1 3 4 5 2 2 1 * * 19 .. 412 * * 0 * * * 1 * * * 0 * 1 44 414 1 1 1 1 1 1 2 2 2 1 1 1 14 46 415 1 * * * 1 1 3 4 2 1 2 1 16 10 417 2 3 3 5 6 12 14 12 5 3 4 2 71 .. 420 * * 1 1 2 3 3 2 1 1 * * 14 44 421 2 2 3 4 3 2 2 3 4 5 3 2 35 50 422 1 1 1 2 1 1 * 1 2 2 2 1 14 14
* - Less than 0.5 day.
269 | Vol_VII-0275
Table XXIX . Mean number of days with fog (cont.) Station Jan Feb Mar Apr May Jun Jul Aug Sep Oct Nov Dec Ann Yrs Rec Europe, Coastal and Insular (cont.): 423 2 2 2 2 2 1 1 1 2 3 3 2 23 50 424 9 8 9 8 4 2 2 2 7 10 8 8 77 36 425 1 1 2 1 2 1 2 3 2 2 1 1 17 10 426 3 4 4 4 2 1 1 3 7 6 5 5 46 10 428 3 3 3 2 1 * 1 2 2 4 3 3 27 10 429 * * 0 0 * 0 * 1 1 1 0 0 3 7 Europe, Inland: 450 4 3 3 2 2 0 0 1 2 5 5 4 31 50 451 5 2 1 * * * * 1 2 2 3 2 16 44 453 3 3 2 2 1 1 2 7 6 6 7 5 45 10 454 3 2 2 2 2 1 2 3 5 6 4 4 36 44 455 5 3 2 1 0 0 0 2 5 5 4 4 31 50 456 4 3 2 2 2 1 2 3 4 6 5 5 39 50 457 2 2 2 2 1 1 * 2 4 5 3 2 26 35 458 2 2 2 1 1 * * 1 3 2 2 1 17 35 Asia, Coastal and Insular: 500 1 2 3 4 5 12 17 17 10 3 1 1 76 8 501 4 3 4 3 7 14 19 18 8 4 1 1 86 5 502 4 5 6 6 6 9 13 16 6 8 4 3 85 4 503 2 4 7 7 6 11 21 21 11 5 4 1 99 7 505 2 3 2 2 4 8 12 11 8 5 3 2 62 14 506 6 5 7 6 9 15 17 16 11 5 3 4 106 14 507 2 2 2 1 3 4 6 6 5 3 2 2 39 16 508 5 8 8 6 6 15 18 12 8 6 4 5 101 6 509 6 4 3 5 8 9 8 8 8 6 4 3 73 7
* - Less than 0.5 day.
270 | Vol_VII-0276
Table XXIX . Mean number of days with fog (cont.) Station Jan Feb Mar Apr May Jun Jul Aug Sep Oct Nov Dec Ann Yrs Rec Asia, Coastal and Insular (cont.): 510 3 6 6 6 5 14 17 15 8 6 4 4 94 18 512 3 3 3 5 5 14 12 8 5 4 2 1 65 7 513 3 1 * 2 4 6 4 8 2 1 2 2 35 4 514 4 7 8 8 8 15 18 15 6 3 3 6 101 10 515 0 0 0 1 3 2 * 2 * 2 2 0 11 5 516 2 1 3 3 10 16 21 23 10 3 2 2 95 3 517 2 2 3 5 7 12 14 14 6 3 4 3 75 10 518 4 5 6 7 10 14 16 14 8 7 5 4 99 26 519 2 2 3 4 7 15 14 16 8 6 2 2 80 22 520 0 1 * 1 1 * 1 2 4 3 * * 14 9 521 3 2 4 4 5 7 5 6 5 5 3 2 51 13 522 0 0 0 0 1 1 1 1 1 1 0 * 6 5 523 5 2 4 4 10 14 16 15 10 3 5 3 91 3 524 1 1 4 6 11 10 13 9 9 10 4 3 81 4 525 5 5 6 5 8 14 17 13 11 4 4 3 95 8 526 1 * * 1 2 6 7 7 3 1 * 1 29 14 527 2 2 1 2 5 7 3 2 1 1 2 1 29 14 529 1 2 1 3 4 10 10 12 3 1 1 1 49 3 530 5 2 4 7 5 8 12 10 8 6 3 7 77 5 531 0 0 0 1 5 9 12 9 4 1 0 0 41 4 Asia, Inland: 550 2 2 1 1 2 4 3 6 4 4 4 3 35 5 551 1 0 0 0 0 0 1 2 1 1 0 0 5 2 552 10 12 7 6 4 7 6 6 9 13 9 11 100 8
* - Less than 0.5 day.
271 | Vol_VII-0277
Table XXIX . Mean number of days with fog (cont.) Station Jan Feb Mar Apr May Jun Jul Aug Sep Oct Nov Dec Ann Yrs Rec Asia, Inland (cont.): 553 7 4 5 7 7 4 3 5 5 8 7 4 66 18 554 4 2 3 1 3 6 2 1 3 3 4 3 32 4 555 5 4 2 0 1 2 4 3 4 5 2 6 38 3 556 3 2 1 * 1 * 1 5 4 1 2 4 24 9 558 3 2 1 * 1 * 1 3 2 2 1 2 18 8 559 0 1 * 0 0 0 1 4 2 1 1 * 10 4 560 2 1 1 1 1 * * 1 2 2 1 2 12 8 561 0 0 0 0 * 0 0 0 1 1 0 0 2 5 562 0 * * * 1 * * 1 2 1 * 0 6 10 563 * * * 0 1 * * * 1 1 1 2 6 7 566 7 2 1 * 0 * 1 3 2 1 1 4 22 8 567 4 2 1 * * * * 1 1 1 1 5 16 10 568 12 7 1 * 0 * * 1 2 2 2 10 38 25 570 0 0 * * * 1 2 3 3 1 0 0 10 7 572 0 * 0 * 1 * * 1 1 1 1 0 5 14 573 2 1 1 1 1 1 1 3 3 4 2 3 23 9 574 2 1 * 0 * * 1 3 3 * * * 10 9 575 2 * * 0 1 1 4 6 6 1 * 2 23 11 576 8 3 * * * * 1 1 1 1 1 7 23 11
* - Less than 0.5 day.
272 | Vol_VII-0278
It is quite probable that the frequency of fog over the Arctic
Ocean decreases from the coasts toward the Pole. According to
Stefansson [41] , the zone of most frequent fog formation is a belt
parallel to the coast line of the Polar Sea. This belt does not
extend more than twenty or thirty miles seaward or more than a
corresponding distance inland. However, regional comparisons
concerning the number of days with fog are somewhat unreliable,
partly because the observations have been made at a variety of hours
and partly because fog has not always been recorded in accordance with
international procedures. For these reasons, and for the additional
reason that fog is essentially a phenomenon governed by local rather
than regional factors, caution should be exercised in attempting to table XXX here
distinguish small regional and areal differences in the frequencies
of fog occurrence on the basis of the observational materials presented
in the several figures and tables. The data, however, are probably
entirely adequate for purposes of noting in time differences in fog
occurrence at the locations for which data are available and for
pointing out the large and more important regional differences in
prevalence of the phenomenon.
273 | Vol_VII-0279
Table XXX. Prevailing wind direction during fog occurrence Station Jan Feb Mar Apr May Jun Jul Aug Sep Oct Nov Dec Yrs Rec Oceanic: 006 SW SW E N SW S NW NW S W SE SW 5-6 E E Asia, Coastal and Insular: 500 SE SE SE NW NW NW NW NW SE NW W SE 7-8 SW 503 E W E SW NE E E E W NE E E 7-8 S SW 506 S S S NE NE NE NE NE SW SW SW SE 20 507 NE E NE NE NE NE SE E NE SE NE NE 17 E E SE 510 S S S S S N N NE S S S S 19 512 W SW W NE E E N E E SW SW SW .. 517 .. .. .. .. .. E E E NE .. .. .. .. 518 S S S SW SW SW N SW SW SW S S 26 523 .. .. .. .. .. SE SE SE SE .. .. .. .. 525 .. .. .. .. .. N N N N .. .. .. .. 530 .. .. .. .. .. SE SE SE SE .. .. .. .. Asia, Inland: 552 SW SW SW N N SW N SW SW SW SW SW ..
274 | Vol_VII-0280
Fog Types . - Four types of fog are of common occurrence in the Arctic.
The most common type is an advection fog formed primarily during
warmer months when relatively warm, moist air moves over a cold surface.
A further condition is the existence of a surface temperature inversion
which serves to retard turbulent dissipation of the fog. The areas
which are most favorable for the formation of this type of summer fog
are the open waters of the Kara, Laptev, East Siberian, and Chukchi
Seas. Fifteen to twenty days per month with fog is a normal condition
for these areas during the summer. Because of the influx of warm
water from the Gulf Stream system, this type of fog is less frequent
over the Barents and Norwegian Seas. The frequency of the summer
advection fogs decreases rapidly from the coast line inland and
diminishes less rapidly over the pack-ice.
275 | Vol_VII-0281
The second type of fog of importance in the Arctic is the
radiation fog of winter. These fogs form readily under a sharp
surface temperature inversion during very cold weather and are
caused by reduction in temperature of the moist surface air by
contact with the radiationally-cooled ground or ice surface. Because
the heat conduction from subsurface layers is larger over oceanic ice
than over land or snow surfaces, the radiational cooling is more
effective in producing fog over coastal and inland points than over
the ice of the Arctic Ocean.
276 | Vol_VII-0282
According to Petterssen / [ 31 ] / , the fogs are also less frequent
over snow surfaces than over snow-free regions because of the
depression of the saturation vapor pressure over ice. Even when the
air is clear and calm so that radiational cooling is most rapid,
fogs do not easily form over cold snowfields. The following fog
data obtained on the Maud Expedition ( Sverdrup / [ 43 ] / ) show that there
is a conspicuous minimum in fog frequencies between the temperatures
of +5° and −13°:Temperature 41° 41° 32° 23° 14° 5° 4° to to to to to to Interval (°F.) 32° 23° 14° 5° −4° −13° Probability of
dense through
light fog (mist)0.114 0.317 0.224 0.110 0.061 0.027 0.020 Temperature −13° −22° −31° 40° to to to Interval (°F.) −22° −31° −40° Probability of
dense through
light fog (mist)0.046 0.095 0.076 0.210
277 | Vol_VII-0283
The minimum in fog probability in the temperature range +5° to −22°
appears to be associated with the vapor pressure depression which
is noted to be at a maximum in the temperature ranges +5° to −15°
(see Table II). The data also show a secondary maximum probability
in the temperature range −22° to −31°. This appears to be associated
with the prevalence of ice fog, which is to be discussed in succeeding
paragraphs.Because radiation fog is essentially a surface phenomenon, the
fog layers are usually shallow. They are also of light density, since
they tend to occur at the lowest temperatures when the quantity of
water vapor available for condensation is of necessity low. They
occur most frequently along river bottoms open to cold air drainage
and where there is sluggish air movement. They appear to be most
common in the lower Lena River Valley in Siberia and the lower
Mackenzie River Valley in North America. They are also quite frequent
in the Yukon Valley and in the valleys of the principal northward–
flowing rivers of Siberia, as well as over the pack-ice during cold
weather.
278 | Vol_VII-0284
The third type of fog, one of minor importance, is “steam fog”
or “Arctic smoke.” These fogs occur over open water which is subject
to invasion by very cold air. They occur only when the contrast
between air temperature and water temperature is very great. Under
such conditions the rate of evaporation from the water surface remains
relatively high, but the capacity of the surface air to hold moisture
is limited by its low temperature. As a result, the excess moisture
quickly condenses into fog, giving a “steaming” appearance to the water
surface. These fogs occur most frequently over rivers, unfrozen lakes,
open leads or polynias in the Arctic ice, and over coastal waters
which are adjacent to a local cold-air source. Such “steam” fogs are
generally shallow and are quickly dissipated by wind. However, they
may be sufficiently dense at times to obscure coastal landmarks and
landing strips adjacent to open water. Over the Arctic Ocean they
serve the very important purpose of advising the traveler of the
presence of open water.
279 | Vol_VII-0285
Similar to the “steam” fogs are the “animal” or “human” fogs
which are possible at Arctic temperatures of −40° F. or below. At
such temperatures the small amount of moisture given off by humans
or animals is sufficient to cause light fog in the immediate vicinity.
Persistent fog, however, occurs only under calm, or nearly calm,
conditions. At times such fog may be sufficiently dense to obscure
a herd of reindeer or caribou or a dog team. The effect probably
also adds to the frequency and density of fog within villages and
towns of the Arctic under very cold and calm conditions.
280 | Vol_VII-0286
The fourth type of fog, ice fog, is classified as a separate
form because of its composition rather than because is possesses
unique processes of formation. Ice fog is formed when temperatures
are low enough to cause direct atmospheric sublimation of moisture
in the form of ice crystals rather than in the form of sub-cooled
water droplets as in ordinary radiation or advection fogs. This
type of fog is particularly prevalent in and near inhabited areas
where there is a local source of moisture and where local combustion
products supply an abundance of condensation nuclei. The fog layers
vary in thickness from 50 to 500 feet and, while vertical visibilities
are usually good, horizontal visibility may be reduced to zero in
some cases. Ice fog which is dense enough and persistent enough to
seriously affect aircraft operations rarely occurs with temperatures
above −20°F. and with wind speeds in excess of 3 mph. This type of
fog is prevalent at all interior Arctic installations and at coastal
areas under distinct continental influence.
281 | Vol_VII-0287
Annual Variation of Fog . - While there is a tendency for Arctic
locations to show a maximum frequency of fog in summer, autumn, or
late spring, almost any month of the year will be represented as a
maximum month at some Arctic point. Inland areas which show a
preponderance of the radiation type of fog tend to present maxima
during one of the cooler months and particularly during autumn.
Maritime locations most frequently affected by advection fogs present
decided summer maxima.At higher elevations, as on the Greenland Ice Cap and in the
Alaskan mountains, fog is most often simply surface-lying cloud. This
fact is attested by the parallel curves shown when frequencies of days
with precipitation and days with fog are plotted together. In such
locations the period of maximum fogginess then merely coincides with
the period of maximum frontal activity. An example of such a fog–
precipitation regime is given by the following data for West Station
located at a moderate elevation (3,130 feet) on the edge of the
Greenland Ice Cap:
282 | Vol_VII-0288
West Station (Lat. 71°11′ N.; Long. 51°07′ W.)
Jan Feb Mar Apr May Jun Jul Aug Sep Oct Nov Dec Ann No. days with Precipitation 13 19 11 12 9 6 4 15 8 10 10 13 130 Fog 11 16 13 11 7 4 3 15 5 12 10 16 123
Diurnal Variation of Fog . - During the summer months over the Arctic
Ocean and adjacent coasts the probability of fog is much greater in
the night hours than during the early afternoon. This tendency is
shown clearly by the following data obtained on the Maud Expedition
during the months of June through August:Local Hour 2 4 6 8 10 12 14 16 18 20 22 24 Probability
of Fog0.36 0.37 0.33 0.27 0.22 0.19 0.18 0.19 0.22 0.24 0.28 0.32
The Maud data also show a somewhat similar diurnal variation in fog
frequencies during the colder months, but Sverdrup / [ 43 ] / assumes that
this variation is largely spurious and suggests that darkness has, to
some extent, influenced the accuracy of the fog observations.
283 | Vol_VII-0289
Data from inland Arctic stations show a diurnal variation in
fog similar to that noted over the maritime Arctic regions, with a
definite tendency for the phenomenon to occur more frequently in the
early morning than at noon or in the evening. It is common practice
in these regions to limit aviation activities during early morning
hours because of the prevalence of visibility-restricting fog.
284 | Vol_VII-0290
Other Visibility-Reducing Factors . - During the warmer months in the
Arctic, fog is the most important visibility-reducing factor. During
the winter months, however, blowing snow is the most common cause of
reduced visibilities, particularly in the more unprotected continental
and insular locations. Observations at Coppermine recorded by the
Canadian Polar Year Expedition / [ 7 ] / show that there were 79 hours
during the winter (1932-33) when blowing snow reduced the visibility
to 1,000 yards or less. At Chesterfield Inlet, blowing snow was
reported on 99 days from October to May inclusive. During November
1949, Pt. Barrow, Alaska, reported 265 hours with blowing snow, and
in December of the same year, Barter Island, Alaska, reported 241 table XXXI here
such hours. Other Arctic Alaskan stations show monthly averages of 65
to 120 hours during the winter season. Conditions over interior
Greenland and portions of Siberia are probably much more severe. The
frequency and severity of blowing snow is, of course, related directly
to the frequency of high winds and the presence of new or powdery snow
cover.
285 | Vol_VII-0291
Table XXIX. Mean number of days with blowing snow Station Jan Feb Mar Apr May Jun Jul Aug Sep Oct Nov Dec Ann Yrs Rec Oceanic: 006 9 6 11 8 9 5 0 0 4 8 8 8 75 5-6 007 13 11 15 14 15 5 0 * 3 12 11 11 110 5-6 Europe, Coastal and Insular: 400 9 10 15 13 10 1 * * 4 10 8 11 94 10 Asia, Coastal and Insular: 500 12 12 16 16 12 4 0 0 2 8 11 10 103 7-8 501 11 13 13 12 11 3 0 0 2 9 6 11 89 5-6 502 14 13 15 18 15 4 0 0 2 8 11 9 107 4-5 503 18 14 19 16 18 9 0 1 7 14 16 18 150 7-8 507 11 10 11 11 9 1 0 0 1 6 10 11 82 17 508 11 9 11 14 14 3 * 0 * 7 10 12 91 6 509 16 15 16 17 12 1 0 0 1 6 13 11 108 6-7 510 13 15 16 18 14 3 0 0 2 12 13 14 120 19 518 12 13 16 13 9 * 0 0 0 3 8 13 88 26 519 8 8 10 8 4 * 0 0 * 3 6 4 51 22
* Less than 0.5 day.
286 | Vol_VII-0292
The best visibility conditions in the Arctic occur in April and
May when the summer fogs are not yet manifest, and when the slight
ice-crystal turbidity is not so frequent as in winter [ 42 ] .From the preceding discussion it is apparent that the Arctic is
not a region of consistently good visibilities. At first glance it
might appear that such a statement is in disagreement with the one
previously made (on page ___) to the effect that Arctic air masses
are characterized by exceptionally good visibilities (because of low
values of turbidity). Actually, the two conclusions are not in dis–
agreement. Arctic visibilities can be described as either poor or
very good depending upon whether or not hydrometeors are present in
the surface atmosphere. Such a statement implies that moderate visi–
bilities are comparatively rare in the Arctic. This latter conclusion
is verified for at least one Arctic area by Hovmøller [ 20 ] who points
out that visibilities in the range 1 to 12 miles are rare along the
northeastern coasts of Greenland, i.e., the greatest number of visibili–
ties are either less than 1 mile or greater t h an 12 miles.
287 | Vol_VII-0293
SUNSHINE, ILLUMINATION
The duration of sunshine has seldom been included among the
records of Arctic observations. Over the Arctic Ocean such data
are available only from the Maud Expedition [ 43 ] . These obser–
vations show that during March and April the duration of sunshine,
both in actual hours and in percent of possible sunshine hours, is
greater over the Arctic Ocean than over any region in southern Europe.
The values are much less during summer, however.Duration of Sunshine over the Arctic Ocean (from the Maud )
Mar Apr May Jun Jul Aug Hours 204 309 269 98 117 70 % of possible hours 69 64 38 14 16 14
288 | Vol_VII-0294
During the year 1932-33, records of sunshine were obtained by
the Canadian North Polar Year Expeditions to Coppermine, Chesterfield
Inlet, and Capes Hopes Advance. Here, the greatest number of hours
of sunshine and also the greatest percentage of possible sunshine were
recorded during July and August when the duration of sunshine amounted
to 40 or 50 percent of the total possible. The minimum was reached in
December when less than 10 percent of the possible was recorded.
289 | Vol_VII-0295
In Arctic regions the quality of light is often a more practical
consideration than is the duration of sunlight or darkness. The
amount of light reflected from the snow surfaces is much greater than
in lower latitudes because of the lower angle of incidence of the
sun’s rays. As a result, the useful illumination is much greater
than under similar conditions of sunlight in lower latitudes. One
disadvantage, however, is that the light reflected from the snow surface
may be so intense as to obliterate definitive shadows. The resulting
lack of contrast may make it impossible to distinguish outlines of
terrain features or even of fairly large surface objects at close
range. Dark mountains may be seen for great distances, while a
crevasse immediately ahead of the traveler may be unseen. Moreover,
because of the high reflectivity of the snow cover, the danger of
severe sunburn is more likely than in southern latitudes, and snow
glasses are a necessary part of the equipment of every Arctic
traveler.
290 | Vol_VII-0296
In winter, however, the high reflectivity of the snow cover
is a valuable asset. Pilots have reported that the light of a half–
moon over a snow-bounded airfield is sufficient for landing purposes.
Most surface activities can be carried on under moonlight conditions
in the Arctic and the light of the stars alone is sufficient for some
purposes. It is only during periods of heavy overcast that the Arctic
darkness begins to approach the darkness of temperate latitudes.The total illumination throughout the year is greatest over the
Arctic pack-ice and the Greenland Ice Cap and least over open water
surfaces in winter and over snow-free land areas in summer.Fig. 53 here
Table XXXII here
291 | Vol_VII-0297
Table XXXII. Locations of Arctic weather stations Station
NumberStation
NameLatitude
° ′ NLongitude
° ′Elevation
(ft.)Oceanic: 001 “Sedov” (Drifting Ship)
(1939)Jan 84 55 124 12 E Sea level Feb 85 55 119 26 Mar 86 24 110 05 Apr 86 13 89 32 May 85 45 78 27 Jun 85 50 68 08 Jul 85 33 62 13 Aug 86 11 54 46 Sep 86 05 37 59 Oct 84 49 25 54 Nov 84 09 13 31 Dec 82 35 81 15 002 “Fram” (Drifting Ship)
(1893-1896)Mean Position
82° 42′ N., 89° 36′ ESea level 003 “Maud” (Drifting Ship)
(1922-1924)Mean Position
74° 36′ N., 164° 00′ E.Sea level 004 Jay Mayen 70 59 08 20 W. 76 005 Bear Island 74 28 19 17 E. 133 006 Ostrov Domashnii 79 30 91 08 10 007 Ostrov Uedineniia 77 30 82 12 30 008 Papanin North Polar
Expedition (Drifting
Ice) (1937-1938)Jan 77 00 10 W. Sea level Feb 73 00 17 Mar .. ..
292 | Vol_VII-0298
Table XXXII. Locations of Arctic weather stations (cont.) Station
NumberStation
NameLatitude
° ′ NLongitude
° ′Elevation
(ft.)Oceanic: (cont.): 008 (cont.) Papanin North Polar
Expedition (Drifting
Ice) (cont.)Apr .. .. May 89 20 60 W. Jun 88 50 10 Jul 88 20 05 Aug 87 30 00 Sep 86 20 00 Oct 84 40 05 E. Nov 83 30 05 W. Dec 81 30 07 009 Foka Bay 76 00 60 12 E. Sea level Alaska, Coastal and Insular: 100 Barrow 71 18 156 47 W. 13 101 Point Hope 68 20 166 48 19 102 Kotzebue 66 52 162 38 11 103 Wales 65 36 168 04 3 104 Nome 64 30 165 24 17 105 Gambell 63 51 171 36 30 106 Anchorage 61 13 149 52 118 Alaska, Inland: 150 Shungnak 66 55 157 05 W. 142 151 Umiat 69 26 151 50 .. 152 Wiseman 67 26 150 13 675
293 | Vol_VII-0299
Table XXXII. Locations of Arctic weather stations (cont.) Station
NumberStation
NameLatitude
° ′ NLongitude
° ′Elevation
(ft.)Alaska, Inland (cont.): 153 Fort Yukon 66 34 148 18 W. 417 154 Bethel 60 48 161 45 35 155 Tanana 65 10 152 06 220 156 Fairbanks 64 51 147 43 440 157 Eagle 64 46 141 12 804 Canada, Coastal and Insular: 200 Lady Franklin Bay 82 00 63 06 W. .. 201 Fort Conger 81 44 64 45 .. 202 Ellesmere Land 76 36 87 06 .. 203 Goose Fiord 76 44 88 39 .. 204 Craig Harbor 76 12 79 35 12 205 Bache Peninsula 79 10 76 45 10 206 Holman Island 70 30 117 38 30 207 Banks Strait 73 48 114 54 .. 208 Winter Harbor 74 47 110 48 .. 209 Barrow Strait 74 06 93 34 .. 210 Fort Ross 72 02 94 03 50 211 Arctic Bay 73 16 84 17 36 212 Dundas Harbor 74 34 82 10 18 213 Pond Inlet 72 43 78 30 13 214 Clyde 70 20 68 30 26 215 Herschel Island 69 30 139 15 .. 216 Coppermine 67 49 115 10 13
294 | Vol_VII-0300
Table XXXII. Locations of Arctic weather stations (cont.) Station
NumberStation
NameLatitude
° ′ NLongitude
° ′Elevation
(ft.)Canada, Coastal and Insular (cont.): 217 Cambridge Bay 69 05 105 00 W. 15 218 King William Land 68 37 95 53 .. 219 Foxe Channel 67 12 84 42 .. 220 Cumberland Sound 66 30 67 06 .. 221 Chesterfield Inlet 63 20 90 43 13 222 Coral Harbor 64 11 83 21 193 223 Nottingham Island 63 07 77 56 54 224 Lake Harbor 62 50 69 55 54 225 Upper Frobishcher Bay 63 45 68 32 54 226 Pangnirtung 66 09 65 30 50 227 Resolution Island 61 18 64 53 127 228 Churchill 58 47 94 11 44 Canada, Inland: 250 Aklavik 68 14 134 50 25 251 Fort McPherson 66 58 134 55 .. 252 Dawson 64 04 139 29 1,062 253 Whitehorse 60 43 135 05 2,289 254 Fort Good Hope 66 15 128 38 214 255 Watson Lake 60 07 128 48 2,248 256 Norman Wells 65 17 126 47 290 257 Fort Norman 64 54 125 40 .. 258 Fort Simpson 61 52 121 13 572 259 Hay River 60 51 115 58 ..
295 | Vol_VII-0301
Table XXXII. Locations of Arctic weather stations (cont.) Station
NumberStation
NameLatitude
° ′ N.Longitude
(ft.)Elevation
(ft.)Canada, Inland (cont.): 260 Yellowknife 62 28 114 27 W. 660 261 Fort Resolution 61 10 114 00 .. 262 For Smith 60 00 111 52 680 263 Fort Vermilion 58 23 115 59 .. Greenland and Iceland, Coastal and Insular: 300 Robeson Channel 82 00 63 42 W. Sea level 301 Inglefield Bay 77 20 67 30 Sea level 302 Thule 76 34 68 48 129 303 Danmarkshavn 76 46 18 45 20 304 Upernivik 73 47 56 09 59 305 Marrak 70 30 54 15 136 306 Umanak 70 41 52 09 .. 307 Myggbukta 73 30 21 35 13 308 Scoresbysund 70 28 21 58 56 309 Gothavn 69 14 53 31 36 310 Edgesminde 68 43 52 50 106 311 Holstensborg 66 56 53 39 89 312 Sondrestromfjord 66 30 52 15 190 313 Cruncher Island 66 02 53 33 51 314 Godthaab 64 11 51 45 66 315 Skjoldungen 63 21 41 39 297 316 Atterbury Dome 65 20 40 18 1,186 317 Angmagssalik 65 30 37 33 95
296 | Vol_VII-0302
Table XXXII. Locations of Arctic weather stations (cont.) Station
NumberStation
NameLatitude
° ′ N.Longitude
° ′Elevation
(ft.)Greenland and Iceland, Coastal and Insular (cont.): 318 Ivigtut 61 12 48 10 W. 82 319 Narsaq Point 60 54 46 00 95 320 Nanortalik 60 10 45 17 23 321 Prince Christian Sound 60 03 43 12 250 330 Lambavtn 65 30 24 06 5 331 Reykjavik 64 09 21 57 167 332 Kollsa 65 21 21 11 39 333 Vik 63 25 19 01 20 334 Grimsey 66 30 18 01 72 335 Husavik 66 02 17 21 .. 336 Akureyri 65 41 18 05 23 337 Fagurholsmyru 63 54 16 37 131 338 Holar 64 18 15 11 .. 339 Hofn 66 02 14 48 20 340 Seydisfjorder 65 16 14 00 26 341 Vattarnes 64 56 13 41 66 Greenland and Iceland, Inland: 350 Watkins Ice Station 67 03 41 49 W. 8,200 351 Eismitte 70 54 40 42 9,938 360 Haell 64 04 20 13 427 361 Grimsstadhir 65 36 16 12 1,247 Europe, Coastal and Insular: 400 Bukhta Tikhaya 80 19 52 48 E. 20
297 | Vol_VII-0303
Table XXXII. Locations of Arctic weather stations (cont.) Station
NumberStation
NameLatitude
° ′ N.Longitude
° ′Elevation
(ft.)Europe, Coastal and Insular (cont.): 401 Ostrov Rodol’fa 81 48 57 57 E. 157 402 Quade Hook 78 57 12 30 33 403 Green Harbor 78 02 14 15 36 404 Storo 76 30 16 30 .. 405 Mossel Bay 79 54 16 27 .. 406 Gjesvaer 71 06 25 22 20 407 Kistrand 70 28 25 15 5 408 Vardo 70 22 31 06 39 409 Nordoyan 64 48 10 33 102 410 Skomvaer 67 30 11 54 65 411 Svolvaer 68 14 14 37 3 412 Bodo 67 17 14 26 56 413 Andenes 67 20 16 08 23 414 Tromso 69 39 18 57 335 415 Kola 68 53 33 01 23 416 Swayatoi Nos 68 09 39 49 246 417 Kolquev Island 68 46 48 18 22 418 Pusstoserssk 67 35 52 11 39 419 Kirkenes 62 02 04 59 135 420 Bronnoysund 65 28 12 12 17 421 Harnösand 62 38 17 57 29 422 Vaasa 63 05 21 37 30 423 Haparanda 65 50 24 09 13
298 | Vol_VII-0304
Table XXXII. Locations of Arctic weather stations (cont.) Station
NumberStation
NameLatitude
° ′ N.Longitude
° ′Elevation
(ft.)Europe, Coastal and Insular (cont.): 424 Helsingfors 60 10 24 57 E. 39 425 Kem 64 57 34 39 30 426 Leningrad 59 56 30 16 20 427 Solovets 65 01 35 45 56 428 Archangel 64 28 40 31 20 429 Mezen 65 50 44 16 66 Europe, Inland: 450 Karesuando 68 26 22 30 1,091 451 Karasjok 69 28 25 31 443 452 Inari 68 57 26 49 502 453 Sodankyla 67 22 26 39 591 454 Trondheim 63 26 10 25 210 455 Falun 60 37 15 38 399 456 Stenselle 65 04 17 11 1,076 457 Jyvaskyla 62 14 25 44 387 458 Kajaani 64 13 27 46 479 459 Ust Ssyssolssk 61 40 50 51 332 460 Ust Zylma 65 27 52 10 220 Asia, Coastal and Insular: 500 Mys Zhelaniia 76 57 68 34 26 501 Mys Sterlegova 75 25 88 54 33 502 Ust’e R. Taimyry 76 12 99 04 30 503 Mys Cheliuskina 77 43 104 17 16
299 | Vol_VII-0305
Table XXXII. Locations of Arctic weather stations (cont.) Station
NumberStation
NameLatitude
° ′ N.Longitude
° ′Elevation
(ft.)Asia, Coastal and Insular (cont.): 504 Ostrov Kotel’nyy 76 02 138 06 E. .. 505 Malye Karmakuly 72 23 52 44 52 506 Ostrov Vaigach 70 24 58 48 36 507 Matochkin Shar 73 16 56 24 59 508 Ostrov Belyi 73 20 70 02 20 509 Gydo-Yamo 70 55 79 33 26 510 Ostrov Diksona 73 30 80 24 66 511 Ostrov Sagastyr’ 73 23 126 36 16 512 Tiksi Bay 71 35 128 56 33 513 Kazach’ye 70 45 136 16 56 514 Shalaurova 73 11 143 14 26 515 Russkoye Ust’ye 71 00 149 05 6 516 Mys Medvezhiy 69 38 162 24 .. 517 Wrangell Island 70 58 178 33 W. 10 518 Yugorski Shar 69 49 60 46 E. 43 519 Mare-Sale 69 43 66 48 56 520 Obdorsk 66 35 66 31 86 521 Novy Port 67 42 72 57 16 522 Wizhne-Kolymsk 68 32 160 59 16 523 Mys Shmidta 68 55 179 29 W. 30 524 Mys Van Karem 67 28 175 17 .. 525 Uelen 66 10 169 50 23 526 Gizhiga 62 03 160 30 E. 33
300 | Vol_VII-0306
Table XXXII. Locations of Arctic weather stations (cont.) Station
NumberStation
NameLatitude
° ′ N.Longitude
° ′Elevation
(ft.)Asia, Coastal and Insular (cont.): 527 Anadyr’ 64 45 177 35 E. 16 528 Zaliv Kresta 66 10 178 59 W. 13 529 Providence Bay 64 24 173 13 13 530 Lawrence Bay 65 35 170 40 Sea level 531 Ola 59 33 151 13 E. 16 Asia, Inland: 550 Volochanka 70 58 94 30 E. .. 551 Khatanga 72 00 102 09 230 552 Bulun 70 40 127 12 115 553 Ust ‘Yeniseiskii Port 69 40 84 24 20 554 Dudinka 69 24 86 04 66 555 Igarka 67 30 86 50 .. 556 Verkhoyansk 67 35 133 30 400 557 Abyy 68 26 145 11 59 558 Sredne-Kolymsk 67 27 153 34 98 559 Rodchevo 66 18 152 44 33 560 Berezovo 63 56 65 04 138 561 Samorova 60 58 69 04 544 562 Surgut 61 17 75 20 135 563 Turukhansk 65 55 87 38 13 564 Taimba 60 19 98 55 551 565 El’gyay 62 29 117 31 443 566 Olekminsk 60 24 120 24 499
301 | Vol_VII-0307
Table XXXII. Locations of Arctic weather stations (cont.) Station
NumberStation
NameLatitude
° ′ N.Longitude
° ′Elevation
(ft.)Asia, Inland (cont.): 567 Viliusk 63 45 121 35 394 568 Yakutsk 62 01 129 43 354 569 Semenowskij Rodnik 64 00 132 00 3,346 570 Ust’-Maya 60 25 134 29 581 571 Olmyaken 63 28 142 30 2,625 572 Markovo 64 41 170 25 85 573 Tobolsk 58 12 68 14 355 574 Yeniseysk 58 27 92 10 256 575 Kirensk 57 47 108 07 865 576 Blagoveshchensk Priisk 58 10 114 17 1,608 577 Bur 58 57 106 31 1,414
302 | Vol_VII-0308
THE METEOROLOGY OF THE ARCTIC
INFORMATION ON DIAGRAMS
Figs. 1-3 Supplied. Fig. 4 Same as Fig. 18 (p. 90) in Haurwitz and Austin:
“Climatology.” Copyright by McGraw-Hill, New YorkFigs. 5-12 Supplied. Fig. 13 Upper figure same as Fig. 351, p. 623, and lower
figure same as Fig. 357, p. 625 in Meddelelser om
Gronland, Bd. 75, 1930.Fig. 14 Supplied. Fig. 15 Same as Tafel X at p. 252 in “Danmark Expeditionen til
Gronlands Nordostkyst 1906-1908.Figs. 16-17 To be found in Scoresby, Wm., Transactions of the
Royal Soc. of Edinburgh. Vol. 9. pp. 299-305.Fig. 18 Same as Fig. 89 (p. 160) in S. Petterssen: Weather
Analysis and Forecasting, Copyright by McGraw-Hill,
New York.
303 | Vol_VII-0309
Fig. 19 Same as Fig. 90 in book referred to under Fig. 18. Fig. 20 Same as Fig. 124 (p. 269) in book referred to under
Fig. 18.Fig. 21 Same as Fig. 126 (p. 271) in book referred to under
Fig. 18.Fig. 22 Same as Fig. 128 (p. 273) in book referred to under
Fig. 18.Figs. 23-28 Supplied.
Unpaginated | Vol_VII-0310
REFERENCE TO LITERATURE
1. Baur, F. “Das Klima der bisher erforschten Teile der Arktis.”
Arktis, No. 2, Gotha, 1929.2. Bedient, H. A. Unpublished Report. Air Weather Service,
Washington, D. C., 1950.3. Bergeron, T., Geofys. Pub., Vol. 5, No. 6, Oslo, 1928.
4. Bogolepow, M. Met Zeitschr. Vol. 49, No. 7, p. 258-261. 1932.
5. Brontman, L. “On the Top of the World.” Victor Gollancz Ltd.
London, 1938.6. Canadian Dept. of Marine and Fisheries. “Report of the Meteoro–
logical Services of Canada for the Year Ending December 31, 1908.”
Ottoawa, 1912.7. Canadian Dept. of Transport. “Canadian Polar Year Expedition,
1932-1933. Meteorology.” Vol. I. Ott oawa, 1940.8. Carmichael, H. and Dymond, E. G. Proc. Roy. Soc. Ser. A. Math.
and Phys. Sci., Vol. 171, pp. 345-359. London, 1939.9. Collinson, Sir Richard. “Journal of the Enterprise,” p. 176.
10. Craig, R. A. Am. Met. Soc. Monographs, Vol. 1, No. 2. Boston,
Mass., 1950.11. Dobson, G.M.D., Proc. Roy. Soc. London, A, 129, 1930; A, 185,
1946; A, 110, 1926; A, 114, 1929.12. Dorsey, N. G. “Meteorological Characteristics of Northern Arctic
America.” (unpublished). Mass. Inst. of Tech., 1949.13. Dzerdzerjevski, B. L. “Circulation Schemes in the Troposphere
over the Central Arctic.” Inst. of Theoretical Geoph. Moscow
and Leningrad. 1945.
304 | Vol_VII-0311
14. Flohn, H. Polarforschung, Ser. II, 17(1-2): pp. 143-149.
Kiel, 1947.15. Gutenberg, B. Bul. Am. Met. Soc., Vol. 20, pp. 192-201.
16. Hann, J. and Suring, R., “Lehrbuch der Meteorologie,” p. 180,
Leipzig, 1937.17. Haurwitz, B. and Austin, J. M., “Climatology,” McGraw-Hill,
New York, 1944.18. Helmholtz, H. von. Met. Zeitschr. Bd. 5, pp. 329-340. 1888.
19. Holz, R. S. “Pole Vaulting for Weather.” Unpublished. Air
Weather Service, Washington, D. C., 1950.20. Hovm o ö ller, E. Meddelelser om Gr o ö nland, Bd. 144, No. 1,
Appendix 1. 1947.21. International Meteorological Organization, Publication No. 62,
Lausanne, 1948.22. Kaye, G.W.C. and Evans, E.J., Nature, Jan. 1939.
23. Koch, J. P. and Wegener, A., Meddelelser om Gr o ö nland, Vol. 75,
pp. 405-676.24. K o ö ppen, W., “Die Klimate der Erde”, Berlin, 1923.
25. K o ö ppen, W. “Klimakunde von Russland.” Handbuch der Klimatologie,
Band III, Teil N. Berlin, 1939.26. Malmgren, F. Geofys. Pub., Vol. 4, No. 6. Oslo, 1926.
27. Meteorological Division, Dep. of Transport, “Meteorology of the
Canadian Arctic”, Toronto, 1944.28. Mohn, H. “Meteorology.” The Norwegian North Polar Exp. 1893-1896.
Vol. VI. Christiania, 1905.
305 | Vol_VII-0312
29. Mohn, H. “Report on the Scientific Results of the Second Nor–
wegian Arctic Expedition in the Fram. 1898-1902.” Christiania,
1907.30. Namias, J. and Smith, K. “Normal Distribution of Pressure at
10,000 feet over the Northern Hemisphere.” U. S. Weather Bureau,
Washington, D. C., 1944.31. Petterssen, S., “Weather Analysis and Forecasting,” McGraw-Hill,
New York, 1940.32. Petterssen, S. Proceedings of the Centenary Celebrations, Roy.
Met. Soc., London, 1950.33. Phillips, W., Unpublished report on flying hazards at Alaskan air–
fields. Air Weather Service, Washington, D. C., 1951.34. Rigby, M. “Climatology of the Arctic Regions.” Parts I-III.
Air Weather Service, Washington, D. C., 1946.35. Roberts, B., The Polar Record, Vol. 4, No. 27.
36. Rothwell, P., J. of Acoust. Soc. of Am., Vol. 19, pp. 205-221.
37. Saby, S. and Nyborg, W. L., J. of Acoust. Soc. of Am., Vol. 18,
pp. 316-322.38. Scoresby, W., Trans. Roy. Soc. of Edinburgh, Vol. 9, pp. 299-305.
1821.39. Simpson, G. C. “Meteorology.” British Antarctic Exp., 1910-1913.
Vol. I. Discussion. Calcutta, 1919.40. Sorge, E., Geog. Journ. Roy. Geog. Soc., Vol. 81; 333-352. 1933.
41. Stefansson, V. “The Friendly Arctic.” New York, 1943.
42. Sverdrup, H. U., Petersen, H. and Loewe, F., “Klima des
Kanadischen Arkipels und Gr o ö nlands.” Handbuck h der Klimatologie,
edited by K o ö ppen and Geiger. Vol. II, Part K. 1935.
306 | Vol_VII-0313
43. Sverdrup, H. U. “Meteorology, Part I, Discussion.” The
Norwegian North Polar Expedition with the Maud. Scientific
Results, Vol. II. Bergen, 1933.44. Sverdrup, H. U. “Meteorology, Part II, Tables.” The Norwegian
North Polar Expedition with the Maud. Scientific Results, Vol. II.
Bergen, 1933.45. Tikhomirova, E. I. “Klimaticheskii Ocherk Karskogo Maria” (Climatic
Outline of the Kara Sea). Trans. Arctic Sci. Res. Inst. U. S. S. R.
Vol. 187. Moscow, Leningrad, 1946.46. T o ö nsberg, E. and Langlo Olsen, K. L., Geofys. Pub., Vol. 13,
No. 12, Oslo, 1944.47. U. S. Weather Bureau, “Normal Weather Maps,” Washington, 1944.
48. U. S. Weather Bureau and Air Weather Service. “Upper Air Wind
Normals for the Northern Hemisphere.” Washington, D. C., 1945,
(Unpublished).49. Vederman, J. and Smith, C. D., Bul. Amer. Met. Soc., Vol. 31,
No. 6: 197-205. 1950.50. Waelchen, K., Zeitschr. f. Geophys., Vol. 10, p. 322.
51. Wegener, A., “Danmark Expeditionen til Gr o ö nlands, Nordostkyst
1906-08,” pp. 127-355.52. Wegener, A., Medelelser om Gr o ö nland, Vol. 42, p. 561.
53. Wexler, H., Monthly Weather Review, Vol. 64, No. 4, Washington,
1936.54. Wexler, H., Bul. Amer. Met Soc., Vol. 29. No. 10; 547-550. 1948.
55. Whipple, F. W. Proc e é s Verbaux, Intern. Met. Assoc., Edinborough,
1936.
307 | Vol_VII-0314
56. Wiese, W. “Scientific Results of the Arctic Expedition on the
Sedov.” Trans. of the Arctic Inst., Vol. 1, 1936.
308 | Vol_VII-0315
LEGEND TO DIAGRAMS
Fig. 1. The principal climatic zones of the northern hemisphere.
Ref. Kőppen [ 24 ] .Fig. 2. Mean meridional distribution of temperature. Ref. Hann
and Sűring [ 16 ] .Fig. 3. Mean meridional distribution of ozone. Ref. Craig [ 10 ] .
the unit of ozone amount is the equivalent height of a
column of ozone at standard pressure and temperature.Fig. 4. Mean meridional distribution of relative humidity. Ref.
Haurwitz and Austin [ 17 ] .Fig. 5. Some typical examples of temperature soundings. Upper
diagram: July. Lower diagram: January. Ref. Canadian
Meteorological Service [ 27 ] .Fig. 6. Mean meridional cross-section of temperature (°C) in
January. Ref. Petterssen [ 32 ] .Fig. 7. Mean meridional cross-section of temperature (°C) in
July. Ref. Petterssen [ 32 ] .
309 | Vol_VII-0316
LEGEND TO DIAGRAMS (cont.)
Fig. 8. Mean meridional cross-section of annual variation of
temperature (°C.)Fig. 9. Some examples of temperature inversions in the Arctic. Fig. 10. Annual variation of temperature inversions. Ref.
Sverdrup [ 43 ] .Fig. 11. Relation between inversion conditions and wind speed
and cloudiness. Ref. Canadian Meteorological Service
[ 27 ] .Fig. 12. Diagrammatic representation of sound beams. A: Uniform
temperature; B: Normal lapse rate; C: Inversion with
sound source below the inversion; D: Inversion with
sound source above inversion layer; E: Multiple
inversion; F: Influence of wind.Fig. 13. Superior mirage. Upper picture Gundahl’s Knold (76°43′ N.,
32°01′ W.) without optical distortion. Lower picture strong
vertical distortion due to inversion layer. Ref. [ 23 ] .
310 | Vol_VII-0317
LEGEND TO DIAGRAMS (cont.)
Fig. 14. Diagramatic representation of looming. Hatched
areas indicate twilight or darkness.Fig. 15. Inferior mirage near Cape Bismark, 1st Oct. 1907.
Ref. Wegener [ 51 ] .Fig. 16. Telescopic appearance of ships, as observed in the
Greenland Sea, June 28th, 1820, 73°30′N., 11°10′W.
Ref. [ 38 ] .Fig. 17. Telescopic appearance of east coast of Greenland, at
a distance of 35 miles, July 18th, 1820, 71°20′N.,
17°30′W. Ref. [ 38 ] .Fig. 18. Source region of principal air masses in winter.
Ref. Patterssen [ 31 ] .Fig. 19. Source region of principal air masses in summer.
Ref. Petterssen [ 31 ] .Fig. 20. Mean position of main frontal zones in winter.
Ref. Petterssen [ 31 ] .
311 | Vol_VII-0318
LEGEND TO DIAGRAMS (cont.)
Fig. 21. Mean position of main frontal zones in summer.
Ref. Petterssen [ 31 ] .Fig. 22. Cross-section through principal frontal zones.
Ref. Petterssen [ 31 ] .Fig. 23. Example of synoptic situation, showing traveling
cyclones and anticyclones.Fig. 24. Mean meridional distribution of percentage frequencies
of cyclogenesis (CG), cyclone centers (C), anticyclo–
genesis (AG), and anticyclones (A) in squares of 100,000
sq. kilometers. Ref. Petterssen [ 32 ] .Fig. 25. Geographical distribution of percentage frequency of
cyclones in winter. Ref. Petterssen [ 32 ] .Fig. 26. Geographical distribution of percentage frequency of
cyclones in summer. Ref. Petterssen [ 32 ] .Fig. 27. Geographical distribution of percentage frequency of
anticyclones in winter. Ref. Petterssen [ 32 ] .
312 | Vol_VII-0319
LEGEND TO DIAGRAMS (cont.)
Fig. 28. Geographical distribution of percentage frequency
of anticyclones in summer. Ref. Petterssen [ 32 ] .Fig. 29. Mean surface pressure for January (in mbs.)
Ref. Dorsey [ 12 ] .Fig. 30. Mean surface pressure for April (in mbs.)
Ref. Dorsey [ 12 ] .Fig. 31. Mean surface pressure for July (in mbs.)
Ref. Dorsey [ 12 ] .Fig. 32. Mean surface pressure for October (in mbs.)
Ref. Dorsey [ 12 ] .Fig. 33. Mean altitude of the 700-mb. pressure surface for
January (in feet). Revised from Namias and Smith [ 30 ] .Fig. 34. Mean altitude of the 700-mb. pressure surface for July
(in feet). Revised from Namias and Smith [ 30 ] .Fig. 35. Surface wind roses-Mean distribution of the surface
wind by both speed (mph) and direction. Winter.
313 | Vol_VII-0320
LEGEND TO DIAGRAMS (cont.)
Fig. 36. Surface wind roses-Mean distribution of the surface
wind by both speed (mph) and direction. Summer.Fig. 37. Example of diurnal variation of wind speed over the
pack-ice and at the coast. Ref. Sverdrup [ 43 ] .Fig. 38. Mean air flow and upper wind distribution at 3 Km.
(10,000 feet) during winter. Long arrows give mean
flow pattern. Wind roses showing frequency distribution
of various wind directions and speeds have been entered
for certain stations, and sector mean winds are given
for certain locations.Fig. 39. Mean air flow and upper wind distribution at 3 Km.
(10,000 feet) during summer. Long arrows give mean
flow pattern. Wind roses showing frequency distribution
of various wind directions and speeds have been entered
for certain stations, and vector mean winds are given
for certain locations.
314 | Vol_VII-0321
LEGEND TO DIAGRAMS (cont.)
Figure 40. Mean air flow and upper wind distribution at 6 Km.
(20,000 feet) during winter. Long arrows give mean
flow pattern according to (ref. 48). Wind roses showing
frequency distribution of various wind directions and
speeds have been entered for certain stations, and
vector mean winds are given for certain locations
(ref. 48). Wind roses near the 40,000-foot level are
shown in the inset.Figure 41. Mean air flow and upper wind distribution at 6 Km.
(20,000 feet) during winter. Long arrows give mean
flow pattern according to (ref. 48). Wind roses showing
frequency distribution of various wind directions and
velocities have been entered for certain stations, and
vector mean winds are given for certain locations
(ref. 48). Wind roses near the 40,000-foot level are
shown in the inset.
315 | Vol_VII-0322
LEGEND TO DIAGRAMS (cont.)
Figure 42. Frequency distribution of wind according to direction,
3 Km. (10,000 feet) during winter.Figure 43. Frequency distribution of wind according to direction,
3 Km. (10,000 feet) during summer.Figure. 44. Mean surface temperature (°F) during January. Figure. 45. Mean surface temperature (°F) during July. Figure 46. Mean surface temperature profile along 140 E. meridian
(approximately).Figure 47. Examples of the diurnal variation of temperature at
Arctic stations with continental and maritime climate.
Ref. Sverdrup [ 43 ] .Figure 48. Mean precipitation amounts (inches). Figure 49. Mean snow depth on ground (inches). Figure 50. Diurnal variation of relative humidity and vapor
pressure over the pack-ice. Ref. Sverdrup [ 43 ] .Figure 51. Mean cloudiness during February (percentage of total
cover).
316 | Vol_VII-0323
LEGEND TO DIAGRAMS (cont.)
Figure 52. Mean cloudiness during August (percentage of total
cover).Figure 53. Station locator map.